

1. Introduction
The importance of the woollen industry to the English economy is well recognised.Footnote 1 Woollen cloths were the country's leading export industry by the end of the fifteenth century, a position maintained for three hundred years.Footnote 2 In 1700, the industry accounted for 26 per cent of English output and it was not until circa 1800 that the value added from cotton exceeded that from wool.Footnote 3 The woollen manufacture was comprised of two distinct parts, namely wool cloths produced from the fleece of shorthaired sheep, and worsteds woven from the coarser wool of long-haired sheep. The differing nature of the raw materials led to different manufacturing processes. The short staple used for wool was separated into lengths and prepared for spinning by a process known as carding. Wool cloths, woven with a wool warp and wool weft, had a loose weave that was required to be saturated with water and beaten, a process known as fulling, before the cloth was suitable for use. The weave in a wool cloth was invisible. Carding was unsuitable for the long-worsted wools. These wools were readied for spinning by treatment with hot oil and then straightened into parallel lengths by combing. The weave in most worsted was tighter than that of wool, fulling was normally not required, and the weave was visible.Footnote 4
At the onset of the eighteenth century, three major cloth-producing regions were established in England. These were in the West Country, in the counties of Gloucestershire, Somerset, Wiltshire, Devon and Dorset, in the West Riding of Yorkshire and in East Anglia, particularly in Norfolk, in and around the city of Norwich.Footnote 5 There was regional specialisation in the types of cloth produced. In the West Country, Gloucestershire was well known for the quality of its broad wool cloth and Devon for worsted serge production. The West Riding manufacture industry was essentially of wool cloth only. A worsted industry was developing in and around Halifax parish, but at this time it was in its infancy.Footnote 6 Norwich was recognised as the chief centre in England for fine quality worsted cloth production and for textile innovation. The cloths produced, so-called Norwich stuffs, were woven from worsted/wool/silk combinations. Norwich stuffs were used to make dresses, petticoats, coat linings, curtains, and hangings.Footnote 7 The range of cloths was vast and constantly updated to meet the demands for fashion.Footnote 8 The fabrics were specialist and difficult to wash without inflicting damage. They were worn by the ‘not-too-affluent squire's lady or the tradesman's wife’.Footnote 9 Penelope Corfield has described the stuffs to be lighter and more decorative than the heavier serges and bays. These cloths were cheaper than luxury imported fabrics and were aimed not at the masses but at the semi-fashionable market.Footnote 10 Norwich manufacturers were well known for their ability to weave intricate patterns. Their dyes were crisper, richer and used more complex combinations than the cloths from the West Riding.Footnote 11 Devon serge and Norwich stuffs were different cloths with different uses and as such did not directly compete with one another. Although worsteds were manufactured elsewhere in England, for example, in Northamptonshire, Kent, and Warwickshire, production in these counties was relatively small, and the fabrics produced did not rival the quality of the Norwich output.Footnote 12
It is known that East Anglia and the West Country de-industrialised sometime over the eighteenth and early nineteenth centuries as the textile industry moved to northern counties. The timing of de-industrialisation, however, has not been extensively studied by academic historians. Recently, an occupational analysis of the baptism registers of England and Wales, 1813–1820, has suggested that by that time the shift to the north was essentially complete. Two thirds of adult males working in textile manufacture in 1813–1820 were now living in either Lancashire or the West Riding.Footnote 13 Only approximately 7 per cent lived in the West Country and less than 3 per cent in Norfolk, Suffolk and Essex combined. The analysis indicates there were approximately sevenfold more adult male textile workers in the chief West Riding worsted/wool-making parishes of Leeds, Bradford, and Halifax than there were in Norwich. In the cotton parish of Manchester, there were near four times as many as in Norwich. Although the Norwich industry was of little national significance by this time, it did remain important to the local economy. Approximately one quarter of fathers listed in the baptism registers worked in textile manufacture.
These data on the relative importance of the Norwich textile industry to the national economy are in conflict with the views expressed by J. H. Clapham in 1910. Clapham's paper on the transference of the worsted industry from Norfolk to the West Riding proposed that the Norwich industry did not significantly decline until after 1818.Footnote 14 Several reasons for the timing of the decline were postulated. For instance, the fine cloths produced by the Norwich weavers were not in direct competition with those woven in the West Riding. Norwich manufacturers were reluctant to embrace mechanisation, perhaps hampered by the lack of cheap local coal. Clapham believed that the coal and iron mines in the West Riding enabled a close connection between the textile and engineering trades. The 1813–1820 baptism analysis, however, suggests that the transfer was made before that time. Moreover, the link to coal and iron could not have been a key factor since steam power had yet to be introduced into English woollen manufacture. We need, therefore, to look elsewhere for causal factors. When and why did the Norwich industry begin its decline from a position of pre-eminence in 1700 to one of little national significance approximately one hundred years later? These are important economic questions to be answered in order to better understand textile de-industrialisation in southern England. As Richard Wilson pointed out in 2004, ‘almost a century ago, Sir John Clapham wrote that the transference of the worsted industry from Norwich to the West Riding raised “questions of fact and problems of causation of the first interest”. Although a good deal has been written about the subject since, it still does.’Footnote 15
Since Clapham, several other historians have studied the demise of the Norwich textile manufacture. The historiography of the transfer to the West Riding is complicated, however, because the discussion is sometimes at cross-purposes, muddling the two concepts of absolute and relative decline, effectively treating them as one and the same. The purpose of this article is to clarify the arguments of others and then build upon them. It begins with an outline of the historiography and then presents new evidence from various occupational sources. Male occupations abstracted from wills, freemen lists, poll books, quarter sessions records, 1813–1820 baptism registers, and the 1851 census have been used for this purpose. Causal factors are discussed. The competition from Lancashire printed fustians and cottons is a likely significant factor, more so than competition from West Riding worsteds. The loss of export trade due to various wars in the second half of the century was contributory also. Analysis of the 1851 census confirms the trend, identified in the 1813–1820 baptism registers, that Norwich manufacturers responded to the competitive threat by switching to the use of silk in their cloths, adopting a niche position at the high end of the market.
2. The historiography of decline
There are few reliable eighteenth-century estimates of the number of people involved in the Norwich industry. Ursula Priestley has lamented the ‘almost complete lack of statistical data’.Footnote 16 Of those that are available, a spokesman for the Norwich weavers claimed there were approximately five hundred master weavers in the city, in control of around six thousand looms in 1719.Footnote 17 In 1724, Daniel Defoe estimated that 120,000 people in and around the city were involved in the trade.Footnote 18 This estimate, similar to that provided in Malachy Postlethwayt's 1766 Universal Dictionary of Trade and Commerce, is likely an exaggeration given that it represents approximately one half of the Norfolk population of 251,435 in 1761.Footnote 19 The eighteenth-century commentator Arthur Young estimated that the manufacture in Norwich and the surrounding district grew threefold 1700–1770.Footnote 20 By the latter date, the trade, valued at £1,200,000, involved 72,000 people and was neither ‘brisk nor dull. They [Norwich manufacturers] could execute more orders than they have.’ John James, a nineteenth-century commentator, believed the West Riding worsted manufacture employed 84,000 people in 1772, the output valued at £1,404,000.Footnote 21 The data suggest that the Norwich and West Riding industries were of similar size by this time. According to James, Norwich stuffs reached their ‘highest state of greatness’ during 1743–1763.Footnote 22
Several other commentators also estimated the size of the Norwich trade. For instance, Maximilien de Lazowski, a French traveller and friend of Arthur Young, valued the annual turnover of the Norwich industry in 1784 at £1,700,000.Footnote 23 R. Beatniffe's Norfolk Tour, published in 1773, reiterates Arthur Young's Norwich statistics and notes that twelve thousand looms, each providing work for six people, were employed.Footnote 24 A later edition of Beatniffe's book, published in 1808, estimated the number of working looms was by now reduced to eight thousand.Footnote 25 Taylor's monthly magazine, 1798, estimated that seventy thousand people and eight thousand looms were employed.Footnote 26 A. Rees's cyclopedia, 1818, stated ten thousand looms were active.Footnote 27 Eighteenth- and early nineteenth-century statistics are known to be unreliable and it is not clear from the literature whether these commentators were simply re-iterating each other's views, or whether they had access to alternative sources. The accuracy of these statistics notwithstanding, the implication is that the value of the West Riding output roughly matched that of Norwich by the last quarter of the eighteenth century.
In the 1960s, J. K. Edwards reviewed the historiography of the Norwich decline.Footnote 28 For him, there were three schools of thought, those of Clapham, those of M. F. Lloyd Prichard and those of himself. Clapham was concerned with the relative size of the Norwich and West Riding manufactures. Lloyd Prichard was interested in the absolute decline and attributed the near sevenfold rise of Norwich poor returns, 1745-95, to the collapse of the textile industry.Footnote 29 Edwards, who was also interested in the absolute viability of the Norwich industry, believed that the Norwich trade flourished until at least the mid-nineteenth century.Footnote 30 He gave three reasons for this. First, arguing along similar lines to Clapham, the Norwich and West Riding cloths were different and as such they did not compete in the marketplace. Second, there was a marked increase in the export of Norwich cloth through Yarmouth, 1750–1780. Third, there was an increase in the wealth of a small number of Norwich manufacturers, 1781–1792.
Writing in the 1970s, Martin Daunton sides with Clapham and thought ‘certainly, it is unlikely that any actual or even relative decline started in the eighteenth century’.Footnote 31 Penelope Corfield, concerned with the absolute success of Norwich manufacture, believes ‘very clearly that the decisive change in the importance of the textile industry as an employer of labour in Norwich dates from the later 1820s onwards’.Footnote 32 Julian Hoppit's 1980s study of bankruptcy took a relative view of the national textile industry and lent support to Lloyd Prichard's conclusion. Hoppit worked with the premise that as regional business prosperity declined, so did the number of bankruptcies when expressed as a percentage of the national total. He showed a near sevenfold decline in Norfolk textile bankruptcies, 1740–1800, at a time when textile bankruptcies in Yorkshire increased by 40 per cent and those in Lancashire by more than fivefold.Footnote 33 Hoppit concluded that ‘the dwindling proportion of textile bankrupts … at the very least … reflects the shortfall of dynamism and opportunity in these areas [Norfolk]’.Footnote 34
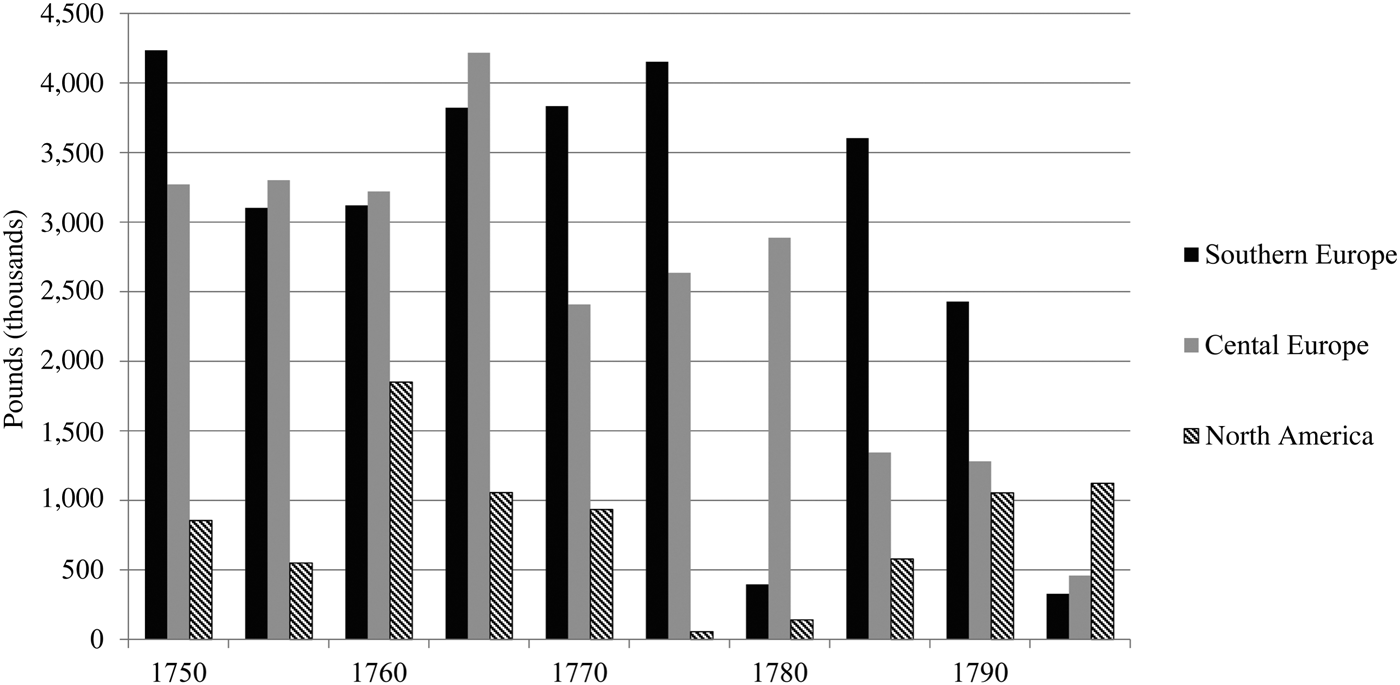
That the Norwich trade likely suffered during the eighteenth century is also supported by examination of the exports of English stuffs. For instance, Elizabeth Schumpeter's data show that the central European and North American stuffs markets collapsed after 1760, a consequence of the Seven Years’ War, 1754–1763, and the impact felt after the 1765 Stamp Act with the imposition of taxes upon the British North American colony.Footnote 35 Exports to North America, further impacted by the American War of Independence, 1775–1783, declined to less than one tenth of those in 1760 (Figure 1).Footnote 36 With the loss of these markets, and with 80 per cent of the Norwich output exported, it is difficult to believe that the industry was not adversely impacted.
Export of stuffs (1750–1795) (expressed as pounds in weight). Note: 1750–1790 figures are for England and Wales, 1795 figures are for Great Britain. All relate to single years. Source: E. B. Schumpeter, English overseas trade statistics 1697–1808 (Oxford, 1960).

3. New evidence from occupational sources
Each of the male occupational sources utilised in this work have merit in their own right, but it is as a collective, supporting and correlating with each other, where their value is particularly useful. The sources are considered in turn, and we begin with evidence abstracted from wills, chosen as the starting point because these data are available for the earliest time period, the seventeenth century, and as such allow for the timing of the movement of the textile industry from rural areas and into Norwich to be established. The eighteenth-century sources are utilised to determine the absolute decline of the Norwich industry. The nineteenth-century sources are used to show the size of the Norwich industry at that time relative to elsewhere in England, notably Lancashire and the West Riding. The analysis of all sources is focused upon weavers, the male occupation that was the most numerous.Footnote 37
3.1. Wills
That wills were socially selective, and left by a minority of people, is well known. The poorer the person, the more unlikely he or she was to leave a will because he or she had less to pass on. Some occupations featured more often in testamentary data than did others. For instance, gentry were more likely to leave a will than were husbandmen, who in turn were more likely to do so than were labourers.Footnote 38 Although the data are limited, their utility has been examined by several historians. For instance, Marie Rowlands has drawn upon probate inventories to identify the occupations and parishes of metal workers in the West Midlands.Footnote 39 Jon Stobart has used inventories extensively to describe the industrial development in north-west England, c. 1700–1760.Footnote 40 W. A. B. Court did so in his analysis of Midland industries.Footnote 41 Others have questioned their reliability, but recently Sebastian Keibek, using probate data in an extensive study to estimate county historical occupational structures, has concluded that they provide a consistent record of occupations over long time intervals.Footnote 42 There is no reason, therefore, to believe that the records used here are not a reasonable reflection of temporal change in Norfolk worsted weaving.
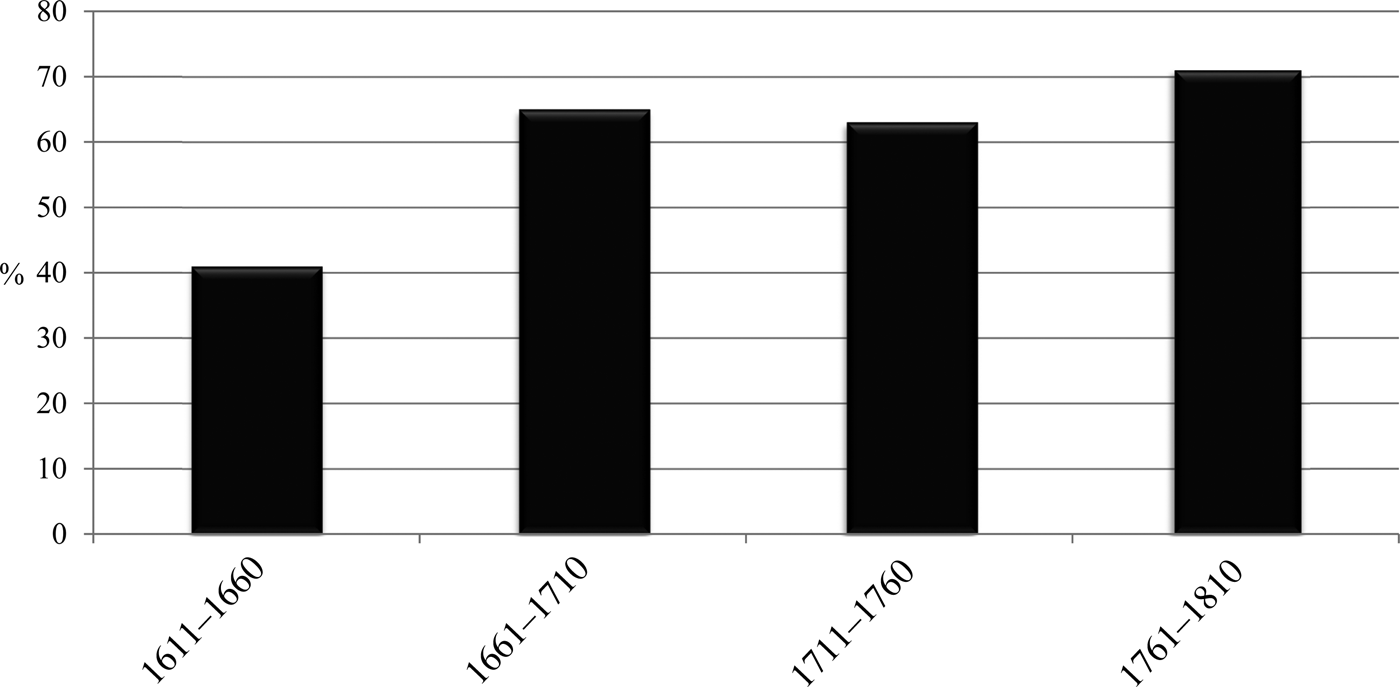
Prior to 1858, Norfolk wills were proved in church courts at one of three levels. These were the Prerogative Court of Canterbury, which had authority over all, the Norwich Consistory Court and, at the lowest level, the Archdeaconry and Peculiar Courts. Executors of wills were expected to apply to the lowest court available, but in practice, for reasons of prestige or to forestall opposition, this did not always happen.Footnote 43 The Norwich Consistory Court had jurisdiction over the Diocese of Norwich. Those wills proved in the Consistory Court and transcribed by M. A. Farrow, T. F. Barton, A. L. Bedingfield, and J. Kennedy, have been used in this study.Footnote 44 Each transcription lists the year of the will, the person's name, their parish of residence, and often occupation.Footnote 45 The analysis of these wills for all worsted weavers in Norfolk and in Norwich, 1611–1810, shows a consolidation of weavers into the city during the last half of the seventeenth century (Figure 2).Footnote 46 In the period 1610–1660, two fifths of weavers lived in Norwich, but by 1661–1710, the number had risen to approximately two thirds, a level that remained for the following one hundred years.
Wills: the percentage of Norfolk worsted weavers resident in Norwich (1611–1810) (n = 700). Sources: See the text.

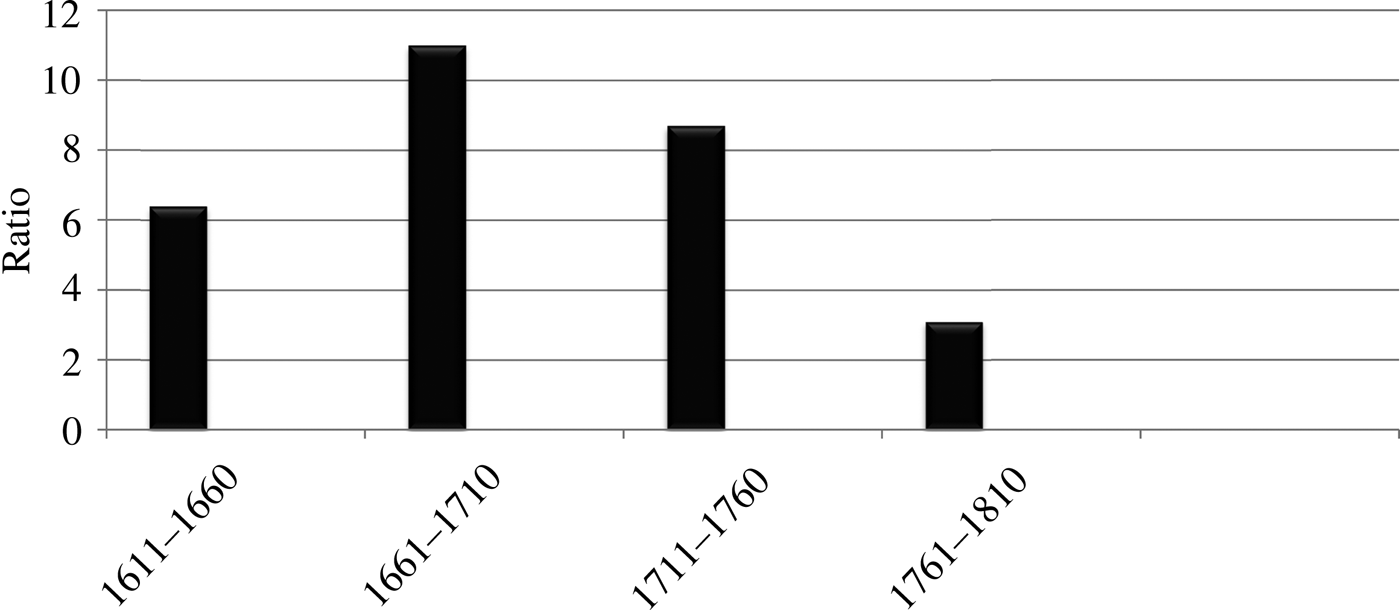
The transcriptions have not been digitised and it is impractical to determine precisely how many with an occupation were left by Norwich men. It is not possible, therefore, to determine the temporal change in the percentage who were weavers. The change over time can be estimated indirectly, however, by comparison of the number with those employed in another occupation. Carpenters are chosen for this purpose because, as a building trade, they are considered a good guide of population growth. These comparative data show the beginning of relative decline in weavers in Norwich after 1661–1710, and a trend that continued throughout the eighteenth century (Figure 3).
Wills: Norwich worsted weavers (1611–1810) (n = 430) (expressed as a ratio to carpenters). Sources: See the text.

3.2. Freemen
David Stoker notes ‘the key to the practice of any trade in Norwich, and in comparable provincial cities, lay in the admission of tradesmen to the Freedom of the City’.Footnote 47 Freedom was a privilege for men only. Freemen had the right to vote, to accept municipal office and to bind apprentices, and, in turn, were obliged to serve on juries and perhaps pay fees and taxes. The son of every freeman had the right to become a freeman himself on reaching the age of 16 years, provided he was not serving an apprenticeship. Others became freemen either by service, by purchase, or by order of the governing body. The enrolment of freemen was skewed towards the master craftsmen. The names of freemen were recorded in registers, which, from the fifteenth century onwards, also listed occupation. The Norwich registers of 1714–1752, have been transcribed by Percy Millican and subsequently tabulated, by occupation, by Edwards.Footnote 48 The registers after 1752 have been transcribed and tabulated by occupation by S. Howell and K. Howell.Footnote 49 Both of these transcriptions have been used in this study.
An issue with the freeman registers is that, despite the obligation to enrol, some eighteenth-century tradesmen were keen to default, deterred by the obligations and costs subsequently put upon them. It is not possible to determine the proportion that did default, but Millican has given pointers to those time periods when the rules of entry changed or pressures to enter were brought to bear. For instance, he noted that in 1729, to combat corruption at elections, it was stipulated that no freeman could vote in elections for Members of Parliament, for Mayors or for Sheriffs, unless he had been admitted to freedom for at least 12 calendar months. It was believed that this discouraged some men from membership. Accordingly, the stipulation was amended in 1741 when the Norwich authorities ordered, and enforced with rigour, that ‘that no person for the future, being a foreigner, should be permitted to exercise any trade in the city longer than six months without taking up the freedom of the city’.Footnote 50 Those tradesmen who failed to do so were summoned to appear before the Assembly.Footnote 51
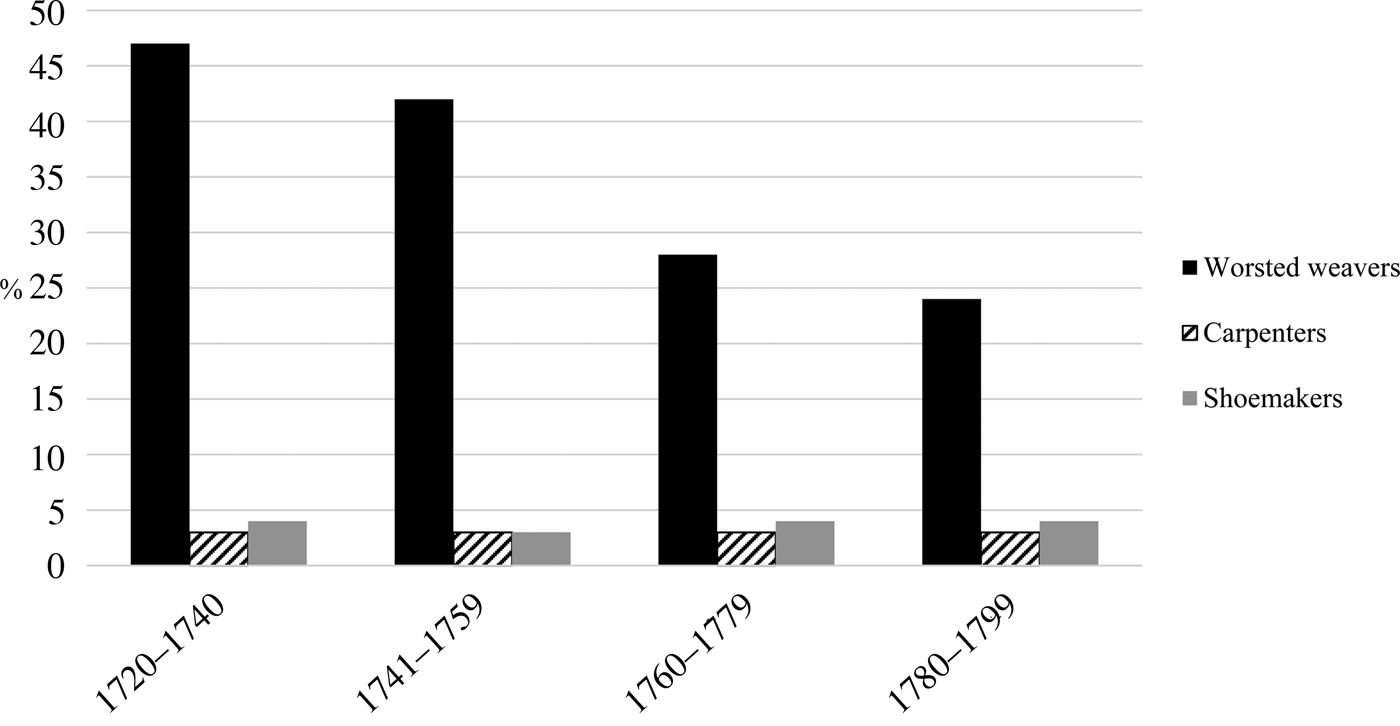
As with the evidence from wills, freemen lists are used here, not to generate an absolute measure of the actual number of weavers, but to gauge change over time. The Norwich freemen registers have been used by others, but their work was restricted to an analysis of selected years only over limited periods of time, whereas the study conducted here is over a longer time span and as such more able to distinguish longer-term change.Footnote 52 The freemen registers, 1720–1819, contain 3,003 entries for worsted weavers. The percentage who were worsted weavers declined steadily from 1720–1740 (Figure 4). It could be argued that the recording of the occupation of freemen was inconsistent over time. To test this suspicion, the percentage who were either carpenters or shoemakers has also been studied, for the period 1720–1799. The percentage in both occupations remained steady over the period, albeit at a low level, providing confidence that the drop in the number of weavers is a reasonable reflection of change.
Freemen: worsted weavers (n = 2,711), carpenters (n = 209), and shoemakers (n = 289) (1720–1799) (expressed as a percentage of all freemen). Sources: See the text.

3.3 Poll books
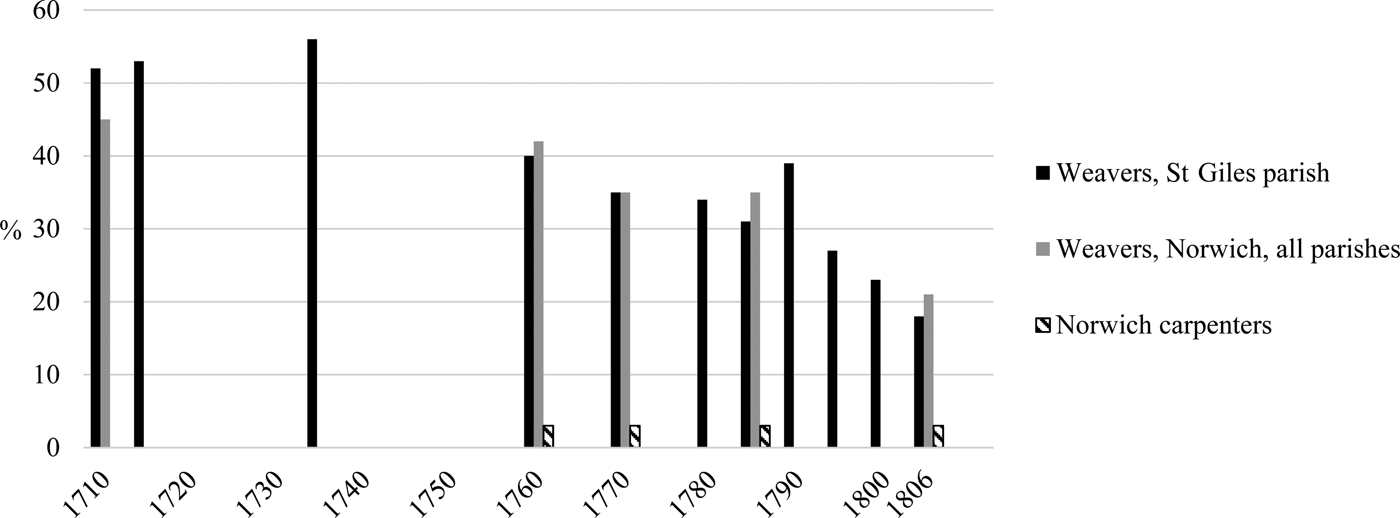
In eighteenth-century England, the right to vote differed between county and borough. In the county, only those with freehold property worth £2 or more, the ‘Forty Shilling Freeholders’, were entitled to do so.Footnote 53 The right in the boroughs belonged to the freemen.Footnote 54 In Norwich, two burgesses had been sent to Parliament since the late thirteenth century. The elections, prior to 1730, were confined to freemen only but post-1730, and before the Reform Act of 1832, freeholders were also given the right to vote.Footnote 55 The eighteenth-century elections were not undertaken by secret ballot and, in compliance with an Act of 1696, all returning officers were required to make copies of the poll available.Footnote 56 This requirement continued to 1868. Some Norwich poll books, although not all, list the occupation of the voter. The books that do so include the polls of 1710, 1714, 1761, 1786, and 1806.Footnote 57 These books are available in printed form and are used in this study. In addition, Sir Peter Eade recorded the parish voting registers of several other years in his account of the Norwich parish of St Giles. These records include occupations and have also been utilised in this work.Footnote 58
In each of these eighteenth-century elections, the votes of approximately two thousand Norwich men are recorded. Of these men, at least 88 per cent had a given occupation. For the poll books from 1761 onwards, 98 per cent were assigned an occupation. The proportion of these men who voted in 1761 has been determined using Tony Wrigley's estimates of population for that year and, from his work with others, to show that 23 per cent of the population were males aged 20 and over.Footnote 59 From this, it is estimated that around one quarter of Norwich men voted. As with wills and freemen lists, therefore, these men are an imprecise representation of the male population. Nonetheless their analysis suggests a fall-off in worsted weaving after 1760 (Figure 5). As with occupations recorded in the freemen registers, there is a need to check for temporal consistency in these poll books. Carpenters are used for this purpose to show little change 1760–1806.
Poll books: worsted weavers and carpenters in Norwich and in St Giles parish (1710–1806) (expressed as a percentage of all voters). Sources: See the text.

A precise interpretation of the trend over time in worsted weaving is difficult because the data are of low frequency. More recurrent data, however, are available from Eade's transcription of the parish of St Giles, 1710–1830. To put St Giles into perspective, it was one of 35 Norwich parishes, and in 1801 was home to 2.9 per cent of the city population.Footnote 60 The parish was also home to around only 4 per cent of the worsted weavers in Norwich, 1710–1786. While these are obviously low numbers, and not ideal, the changes in the voting patterns in St Giles are consistent with those in all Norwich parishes.Footnote 61 The parish appears to be a reasonable proxy for the city, and suggests a decline in the number of worsted weavers from around 1740 onwards, lending support to the timing of change observed from the analysis of freemen registers.
3.4. Quarter Sessions Records
The data abstracted from wills suggest that Norfolk worsted weaving became more concentrated in Norwich during the second half of the seventeenth century. The data recorded in wills, freemen lists, and poll books indicate a downward change in worsted weaving in Norwich from around 1740 onwards. As noted previously, these sources are problematic because they are all skewed to the elite in society. Consequently, it could be argued that the data derived from them is not a reflection of absolute decline of the industry, but instead indicative of consolidation within the industry, that is, a reduced number of master weavers who employed a similar number of journeyman weavers as previously. This point is particularly pertinent given that Priestley believes that consolidation did occur, such that, by 1770 ‘there were perhaps no more than thirty manufacturing firms in the city’.Footnote 62 There are other sources, however, such as court records, which provide the opportunity to examine occupations across a broader social scale because petty crime was as likely to be committed by those at the lower end of society as it was by the elite. Most offences carried out in England and Wales, for example, assault, theft, and damage to property, were classified as petty.Footnote 63 It has been estimated that there were ninefold as many defendants accused of such misdemeanours, from a wide range of social classes, than there were accused of felonies.Footnote 64
The Quarter Sessions were a judicial authority for petty crime. Presided over by a Justice of the Peace, they were convened four times a year, at Easter, Trinity, Michaelmas and Epiphany. Given the expense and time involved, before a case reached the court it followed the route of prior consultation from which, thereafter, the justice had three courses of action: first he could mediate a solution to the charge there and then. Alternatively, for some offences he could issue a summary conviction on the spot.Footnote 65 Few theft cases were prosecuted in this manner.Footnote 66 The third course of action permitted the justice to issue a penal bond, a recognisance, which committed the prosecutor, the defendant and the witnesses to act. These commitments were to keep the peace, to be of good behaviour, to attend a future Sessions to either prosecute, answer a charge, or to provide evidence.Footnote 67 In addition to those involved directly with the case, and to guarantee compliance, the justice required sureties to be bonded by others, for example, by next of kin, neighbours, employers, or co-workers. Many of these sureties were requested from persons with a similar social background.Footnote 68
If the accused was charged, then an indictment was issued. Although both recognisances and indictments are rich sources of occupational information, the latter are notably more problematic and their value in occupational studies is questionable.Footnote 69 John Styles has noted that legal convention in the late eighteenth century was such that occupational descriptors within indictments sometimes bore little resemblance to the actual occupation of victims. For him, ‘in contrast to indictments they [recognisances] employed the whole range of status and occupational designations in common use during the eighteenth century’.Footnote 70 Taking this lead, it is the recognisances that have been used in this study.
The systematic use of Quarter Session Records in occupational analysis is under-exploited, but it is not a new idea. For instance, K. McP. Buchanan utilised the Calendar of Quarter Sessions papers in his study of seventeenth-century industries in Worcestershire.Footnote 71 He considered the Sessions’ papers to provide a useful ‘cross-section of Worcestershire life at that period’, although ‘by no means as complete as the contemporary Muster Roll’. J. M. Beattie studied the occupations of prosecutors in property cases at the Surrey Quarter Sessions, 1743–1790.Footnote 72 W. A. B. Court has studied the rise of Midland Industries.Footnote 73 R. A. Churchley did likewise in his PhD study of rural communities in Warwickshire, although for his work the availability of useable records was patchy.Footnote 74 These studies all use the data to examine a particular period of time, but none have monitored systematic occupational change.
Other historians have considered whether court records are representative of the population. It has been proposed that some of those accused attempted to enhance their respectability and improve their chance of acquittal by describing themselves as a skilled worker, but Beattie has dismissed this view, citing the evidence gathered by Peter Linebaugh who correlated the biographies of convicts hanged at Tyburn with other evidence.Footnote 75 Peter King has shown that over 70 per cent of prosecutions for theft were against labourers, a group who represented around only 40 per cent of the Essex population.Footnote 76 Hence, while recognisances do not represent the elite, and their social coverage is broader than the other sources used in this work, they are by no means perfect in that some occupations may be more frequently represented than others.
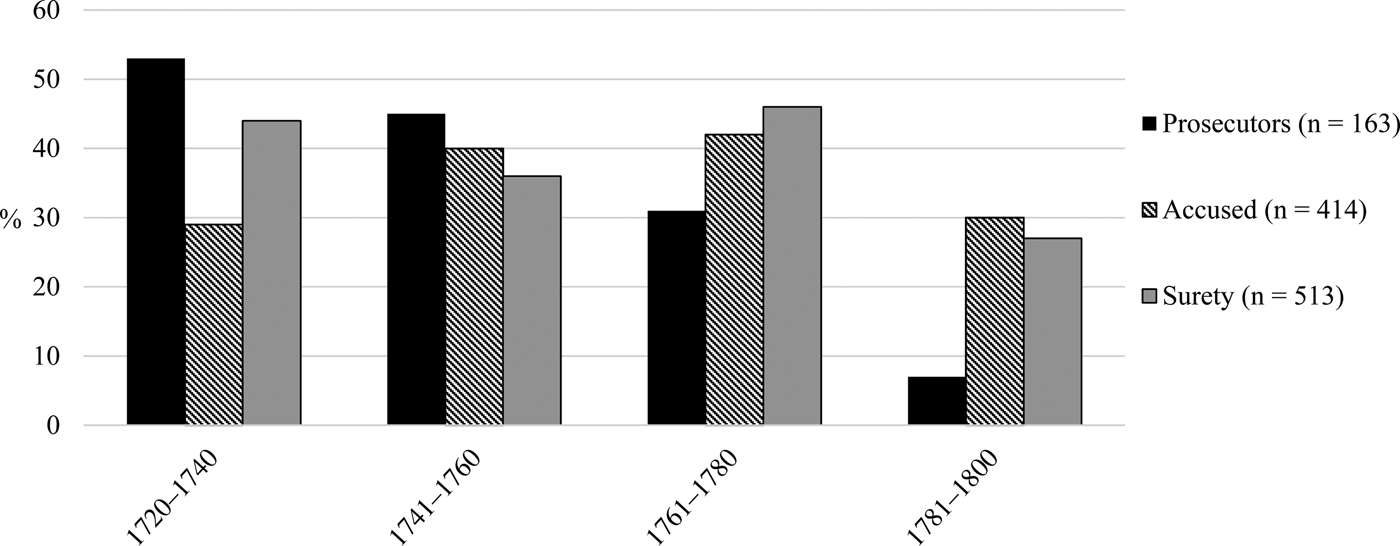
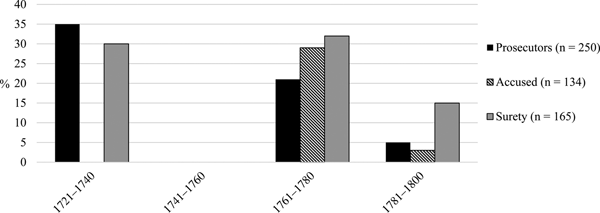
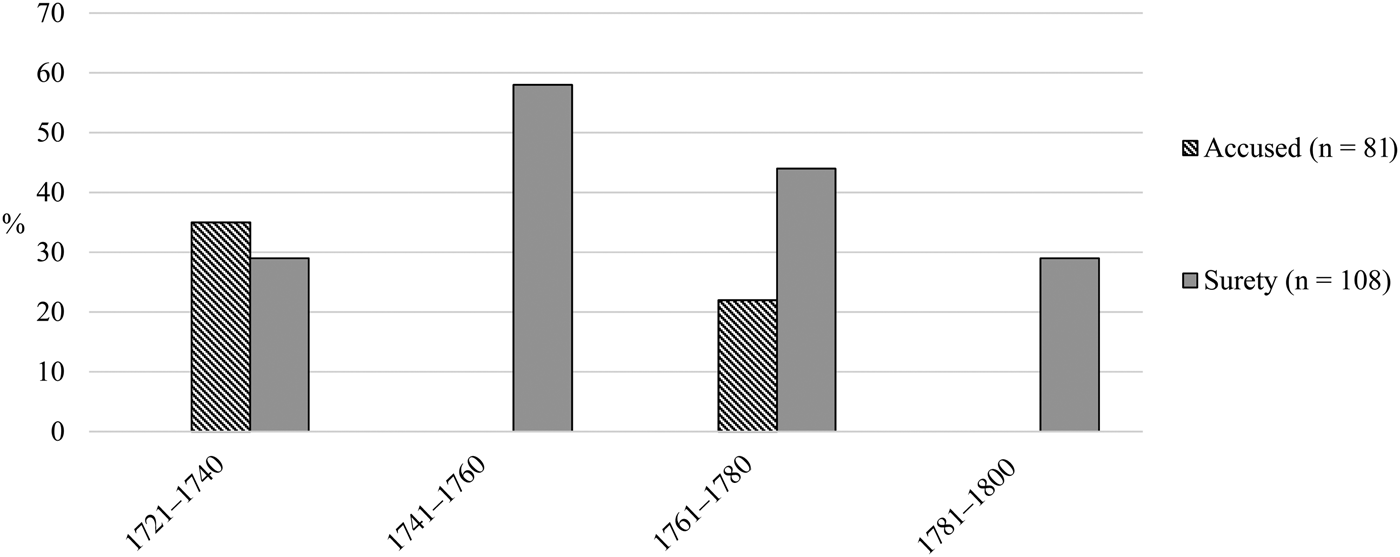
The recognisances give the name of the person involved, and very often, in the case of males, their occupation. Several thousand Norwich Quarter Sessions recognisance records survive, and, although patchy for some years, they offer relatively high frequency data over periods of the eighteenth century. It is these records that have been used in this study.Footnote 77 Many of these recognisances are for single women, their occupation very rarely recorded. Moreover, for married women, the occupation of the husband was normally provided. In total, 1,864 male recognisances, 1721–1820, have been studied. Of these, 58 per cent are for assault, 29 per cent for theft, and the remainder for unspecified misdemeanours. The temporal change in the percentage of recognisances involving worsted weavers in cases of assault, theft, and unspecified misdemeanour, are shown in Figures 6, 7, and 8. The percentage of assault and theft crimes prosecuted by worsted weavers declined steadily from 1721 onwards.Footnote 78 For those who were accused, all charges, there was a sharp decline at least as early as 1761. For worsted weavers who posted a surety for an unspecified misdemeanour, a decline is seen after 1741. Whereas the decline in worsted weaving observed from the analysis of wills, freemen, and voters could have been the consequence of industry consolidation, the change shown by the recognisances is considered unlikely to be caused by contraction alone. The latter show an industry in sharp decline by 1761–1780 and perhaps, although less conclusively, 20 years or so earlier.
Worsted weavers: recognisances, assault (1721–1800) (expressed as a percentage). Sources: See the text.

Worsted weavers: recognisances, theft (1721–1800) (expressed as a percentage). Note: Data for 1741–1760 and for the accused, 1721–1740, is not included because of the small number of recognisances for those years. Sources: See the text.

Worsted weavers: recognisances, unspecified misdemeanour (1721–1800) (percentages). Sources: See the text.

3.5. The size of the labour force in 1813
The 1813 baptism registers record the occupation of 1,107 Norwich fathers of whom 134 were weavers, 13 per cent of the population.Footnote 79 In 1811, 38,348 people lived in Norwich.Footnote 80 Using the Wrigley and Schofield estimate that 23 per cent of the population were males aged 20 years and over, it is calculated that there were 1,147 male weavers in Norwich at this time.Footnote 81 There are no data for the number of women and children who wove in Norwich at this time, but although there is some evidence to show that large numbers did so elsewhere in England, for example in the Lancashire cotton manufacture, the control exerted by the freemen of Norwich, particularly during the first half of the eighteenth century, would suggest that few did.Footnote 82 The number of male weavers, therefore, is considered a reasonable estimate of the actual size of the workforce. If each male weaver worked one loom, the number of working looms is clearly significantly less than that reported by the eighteenth- and early nineteenth-century commentators. Also, if each loom occupied the work of 6 people, then it is calculated that approximately seven thousand people worked in the Norwich industry. To put these numbers into perspective, similar calculations for Halifax and Bradford, the two main West Riding parishes, and for Manchester, the chief Lancashire cotton parish, show the presence of 5,124, 2,275, and 4,490 adult male weavers respectively. The textile industries in these three places combined was at least tenfold greater than that in Norwich.
3.6. The shift towards silk (1813–1851)
There are 2,079 entries for adult male weavers in the 1813–1820 baptism registers, of whom 90 per cent were not assigned to a particular yarn or cloth. It is not possible to determine the type of cloth that these men wove. Of the 199 assigned to a yarn, 2 per cent wove linen, 10 per cent wove cotton, 33 per cent wove worsted, but 55 per cent wove silk. Silk had long been used for the weft in high quality Norwich stuffs, but this is the first clear evidence of pure silk weaving. D. C. Coleman believed that by the mid-1820s the growth of the silk industry had compensated, but only in small part, to the loss of the worsted industry.Footnote 83 By this time, silk throwing mills had opened providing work for girls in particular.Footnote 84 The 1840 Reports of the Assistant Hand-Loom Weavers Commissioners records 106 Norwich women, 8 children and 90 men working directly with silk.Footnote 85 The 1851 census, the first to attempt to record national female employment in a reliable, systematic manner, confirms the trend away from worsted and into silk.Footnote 86 The Norwich census records 40,545 entries of males and females, of all ages, with an occupation. Of these, 5,333 were employed in textile manufacture, of whom 72 per cent worked with silk and only 15 per cent with worsted.
4. Discussion and concluding remarks
Occupations abstracted from wills indicate that worsted weaving moved out of rural Norfolk to consolidate in Norwich during the second half of the seventeenth century. Occupations taken from wills, freemen lists, poll books and Quarter Sessions show that Norwich weaving underwent significant change during the eighteenth century. There is an indication, although by no means conclusive, that decline set in during the first half of the century. There is firm evidence, however, to show that Norwich weaving was in significant decline, in both absolute and relative terms, after 1761–1780. By as early as 1813, there were tenfold as many adult male weavers in Halifax, Bradford, and Manchester as there were in Norwich. By this time, the bulk of the textile manufacture of England and Wales was located on or near a coal field in the north and the Norwich industry was of little national significance.Footnote 87 As Edwards and Corfield have previously noted, however, although the Norwich industry was significantly smaller in scale than it had been previously, it did nonetheless remain viable and of importance to the local economy. The new occupational evidence reported here lends support to Hoppit's work on bankruptcy but, is contrary to Clapham's opinion in that it shows that the introduction of mechanisation in northern counties did not cause the transference of the industry.
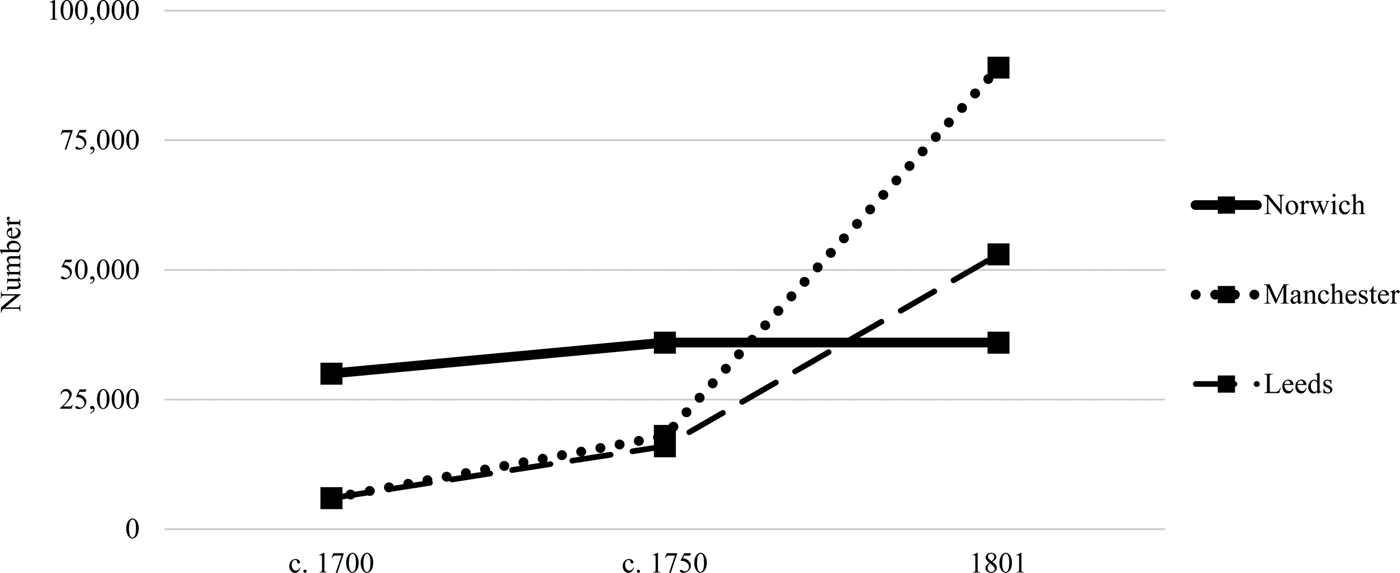
It can be no coincidence the Norwich worsted manufacture was in decline at the time when the population of the city was stagnant. Figure 9 compares the change in the population of Norwich over the eighteenth century with that of the two major textile towns of Manchester and Leeds. A divergence is particularly noticeable after 1750. The populations of Manchester and Leeds increased approximately fourfold and threefold respectively over the last 50 years of the century, whereas the population of Norwich languished. The number of people in Norwich decreased by 3 per cent, 1761–1791, and did not return to the 1761 level until 1811. Over the same period, the population of Norfolk, less Norwich, grew by one third and in Cambridgeshire, an agricultural county adjacent to Norfolk, by 60 per cent.Footnote 88 England was rapidly urbanising with a population increase of near 50 per cent, 1750–1800.Footnote 89 The economy and population of Norwich were clearly floundering while East Anglian counties, northern textile towns, and England, in general, were flourishing.
The populations of Norwich, Manchester and Leeds (c. 1700–1801). Source: See the text.

The timing of the onset of decline is extremely significant because it occurred before the mechanisation of either spinning or of weaving had yet to take significant hold. Although James Hargreaves's spinning jenny, patented in 1770, was adopted early, the first machines were hand powered, operated by women and children. The jenny was never adopted for worsted.Footnote 90 Samuel Crompton's mule, introduced in 1780, was initially used to spin worsted, but its use for this purpose was soon superseded by Arkwright's water-powered frame, which became the machine of choice.Footnote 91 S. D. Chapman has noted that although there were a number of worsted spinning mills in operation in the West Riding by 1800, there is no available hard evidence to suggest that any managed to produce yarn in commercial quantities.Footnote 92 Pat Hudson goes further and suggests that mechanical worsted spinning was not widespread until the 1820s.Footnote 93 Crompton's mule was quickly adopted as the machine of choice for cotton spinning during the 1780s, but it was not driven by steam power until the 1790s.Footnote 94 The power loom was first introduced, albeit slowly, into cotton weaving in the second decade of the nineteenth century. The Norwich industry had been in decline, therefore, for at least 30 years before steam powered mechanisation took hold. Mechanisation, and the provision of cheap coal to drive machinery, did not initiate the demise of the Norwich manufacture.
There is a need to examine other potential causal factors. Of these, the local availability and supply of wool and yarn can be dismissed because they had limited effect. Michael Turner's estimates of the wool production in England and Wales in 1800 show that 70 per cent of worsted wool was produced by sheep in Lincolnshire, Northamptonshire, and Leicestershire combined. Less than 3 per cent was produced by sheep in Yorkshire and less than 1 per cent in Norfolk. Neither the West Riding nor Norwich manufacturers, therefore, had any geographical advantage.Footnote 95 The relative cost of labour is potentially another important consideration. Gregory Clark believes that nominal winter day wages for farm workers in northern England remained below the national average throughout the eighteenth century, suggestive of competitive advantage.Footnote 96 E. H. Hunt found that agricultural labourers in Norfolk, 1767–1780, earned 8s per week, whereas the labourers in Lancashire and Yorkshire earned 6s 6d and 6s per week, respectively. By 1794–1795, the weekly wage for a labourer in Lancashire and the West Riding had risen to 10s 1d and 11s respectively, whereas in Norfolk the rate had hardly changed at 8s 1d.Footnote 97 By this time, any previous wage advantage in the north had been negated. Arthur Young data suggests that a wage advantage to textile manufacturers may have been lost sooner. For him, in 1771 both Norwich and West Riding stuff weavers were paid, on average, 7s per week.Footnote 98 On this evidence, any wage advantage that the northern manufacturers may have once held over those in Norwich was likely lost during the last quarter of eighteenth century, at the time when the Norwich industry was collapsing.
The nature and type of cloths woven elsewhere probably had a more pronounced impact, although perhaps not those worsteds produced in the West Riding. Mid-eighteenth-century West Riding marriage registers, notably for Halifax parish, indicate the presence of a thriving worsted industry, but this was a manufacture that had grown through the production of ‘middle and low quality cloths, like bays and shalloons, in competition with Essex and other smaller centres in the south and the Midlands’.Footnote 99 The Norwich manufacture did include products at the cheaper end, such as calamincoes, camlets and tammies, relatively easy to make, and it was very likely that these were lost to the West Riding early in the decline. The unique position held by Norwich, however, was at the higher end where they established their market and their reputation. It was not until the 1790s, long after the Norwich decline had begun, that the West Riding manufacturers produced fine worsted fabrics.Footnote 100 The West Riding weavers, therefore, offered little direct competitive threat to the heart of the Norwich business until that time.
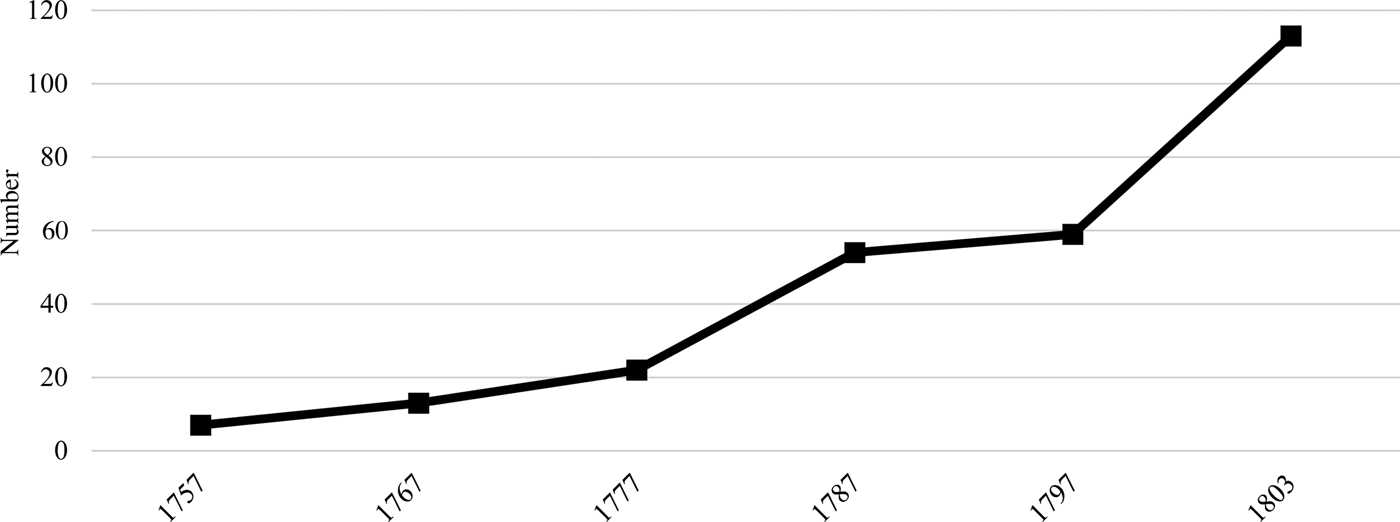
A bigger threat likely came from Lancashire fustians and cottons. The Norwich manufacturers had been wary of competition from all-cotton cloths from the early eighteenth century. The bulk of the Norwich output at this time was sold in the home market, but this trade was impacted by imported cottons.Footnote 101 In consequence, a protectionist measure was introduced through an Act of Parliament in 1700, which prohibited the importation of Indian silks and printed calicos.Footnote 102 Unwittingly, the effect of the Act was the opposite to that desired in that it resulted in the rise of calico printing, in direct competition to Norwich stuffs. Further protection was sought by a 1721 Act that banned calico printing for home consumption. Lancashire manufacturers overcame the prohibition by switching their production away from all-cotton fabrics and over to printed fustians, woven with a linen warp and a cotton weft.Footnote 103 James noted that ‘ever since the passing of the Calico Act in 1721, a struggle has been maintained between Manchester and Norwich, and henceforward it continued for many years’.Footnote 104 The rise of the Lancashire industry from this time has been demonstrated by Hoppit's bankruptcy study.Footnote 105 The demand for Norwich stuffs for home consumption fell away rapidly through competition from these printed fustians, forcing the manufacturers to look to overseas markets. The competitive threat from cottons increased when the manufacture of all-cotton cloths in England was legalised and the ban on calico printing was lifted in 1774.Footnote 106 The Manchester cotton manufacture responded quickly. An analysis of the occupations of bridegrooms abstracted from the church of Manchester, St Mary, St Denys and St George shows the rapid increase in the number of bridegrooms who were either printers or dyers (Figure 10).Footnote 107 It is inconceivable that the rise in cotton printing did not pose a significant, adverse commercial threat to Norwich. At a time when the Norwich industry was struggling, the quantity of raw cotton consumed in England, as measured as retained exports, rose tenfold, 1772–1800, a strong indicative of the difference in fortunes of the two cloth industries at this time.Footnote 108 The threat from Lancashire ate away at the Norwich trade and it is likely that it was instrumental in its demise. It was this competition from Lancashire, combined with the loss of trade through war, that were the main factors that caused the Norwich industry to collapse.
Printers and dyers: Manchester parish bridegrooms (1757–1803) (expressed as the actual number). Source: See the text.

Acknowledgements
The author would like to thank Professor E. A. Wrigley, Dr Leigh Shaw-Taylor and Professor Richard Smith, all of the Cambridge Group for the History of Population and Social Structure, University of Cambridge, Professor Roger Sugden, University of British Columbia, and two unknown referees for their comments and suggestions to help shape and improve this article.