1. Introduction
Water is an essential resource and commodity for humankind. Securing the full benefit of water for a household requires that it has access to (clean) tap water within the residence. Considering the cities in Guatemala and El Salvador dealt with in this paper, tap water coverage is far from universal. A main purpose of this paper is to derive measures of the value of a tap water connection to households. A documentation of such values is of interest for several reasons. First, it may reveal the role of tap water access in alleviating urban poverty, as gaining tap water access contributes to increased real incomes. Equally important from a policy perspective, extending tap water service to additional households typically requires public investments whose returns need to be documented. This makes it important to compare the costs and benefits of connecting additional households to the piped water system. If benefits exceed provision costs, the connections ought to be added from a pure efficiency standpoint. Thus distribution and allocation factors are both important for motivating an analysis of the type undertaken here.
Estimating or calculating the value of tap water access can be done on the basis of either stated preference (SP) or revealed preference (RP) data. A typical SP approach would apply contingent valuation (CV), where a sample of unconnected households would be surveyed about their maximum willingness to pay for a water connection. Among possible RP methods, first the ‘hedonic price’ (HP) method implies that the value of water connections is inferred from differences in property values according to current connection status. Secondly, the integral under a (known) water demand function of a given household provides a measure of value (or consumer surplus) derived from that household's current water consumption, something that can be exploited for evaluation purposes.
SP approaches have become popular and widely applied, but mostly for ‘intangibles’ such as environmental, health, and aesthetic goods. Water is a more standard marketable commodity lending itself more readily to RP valuation. We will here focus on RP analysis, in applying the HP approach indicated above. A traditional view among economists is that RP data are generally superior to SP data, as only the former are based on actual market behavior. This should however not be taken to indicate that applying the HP method is unproblematic in our case, since several strong assumptions lie behind it, as discussed further below.
Our basic data set contains survey data for more than 11,500 households in 17 cities in Central America and Venezuela. The data have been collected by the consulting firm ESA Consultores in Tegucigalpa, Honduras. Similar methodologies have been used for water demand surveys undertaken in six countries: Honduras (1995), Nicaragua (1996), El Salvador (1996), Venezuela (1996–1997), Guatemala (1997), and Panama (1998). For each of the 17 cities, the sampling procedure used was a standard stratified random sampling procedure, based on cartographic resources provided by the national statistical agency. Stratification reflected the characteristics of water supply in the neighbourhood. It permits meaningful hedonic price relationships to be derived from seven of the cities in this data set. A criterion for selecting a city for our analysis is that the available data from this city contain substantial fractions of both tap and non-tap households. The surveys covered individual sample sizes from about 500 to 1,500 households, chosen at random among the entire populations in three El Salvador cities, and within marginal ‘barrios’ (poor unincorporated neighbourhoods) in four Guatemalan cities. For further description and discussion of the data, see Strand and Walker (Reference Strand and Walker2003, Reference Strand and Walker2005).
Overall, our results indicate that connected households enjoy substantial welfare gains from their connections, given current water prices and service levels, both absolutely and as fractions of their household incomes. Welfare gains are generally larger in El Salvador than in Guatemala. In the three cities in El Salvador, average gains from water connections are found to constitute between 1 per cent and 5 per cent of currently unconnected households’ incomes; equivalent figures for Guatemala are 1 per cent for three cities, and 2–3 per cent for the fourth (Mixco). Since unconnected households on average have far lower incomes than connected ones, providing tap water access to more households also reduces overall income inequalities. One reason for this is clearly that many unconnected households today pay far higher water prices than connected households do. But another, and perhaps more important, reason is that tap water as such provides a high level of welfare to households, due to the convenience of having water in one's home versus needing to bring it in from the outside, and as tap water access facilitates a variety of water applications (such as use in washing machines and showers).
This article adds to the still small empirical literature on valuation of access to water in developing countries. An overview of valuation of infrastructure (water, sanitation, electricity) using hedonic price models in developing countries can be found in Komives (Reference Komives2003). In sum, estimates of the market premia for infrastructure in general and water services in particular appear to be scarce and mixed. North and Griffin (Reference North and Griffin1993) estimate a random-bidding model on 1,903 households in rural Philippines and show that in-house tap water is valued at US$2.25 per month (which corresponds to 44 per cent of mean monthly rent or 1.7 per cent of mean monthly household income). Daniere (Reference Daniere1994), using data from Cairo and Manila, estimates that piped water is valued at US$30.72 per month (which corresponds to 102 per cent of mean monthly rent or 18 per cent of mean monthly household income). Crane et al. (Reference Crane, Daniere and Harwood1997) estimate a hedonic price model using data on low-income households in Bangkok and Jakarta. The value of a piped water connection in Bangkok is estimated at US$231 for owners to just over US$200 for squatters. In Jakarta piped water was not found to add a significant premium to the house value. Jiwanji (Reference Jiwanji2000), in a meta analysis of 15 CV studies on willingness to pay for piped, pump, and well water, found values of piped water in the range from 0.2 per cent to 10.7 per cent of income. Using data from Panama City (Panama) and Quito and Guayaquil (Ecuador), Komives (Reference Komives2003) estimates the premium for an in-house tap (excluding the value of access) at between 3 and 15 per cent of average monthly household consumption across the three cities. Yard taps are worth less: 0.5–2.5 per cent of consumption in Quito and Panama City, and around 5 per cent in Guayaquil. Yusuf and Koundouri (Reference Yusuf and Koundouri2005), using data on the Indonesian housing market, estimate the willingness to pay for their dwelling to have access to piped water, pump water, and well water, to be 3.6 per cent, 1.4 per cent, and 0.2 per cent of monthly rent, respectively. The perhaps most closely related study to ours is Estache et al. (Reference Estache, Foster and Wodon2002), who value water services in Honduras from hedonic price studies of differential house rents. The analytical basis for that study however seems weaker than that for our study; in particular their house rent data are most likely quite imperfect due to widespread rent control. Their assessed monthly value of a water connection (almost certainly non-metered) is in the range of 30–40 Lempiras per household, equivalent to about USD8–10 (given the official exchange rate of 13 Lempiras per USD for 1997, adjusted by a Purchasing Power Parity (PPP) factor of 3.16). The benchmark for comparison with that study should here probably be our results for Guatemala City and Villa Nueva (both in Guatemala), where our corresponding figures are found to lie in the range of USD10–20.
2. Some aspects of the household water situation in Central American cities
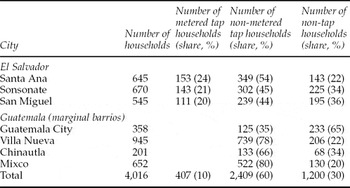
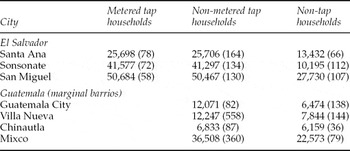
In this section we look briefly at some main aspects of the water situation in the three cities in El Salvador (Santa Ana, Sonsonate, and San Miguel) and four cities in Guatemala (Guatemala City, Villa Nueva, Chinautla, and Mixco) included in our analysis below. Table 1 shows distributions of households by mode of water service in our sample.
Distributions of households by type of water supply

The samples in El Salvador (Guatemala) were collected in citywide (marginal barrios) and random household interview surveys, conducted in 1996–1997, where sampled households were asked questions related to water and sanitation (with surveys conducted in essentially the same way in all the cities). We distinguish between three main groups of households, namely: (1) metered tap-connected households, (2) non-metered tap households, and (3) unconnected (or non-tap) households. In each of the seven cities, a substantial fraction of households (ranging from 20 per cent in Mixco to 65 per cent in Guatemala City) are not tap-connected. Among sampled tap-connected households, less than half are metered in El Salvador, and none in Guatemala.
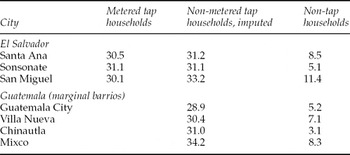
Table 2 shows average sampled household water consumption, by city. For metered tap households, these are measured directly. For non-metered tap households, individual figures are not directly observed; however, total city-wide consumption is observed, and individual household figures are imputed on the basis of these observations in combination with estimated water demand functions for non-metered tap households (where, typically, all variables except water demand are observed also for non-metered households). Non-tap households were in the survey asked to state their water consumption, payment, and hauling costs, for different categories of water, over the last month prior to the survey; see Strand and Walker (Reference Strand and Walker2003, Reference Strand and Walker2005) for greater detail.
Average household water consumption (in cubic meters per month)

The data reveal enormous differences in average water consumption levels, between tap and non-tap households. Average monthly tap consumption is 30–35 m3 in most cases, similar across cities at least for metered households where data are most reliable. By contrast, average non-tap consumption is only 5–8 m3 per month, less than one fourth of average tap consumption, and much more variable across cities, but in no case greater than one third of the average tap water consumption level (with the highest figures for San Miguel). The differences between metered and non-metered tap households are small with slightly higher consumption levels in the latter group. These small differences in average consumption levels are however deceptive. Non-metered households face a zero marginal water price, and have more wasteful water consumption than metered households, which increases their water consumption. On the other hand, they tend to have characteristics correlated with low water consumption, such as relatively small incomes and residences, and face more frequent rationing, factors that tend to make their water consumption lower than otherwise.
Water consumption is lower among non-tap households than tap households, for at least five different reasons. First, non-tap water prices are higher for most households, at least for marginal water consumption (some households have some ‘free’ water through own wells, but most often pay dearly for additional supply). Secondly, water access itself is less convenient for those without tap, who in most cases must haul their water to the house. Thirdly, without tap, many potential uses of water are made less convenient (or sometimes even ruled out), such as using washers or even perhaps taking showers. Fourthly, non-tap households tend to have characteristics (e. g. low income) correlated with low water consumption. Other characteristics of non-tap households (such as large family sizes and living in highly polluted neighbourhoods) however oppose these effects, implying that the fourth argument is unimportant overall. Fifthly, water quality is often higher and better controlled for tap water than for non-tap water (see Strand and Walker, Reference Strand and Walker2005, for an estimation of water demand functions for tap and non-tap households using data from the same survey).
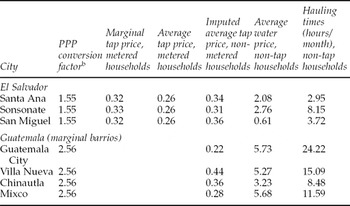
Table 3 shows water prices (in 2001 USD, PPP converted) paid by metered tap and non-tap households.Footnote 1 Most strikingly, the average ratio of purchase prices for non-tap to tap water is almost 10, and is nowhere less than 6 (except in San Miguel, where many households rely on private wells, and the average ratio is only 1.7). The right-hand column of table 3 shows times spent on water hauling by non-tap households. The average household hauling time is about 11 hours per month, varying widely (3–24 hours) across cities. These figures indicate considerable inconvenience in obtaining water for non-tap households.
Pecuniary and time costs of water service, across citiesa

Notes: aPecuniary costs in USD per m3 at PPP rates.
bPurchasing Power Parity (PPP).
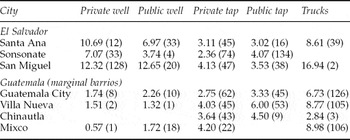
Non-tap household access to the different water sources (private and public wells, private and public taps, trucks) varies across cities. Table 4 shows average water consumption by source for non-connected households.
Average water consumption by type of source for non-tap householdsa, b

Notes: aAverage household water consumption is measured in cubic meters per month.
bNumber of households is shown in parentheses.
Consumption of households purchasing water from trucks is higher on average than consumption of households getting water from other sources, most likely since time costs of water hauling are lower for truck water than for water from other public wells or taps. In cities in El Salvador average consumption from private wells is higher, as more households own private wells. In the Guatemala cities, households in marginal barrios do not have private wells, and water has to be brought from someone else's private tap or from public sources, at substantial pecuniary and hauling costs. This suggests that private wells or access to particular water sources may be valued highly by non-tap households. Even more, a tap connection is likely to be highly valued due both to the higher pecuniary and hauling costs associated with non-tap water, and to the range of water uses made possible by tap connections.
3. Deriving capitalized values of water services from home price data
Home prices are likely to embed values of amenities supplied at or near the home. This corresponds to the theory of hedonic prices presented by Rosen (Reference Rosen1974), with application to the housing market by Palmquist (Reference Palmquist, Braden and Kolstad1991, Reference Palmquist and Mäler2000), Freeman (Reference Freeman1993), and Taylor (Reference Taylor, Champ, Boyle and Brown2003), and recent applications by Lake et al. (Reference Lake, Lovett, Bateman and Langford1998), Boyle et al. (Reference Boyle, Poor and Taylor1999), Bateman et al. (Reference Bateman, Day, Lake and Lovett2000), Day (Reference Day2001), and Strand and Vågnes (Reference Strand and Vågnes2001). Water service quality is one important such amenity. In principle, when a house is purchased, the buyer also purchases the net (expected present) value of water services (and other relevant services) provided at the house, at all future dates. Consider two houses differing only in the value of water services provided, in a perfectly competitive housing market, where all households have the same demand for water services. Different prices of the two houses will then perfectly reflect differences in present values of water services provided. In practice the issue is more complicated, for several reasons: housing markets are often not perfectly competitive; household preferences differ in other (systematic and non-systematic) ways; and water access may be correlated with other, often unobserved, valuable house attributes. Different household preferences also imply that households who value water services highly, have already chosen houses with access to such services, leaving households with lower values in houses without service. Correlation between attributes may imply that a high house price in part reflects high quality of other services than water, leaving water services to explain only part of the house price difference. House prices may also embed expectations about future changes in amenity values (e. g., when an improved water service is expected to be provided at some future date, this should increase the house price for a given current service). The two first of these factors imply that house price differences tend to overestimate the value of water services, while the latter factor implies the opposite.
Our data set contains about 2,400 households in the seven cities for which individual residence values are recorded (assessed by respondents at the time of interview), together with information on square-meter sizes of residential units and lots and types of ownership. In table 5 average home values for metered, non-metered tap, and non-connected households are reported for each city in the sample.
Average home values, by water service mode and city in the samplea, b

Notes: aHome values are measured in USD, PPP converted.
bNumber of households is shown in parentheses.
Home values vary considerably by city and category. We must again stress that the figures are not fully comparable between the two countries as the survey was conducted in marginal barrios in the Guatemalan cities, and in the entire El Salvador cities. Average house prices are in all cities far higher for houses with tap water access than for those without (apart from Chinautla, Guatemala, where the difference is small). For all surveyed households in aggregate, house prices average about USD13,000 (PPP adjusted) for houses with no water connection, and about USD25,000 and 38,000 for homes with non-metered and metered tap connections, respectively, generally higher in the El Salvador sample than in the Guatemala sample. However, there seems to be little difference in house prices among tap households by whether they do or do not have meters; this is evident from the data for the El Salvador cities, which are the only cities where metered and non-metered water services coexist. We also find that most metered tap households, and somewhat fewer non-metered tap households, live in residential units with titled ownership, while most of the rest live in units with untitled ownership. By contrast, less than a third of non-tap households have ownership title.Footnote 2
4. Model specification and estimation results
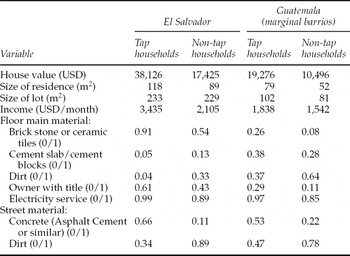
Hedonic regressions are used to derive the value of tap water connections, relative to access to specific water sources for non-connected households. Because of different sampling principles (city-wide in El Salvador, and marginal barrios only in Guatemala), we carry out two separate sets of estimations, one for each country. We estimate log-linear regressions where house prices are explained by water service variables, in addition to several other observed variables. The main objective is to identify the value of alternative available sources, using dummy variables taking the value of one if and only if the household uses the particular source in question. The number of households combining more than one non-tap source is quite small (less than 10 per cent in each country), implying that water in most cases comes primarily from one source. In line with this, and without making a large error, we assume in the following that non-tap households use only one non-tap source, namely the most important one used during the month of survey.Footnote 3 To control for other house characteristics, we include residence and lot size in square meters and floor main material. Variables in the relationships that serve to control for overall neighbourhood quality, are composite material used in the street, and availability of electricity and telephone services. We also include dummy variables to correct for ownership title to the property.Footnote 4Table 6 presents some descriptive statistics for these variables, for tap and non-tap households in the two countries.
Descriptive statistics for tap and non-tap households, by country

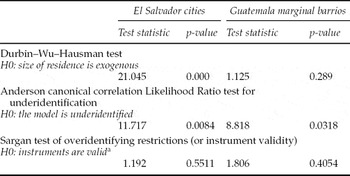
The hedonic house price model may suffer from endogeneity for the main reason that households may choose simultaneously the price of housing and the quantity of an attribute, making the corresponding explanatory variable endogenous through its correlation with the error term (Epple, Reference Epple1987); for example, households may simultaneously choose the price of the house and its living space. Endogeneity may also come from measurement errors in some variables. The usual approach to overcome endogeneity bias is to consider instrumental variables techniques. Household characteristics have been commonly used as instruments in this context (Crane et al., Reference Crane, Daniere and Harwood1997). For each country, we test for endogeneity of the size of residence (a measure for living space in our model) using as instruments household monthly income, squared household monthly income, and a variable indicating whether the household reads and writes (0/1 variable). These instruments are excluded from the price equation and thus play the role of identifying instruments for the impact of the size of residence on house value. We test for endogeneity of the size of residence in the hedonic price function using a Durbin–Wu–Hausman test. Under the null of exogeneity, the Durbin–Wu–Hausman test-statistic follows a chi-squared with l degrees of freedom, l being the number of endogenous regressors (Davidson and MacKinnon, Reference Davidson and MacKinnon1993). The Anderson canonical correlations likelihood ratio test for underidentification is also presented. A rejection of the null hypothesis indicates that the model is identified and that the instruments are relevant (see Hall et al., Reference Hall, Rudebusch and Wilcox1996). Finally, we test that the instruments are valid, i.e. uncorrelated with the error term, and that the excluded instruments are correctly excluded from the estimated equations, using the Sargan test of overidentifying restrictions. Under the null, the test statistic is distributed as chi-squared in the number of overidentifying restrictions.
Finally, we test for poolability of the data across the cities (i.e., Guatemala City, Villa Nueva, Chinautla, and Mixco in Guatemala; Santa Ana, Sonsonate, and San Miguel in El Salvador). For each country, we adopt the following strategy: we estimate the hedonic price model allowing for city-specific coefficients for all regressors and we then test, separately for each regressor, the null that city-specific parameters are equal. If the null is rejected, then we specify city-specific coefficients for this regressor. If the null is not rejected, then we estimate a unique parameter for the corresponding regressor; this parameter being the same for all cities in the sample.
We describe, in turn, the model specification and estimation of the hedonic house price model in El Salvador and in Guatemala.
4.1. The hedonic house price model in El Salvador
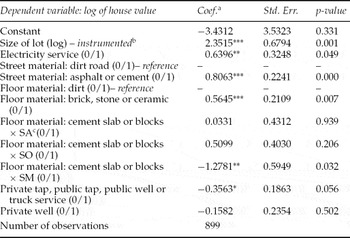
Surveyed households in El Salvador get water from either a private connection at home, a private well, a public well, someone else's private tap, a public tap or through truck delivery. Because the number of surveyed households getting water from some of these sources may be quite small (see table 4), we consider only three categories of water sources, namely: (a) a private tap connection at home, (b) a private well, and (c) other types of water access (someone else's private tap, public tap, public well, or truck services). For El Salvador, the property relationship as well as the access to a telephone service were not found significant so these variables have been removed from the hedonic house price equation.
Table 7 shows the outcome of the three tests discussed above. We do find evidence of endogeneity of the size of residence (the null of exogeneity is rejected based on the Durbin–Wu–Hausman test), which calls for the use of instrumental variable techniques since OLS would then provide inconsistent estimates of the parameters in the hedonic price function. The Anderson canonical correlations likelihood ratio test and the Sargan test of overidentifying restrictions indicate that the model is identified and that the instruments are valid, respectively. Additional tests also proved endogeneity of the size of lot. Unfortunately it was impossible to find a set of valid instruments to control for endogeneity of both size of residence and size of lot simultaneously. The best model (in terms of parameter significance, identification conditions, and instrument validity) was obtained when considering only size of lot in the hedonic model (size of residence has been omitted), the latter variable being instrumented by household monthly income, income squared, and the dummy variable that is set equal to 1 if the household reads and writes. When testing for poolability of the data from the three cities, we reject the null (at the 5 per cent level) that parameters are the same across the three cities for one regressor only: floor material (cement).
Tests of endogeneity, model identification and instrument validity

Note: aInstruments are household monthly income, squared household monthly income and a variable indicating whether the household reads and writes (0/1 variable).
Table 8 shows results for the relationship between house price, water access variables, and background variables. The estimation is done using the entire sample of connected and non-connected households (a total of 899 observations), with connected households as the reference group. We only report log-linear relationships. Linear and semi-log relationships were also fitted, but give inferior fits. The coefficients related to the dummy variables for non-tap water supply (corrected for the background variables) here indicate the relative reduction in house price for households with such water access, when compared to house prices for connected households. All non-tap source indicators are found to be negative (but not significant for the case of private well), implying that non-tap water is always less attractive than a tap water connection, everything else equal. This is of course as expected. A house in El Salvador without connection to the water network, but with access to someone else's private tap, public tap, public well or truck service, is priced 30 per cent lower (1-exp (−0.3555) = 0.30) than a house with a private connection, everything else equal. Lack of tap-water service does not reduce house values significantly when the household instead has access to private well (something that is observed only for the El Salvador sample). This is not surprising, for two reasons: first, own well water is typically costless and may need little hauling; and, secondly, from table 4, monthly water consumption per household is quite high for these households, in particular in San Miguel where private wells are the dominant kind of non-tap supply. Overall water consumption in these households is thus not significantly held back by lack of tap-water access. Table 8 also shows us the effects on house values of the other variables included in the regressions, here under house characteristics and overall neighbourhood quality effects. Most of these variables are significant, and have the expected signs.
IV estimation results for the hedonic price relationship El Salvador sample

Notes: a ***, **, * indicate significance at 1, 5 and 10% respectively.
bInstruments are household monthly income, income squared and a dummy variable which is equal to 1 if the household is able to read and write, and 0 otherwise.
cSA, SO, SM are for Santa Ana, Sonsonate and San Miguel respectively.
4.2. The hedonic house price model in Guatemala
For Guatemala, we consider three types of water sources, namely: (a) a private tap connection at home, (b) the use of truck service, and (c) other types of water access (public tap, public well, or someone else's private tap). As far as the property title is concerned, we consider three categories: (a) ownership with title, (b) ownership without title, and (c) other types of property relationship, i.e. squatters or people living on non-legalized land.
For the Guatemala sample, the Durbin–Wu–Hausman test indicates that we cannot reject the null of exogeneity of the size of residence (see table 7). The latter test is valid as long as the model is identified and the instruments are valid, which is confirmed by the outcome of the Anderson canonical correlations likelihood ratio test and the Sargan test of overidentifying restrictions, respectively. Hence, for this sample, OLS will provide consistent estimates of the parameters in the hedonic house price model.Footnote 5
We then test for poolability of the data across the four cities. We reject the null (at the 5 per cent level) that parameters are the same across the four cities for the following regressors: the intercept, size of lot, electricity service, and street material. However, when estimating the model allowing for city-specific coefficients for the electricity service variable, only one of the four city-specific coefficients was found significant. For that reason (and because the coefficient measuring the market premium of electricity service is not the main parameter of interest), we chose to estimate a unique coefficient for the electricity variable (which is, in this case, significant). This coefficient can be interpreted as the average market premium (over the four cities) for the electricity service.
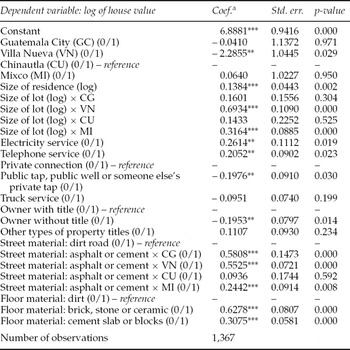
Estimation results by OLS, based on a sample of 1367 households, are shown in table 9. For our Guatemala households, relying on public tap, public well, or someone else's private tap as the main non-tap supply reduces house value by 18 per cent on average, relative to connected houses. This effect is highly significant. The result, found in both countries, that public non-tap sources are associated with low house values is intuitively reasonable, from the discussion above, in particular since hauling costs are large for such households. On this sample, the access to truck services is valued negatively (relative to a tap connection in the house) but the associated coefficient is found significant at the 20 per cent level only.
OLS estimation results for the hedonic price relationship Guatemala sample (marginal barrios)

Note: a ***, **, * indicate significance at 1, 5 and 10% respectively.
Finally, on the sample from Guatemala, we find that access to electricity and telephone services has a slightly higher valuation than access to a tap connection in the house. Indeed, access to electricity and telephone services is found to increase house value by 30 per cent and 23 per cent, respectively.
A common objection to this type of hedonic analysis is that other, unobservable, variables may be correlated with both house prices and tap water access, something that will tend to bias the estimated results. In particular, houses located in non-desirable neighbourhoods of a given city tend to have less desirable types of water access as well; and not all aspects of a ‘non-desirable’ neighbourhood may be picked up by the explanatory variables we have been able to include. In such cases, there will be a tendency for the effect of water access on house prices to be exaggerated or overestimated in our estimations. It is in this context of some interest to compare the results from the El Salvador and the Guatemala samples. For the Guatemala data, the entire sample of households is from marginal ‘barrios’, consisting generally of non-incorporated, and the least desirable, sections of the respective cities. In the El Salvador cities, by contrast, the samples are from the entire cities. This may indicate that the estimations conducted on the Guatemalan data are more trustworthy, as there may be less ‘noise’ in the part of the relations attempting to pick up the water variables.
4.3. Main results from hedonic estimations
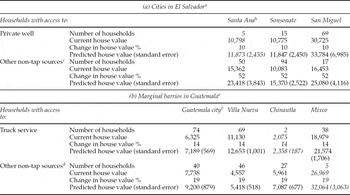
In tables 10(a)–(b), the first line in each block shows average home prices, with table 10(a) showing results for cities in El Salvador and table 10(b) for Guatemala. The next line in the block shows the calculated relative house price increase when a previously unconnected house relying on a particular non-tap water source, obtains a tap water connection. These calculations are based on the estimated dummy coefficient of this particular non-tap source.Footnote 6 The final line in the block is derived by simply taking the average house prices in the first row, and adding the percentage increase in the second row. We then arrive at ‘predicted values’ of houses that previously relied on a particular water source, but are now connected to the water system: these values we call ‘predicted house values’. Such values can be viewed as realized in the (hypothetical) event that the respective households were connected to the tap water system, on the basis of our estimated hedonic function. These calculations are made on the sub-sample of households that are either owners or squatters, thus excluding houses being on a non-legalized land.Footnote 7 Figures in italics indicate that averages have been computed using 5 or fewer observations. Standard errors are also reported. They have been computed using the delta method, see Kmenta (Reference Kmenta1986) or Greene (Reference Greene1997: 278).Footnote 8
Imputed home prices for non-tap households obtaining a connection to the tap water system

Notes: aCapitalized values in USD, PPP adjusted.
bFigures in italics indicate that averages have been computed from 5 or less observations.
cIncludes someone else's private tap, public tap, public well, and truck services.
dIncludes someone else's private tap, public tap and public well.
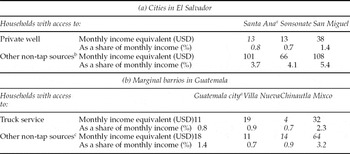
We also calculate the corresponding average monthly gain from a water connection, by transforming the figures in tables 10(a)–(b) into monthly income equivalents for the respective households. In tables 11(a)–(b) we present two sets of such calculations (with same remark as for tables 10(a)–(b) applying, regarding figures in italics).
Average estimated effects on home prices of obtaining a connection to the tap water system, for previously non-connected households

Notes: aFigures in italics indicate that averages have been computed from 5 or less observations.
bIncludes someone else's private tap, public tap, public well, and truck services.
cIncludes someone else's private tap, public tap and public well.
The first are direct monthly income gain estimates, based on an assumed discount rate of 15 per cent, which may seem high but is consistent with local private lending rates. On this basis we calculate the corresponding monthly values as 1/12 of respective annualized values. Willingness to pay for a tap connection calculated in this way for cities in El Salvador, provided in table 11(a), varies from a low of USD13 for private well users in Santa Ana and Sonsonate, to a high of USD108 for users of other non-tap sources in San Miguel (all PPP adjusted). These values represent fractions of total household income varying from a low of 0.7 per cent (for private well users in Sonsonate) to a high of 5.4 per cent (for users of other non-tap sources in San Miguel).
In the Guatemalan cities, with figures given in table 11(b), equivalent numbers are substantially lower, reflecting both the lower relative impacts on house prices, and lower general house values. An exception from this pattern is Mixco, where figures are comparable to those in El Salvador. Apart from Mixco, income equivalents in Guatemalan cities vary from a low of only USD4 per month for truck water users in Chinautla (representing 0.7 per cent of average household income), to a high of USD19 for truck service users in Villa Nueva (representing 0.9 per cent of household income). In Mixco where gains are greater, the largest gains from a tap water connection are for households with access to other non-tap sources, which are estimated to gain USD64 per month on the average, leading to a relative household income increase by 3.2 per cent.Footnote 9
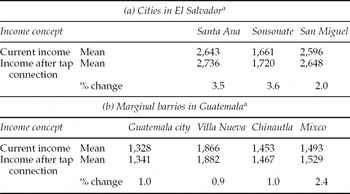
The results derived above can also be used to find the impact of complete tap water coverage on overall average incomes among the population of currently unconnected households. We present in tables 12(a)–12(b) the income effects of providing tap connection to all currently unconnected households (using previous assumptions about how changes in home prices can be translated into income effects), for the cities in El Salvador and Guatemala respectively.
Average estimated effects on real income of obtaining a connection to the tap water system, for previously non-connected households

Note: aIncome values in USD, PPP adjusted.
Although this is not directly displayed in the tables, the provision of full tap coverage would shift the income distribution of unconnected households to the right. The reason for this is that unconnected households generally belong to the lowest-income groups in the cities in question. The tables present results on how average incomes of the currently unconnected would move in each of the cities. In the El Salvador cities, reported in table 12(a), average incomes would increase by between 2.0 per cent (San Miguel) and 3.6 per cent (Sonsonate). In Guatemala, providing full tap coverage increases the incomes of unconnected households only moderately (by 0.9–1.0 per cent), except in Mixco where the average increase is 2.4 per cent, similar to that in El Salvador.
To these results one should clearly add the reservation made above, that there may be upward biases in the estimated water access coefficients, in particular for the El Salvador cities, and an equivalent upward bias in the estimated house value effects. We have no clear indication of the magnitude of any possible bias. Our estimates may also have implications for efficient resource allocation in the household water sector. Provision of one additional connection is worthwhile from a social efficiency point of view if willingness to pay for the connection exceeds the social costs of the connection. These costs consist of the costs of the water provision per household, and the costs of the connection itself. In the Central American cities in question, long-run marginal cost of additional water provision is close to USD0.50 (current) per m3, translated to USD1–1.50 in PPP terms. At current consumption rates for tap households in the region (around 25 m3 per month higher than for non-tap households), provision costs are then approximately USD25–40 (PPP) per month per household. To this number one must add connection costs, which may vary widely. For connections to be socially beneficial, these costs must be more than outweighed by households’ willingness to pay, which is the sum of the WTP figures (for access to a tap water connection) derived here, plus the water bill payments (including the value of connection costs) made by connected households. No such calculations are made here; it however seems very plausible that benefits of additional connections exceed costs in many, perhaps most, cases, in particular in El Salvador.
5. Concluding remarks
We have in this paper attempted to derive economic values of tap water services, and the role of such services in affecting real income levels, based on an extensive data set for households in three cities in El Salvador, and marginal ‘barrios’ in four cities in Guatemala. Substantial fractions of the households surveyed were without tap service at the time of the survey; indeed, a criterion for selecting a city for our analysis is that the available data from this city contain substantial fractions of both tap and non-tap households. In our data we observe wide disparities in average household water consumption and water price levels, between those households that enjoy tap water access and those that do not. We estimate average consumer surplus from current tap water access for each of the cities, based on econometric ‘hedonic price’ analysis of housing prices and their relationship with water access. The value of housing property is in most cases found to be significantly affected by whether or not the house is connected to the water system.
When correcting for other available variables, a tap water connection is on average found to add 10–52 per cent to the sales value of the house in El Salvador (everything else equal), depending on the non-tap source, and a lower range, 14–19 per cent, in the Guatemalan marginal barrios. Assuming an annual discount rate of 15 per cent, the average addition to a household's welfare from having a tap water connection is mostly in the range USD10–110 per month (PPP adjusted) in the cities in El Salvador (and highest in San Miguel); and in a lower range, mostly USD5–20 per month, in the marginal barrios in Guatemala City, Villa Nueva, and Chinautla, and USD30–65 in Mixco.
Letting the income concept include net benefits from water consumption, average incomes are higher by about 60 per cent among households with tap water access relative to those without such access. When initially unconnected households obtain tap water access (with quality and terms as for connected households), their real incomes as a result rise by between 1 and 5 per cent, differing between cities and with generally higher values in El Salvador. This real income increase eliminates between 1 and 3 per cent of the initial difference in average real incomes between the groups. We take this as evidence that tap water access may serve as an instrument for eliminating welfare differences across households in Central American cities.
We have added a qualification, however, that there may be upward biases, in particular in the El Salvador estimations, due to our inability to correct for the effects of all relevant neighbourhood characteristics of house values. We argue that this is less of a problem in Guatemala where all houses in our sample are located in marginal ‘barrios’. A general problem with the hedonic price method for amenity valuation is the general inability to correct for all relevant background variables that may affect house prices; this is a particularly serious problem when the neighbourhoods from which the data are collected are very heterogeneous, a problem that here applies mainly to the El Salvador data. Clearly, future work, applying this method, must seek to improve the data bases in these dimensions through more careful and detailed data on house characteristics and location. We intend to contribute to such work in the future.