1. INTRODUCTION
Quantitative comparisons in economic history based on national accounts were once largely limited to a small sample of countries over relatively short periods of time (Maddison Reference Lury1964, Reference Maddison1991). However, recent advances in historical national accounting for a wider variety of places over longer historical periods have provided the foundation for a new body of comparative research on regions sometimes far distant in space and time (Maddison Reference Maddison2001, Reference Maddison2010; Broadberry Reference Broadberry, Campbell, Klein, Overton and Van Leeuwen2014). This paper uses 20th century Africa and pre-industrial Europe to show how GDP per capita data can be used to guide reciprocal comparisons between regions to provide insights into the process of development.
Comparisons between these two regions using GDP per capita have been criticised on the grounds that they fail to do justice to the multi-dimensional nature of welfare as a result of access to new technology as well as improved health and education outcomes (Jerven Reference Humphries2012). These alternative measures show a smaller gap between developed and developing nations than suggested by comparisons based on GDP per capita. One response has been the use of alternative measures of economic performance, such as the human development index (HDI) and the historical index of human development (HIHD), which include data on life expectancy and educational attainments as well as per capita income. We argue that these wider indicators provide an appropriate way of comparing levels of welfare, but that for researchers interested in the level of economic development, focussing on production possibilities and the sustainability of consumption, GDP per capita provides a better guide for comparisons. This is demonstrated using data on the share of the labour force in agriculture, which also suggests that many African countries today are at a level of development similar to Europe in the medieval and early modern periods.
New work in historical national accounting illuminates the long process of economic development in Europe, demonstrating the importance of structural change and institutional change for ending growth reversals and making the transition to sustained economic growth. This approach can provide the basis for genuinely reciprocal comparisons between Africa and Europe, using each continent as a mirror for the other (Fenoaltea Reference Epstein1999; Pomeranz Reference O’brien2000). Looking first at Africa in a European mirror, it is important to ensure that policy recommendations drawn from European experience do not require a highly developed institutional framework that did not exist when Europe was at similar levels of development to Africa today. Turning to Europe in an African mirror, evidence from Africa today can be used to understand the institutional changes that underpinned earlier economic development, where historical actors can no longer be questioned. In both cases, it is the level of GDP per capita that identifies the appropriate years of comparison on the two continents.
The paper proceeds as follows. The next section discusses the recent advances in historical national accounting and presents data on Europe since 1086, and Africa since 1700. Section 3 then confronts the criticisms levelled against comparisons between countries widely separated in space and time, acknowledging that whilst the human development indicators favoured by critics of historical national accounting may provide an appropriate guide to comparisons of overall welfare, GDP per capita provides an appropriate guide to reciprocal comparisons for questions of economic development focussing on production and the sustainability of consumption. Section 4 elaborates further on this point by examining structural change as measured by the agricultural share of the labour force. Section 5 explores the implications for our understanding of African economic development using a European mirror, while section 6 draws out the implications for European development using an African mirror. Section 7 concludes.
2. RECENT ADVANCES IN HISTORICAL NATIONAL ACCOUNTING
Until recently, most historical comparisons using national accounts covered a limited range of countries and a limited span of time. In his early work, Maddison (Reference Lury1964, Reference Maddison1982, Reference Maddison1991) focussed on rich, developed countries during the period since 1870, before extending the coverage to more countries and a much longer span of time (Maddison Reference Maddison1995, Reference Maddison2001, Reference Maddison2010). Maddison (Reference Maddison1995) for the first time reported levels of GDP per capita in 1990 international dollars for a wide range of countries over the last two millennia. For each country, GDP in 1990 was measured in local currency but converted to 1990 international dollars by comparing local prices with dollar prices in the same year, and using a weighting scheme based on international rather than just U.S. patterns of consumption. The purchasing power parities used to make the comparisons were drawn from detailed surveys conducted by the Income Comparisons Project (ICP), which was taken over in the 1980s by the United Nations/Eurostat/Organisation for Economic Co-operation and Development (OECD).
The use of 1990 international dollars for historical comparisons of GDP per capita has now become standard for all times and places, partly as an accidental by-product of controversy over later rounds of ICP, which produced some severe anomalies, particularly with respect to India and China (World Bank Reference Van Zanden and Van Leeuwen2008). One feature of this stability in the benchmark over a long period of time is a familiarity in the economic history community with the «bare bones subsistence» level of GDP per capita at $400. This arose from the fact that the World Bank in 1990 used the figure of a dollar a day as the poverty line for an individual. If everybody lived in poverty, therefore, GDP per capita would be $365. But since even the poorest economies have a small elite with much higher levels of income, Maddison hypothesised that the minimum GDP per capita that could be observed would be around $400 in 1990 international pricesFootnote 1 .
2.1. European Growth and Development (1270-2008)
Although Maddison’s (Reference Maddison2010) data set represents a major breakthrough for quantification of long-run economic growth, it contains a large amount of «guesstimation» for the pre-1870 period, with a number of observations set at or close to $400 in 1990 international prices, or at «bare bones subsistence». Also, Maddison provided his conjectural estimates only for a small number of benchmark years, switching to annual data only after 1870.
Stimulated by Maddison’s work, economic historians have recently begun to produce estimates of per capita income for the pre-1870 period in a national accounting framework, based on hard data, and a firmer picture has begun to emerge of the contours of long-run growth and development in Europe. This is possible because parts of medieval and early modern Europe were much more literate and numerate than is often thought, and left behind a wealth of data in documents such as government accounts, customs accounts, poll tax returns, parish registers, city records, trading company records, hospital and educational establishment records, manorial accounts, probate inventories, farm accounts, tithe files and other records of religious institutions. With a national accounting framework and careful cross-checking, it is possible to reconstruct population and GDP back to the medieval period.
For some European countries, abundant quantitative information has survived, so that historical national accounts can be constructed on a sectoral basis in great detail. Britain and Holland have very rich data, with historical national accountants able to build on decades of detailed data processing by generations of scholars as well as well-stocked archives (van Zanden and van Leeuwen Reference Young2012; Broadberry et al. Reference Broadberry, Campbell and Van Leeuwen2015a). For other countries, where information is more limited, or where there has been less processing of existing data, Malanima (Reference Maddison2011), Álvarez-Nogal and Prados de la Escosura (Reference Álvarez-Nogal and Prados de la Escosura2013) and others have developed a short-cut method for reconstructing GDP. For agriculture, the demand for food is derived from estimates of population, real wages and the relative price of food, with adjustments for foreign trade. For non-agriculture, the short-cut method uses data on the urbanisation rate, again with adjustments for specific factors such as agro-towns and rural proto-industry.
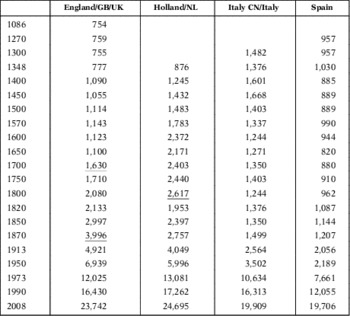
The new European estimates for the pre-1870 period, combined in Table 1 with Maddison’s estimates for the post-1870 period, revise upwards the level of per capita GDP in the middle ages. Medieval Western Europe was substantially richer than Maddison thought, and subsequent growth therefore more gradual. The British data, taken from Broadberry et al. (Reference Broadberry, Campbell and Van Leeuwen2015a) for the period 1270-1870, cover the territory of England before 1700 and Great Britain between 1700 and 1870, before linking up with Maddison’s (Reference Maddison2010) estimates for the United Kingdom. The Dutch data for the period 1348-1807 from van Zanden and van Leeuwen (Reference Young2012) cover the territory of Holland and link up with Maddison’s (Reference Maddison2010) data for the Netherlands. The Italian data for the period 1300-1860 from Malanima (Reference Maddison2011) cover Central And Northern Italy, before linking up with Maddison’s (Reference Maddison2010) estimates for the whole of Italy. The data of Álvarez-Nogal and Prados de la Escosura (Reference Álvarez-Nogal and Prados de la Escosura2013) for the period 1270-1850 cover the territory of modern Spain, and again link up with Maddison’s estimates for later years. The data in Table 1 support the notion of a reversal of fortunes between the North Sea area and Mediterranean Europe, sometimes known as the Little Divergence (Broadberry Reference Broadberry, Campbell, Klein, Overton and Van Leeuwen2014). Before the Black Death in 1348, per capita incomes were substantially higher in Italy and Spain than in England and Holland, whereas by 1750 on the eve of the Industrial Revolution, per capita incomes were substantially higher in Great Britain and the Netherlands than in Italy and Spain.
GDP PER CAPITA LEVELS IN EUROPE (1990 INTERNATIONAL DOLLARS)

Sources: England/Great Britain (GB)/United Kingdom (UK): England, 1086-1270: Broadberry and van Leeuwen (Reference Chang2011); England, 1270-1700 and GB, 1700-1870: Broadberry et al. (Reference Broadberry, Campbell and Van Leeuwen2015a); UK, 1870-2008: Maddison (Reference Maddison2010). Holland/Netherlands (NL): Holland, 1348-1807: van Zanden and van Leeuwen (Reference Young2012); NL, 1807-2008: Maddison (Reference Maddison2010). Italy Central and North (CN)/Italy: Italy CN, 1300-1860: Malanima (Reference Maddison2011); Italy, 1860-2008: Maddison (Reference Maddison2010). Spain: Spain, 1270-1850: Álvarez-Nogal and Prados de la Escosura (Reference Prados de la Escosura2013); Spain, 1850-2010: Maddison (Reference Maddison2010).
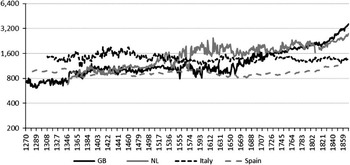
Figure 1 plots the annual data underlying Table 1, but with the data for England spliced to the data for Great Britain in 1700, and the data for Holland spliced to the data for the Netherlands in 1807, so as to provide continuous series within constant boundaries. For Italy and Spain, there was a clear alternation of periods of positive and negative growth, with growth booms typically followed by growth reversals, leaving little or no progress in the level of per capita incomes over the long run. Per capita GDP therefore fluctuated without trend between 1270 and 1850 in Italy and Spain, consistent with the phenomenon labelled by Jones «growth recurring» (Reference Jerven1993, p. 1). For the cases of Great Britain and the Netherlands, however, although there were alternating periods of positive and negative growth until the 18th century, there was also a clear upward trend, with the gains following the Black Death being retained, and the growth reversals eventually disappearing with the transition to modern economic growth. One way to think about Europe’s Little Divergence is therefore not so much the beginning of growth, but rather the dampening and eventual elimination of growth reversals. This underlines the point that low per capita incomes in pre-industrial economies are not due to persistent failure, but rather due to inconsistency, so that the fruits of short run success are quickly lost.
REAL GDP PER CAPITA IN GREAT BRITAIN (GB), THE NETHERLANDS (NL), ITALY AND SPAIN, 1270-1850 (1990 INTERNATIONAL DOLLARS, LOG SCALE) Note: The data for England have been spliced to the data for GB and the data for Holland have been spliced to the data for the NL to provide continuous series within constant boundaries. Sources: Broadberry et al. (Reference Broadberry, Campbell and Van Leeuwen2015a); van Zanden and van Leeuwen (Reference Young2012); Malanima (Reference Maddison2011); Álvarez-Nogal and Prados de la Escosura (Reference Álvarez-Nogal and Prados de la Escosura2013).

2.2. African Growth and Development (1700-2008)
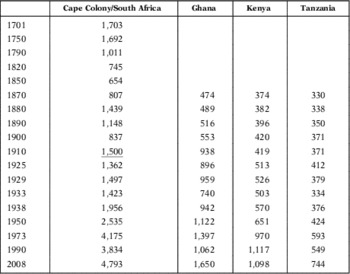
Maddison’s (Reference Maddison2010) data set included very few observations for Africa before 1950. However, extensive colonial records are available for this period, and have recently been utilised to produce estimates of GDP per capita reaching back to 1870 for most African countries and further in a couple of cases. The most ambitious study is Fourie and van Zanden’s (Reference Fourie2013) paper on South African GDP, which shows much higher per capita GDP levels in the pre-1870 period than suggested by Maddison (Reference Maddison2010). Although Fourie and van Zanden’s estimates are only for the Cape Colony, they do not differ by very much from Maddison’s conjectural estimates for South Africa as a whole between 1870 and 1913. Much like in medieval Europe, these estimates revise earlier perceptions of the Cape Colony as largely stagnant, at close to subsistence level, until the discovery of minerals in the 19th century. However, the Cape economy was subject to reversals, particularly in the 1710s, the 1780s and through the early 19th century. These crises were linked to external factors interfering with international trade, such as warfare in the 1710s and 1780s, and also to internal factors such as a smallpox epidemic in the 1710s (Fourie and van Zanden Reference Fourie2013). Manning’s (Reference Malanima1982) figures on per capita income growth in the Kingdom of Dahomey, based on trade data, are also consistent with this picture of episodic growth.
This pattern of booms and busts, largely linked to international trade, is also apparent from the «indirect» estimates of GDP per capita produced by Prados de la Escosura (Reference Pomeranz2012) for the same sample of countries as Maddison (Reference Maddison2010) for the period 1870-1950. Prados de la Escosura uses an association between per capita GDP and the per capita income in terms of trade, plus other control variables during the post-1950 period, to infer GDP per capita for earlier years. This is done by applying the parameter values taken from a pooled regression with nine cross-sections between 1950 and 1990 to the historical values of the right-hand side variables. The key right-hand side variable is the income terms of trade per capita, obtained by deflating African countries’ per capita nominal export values with the industrial countries’ export unit values. The other variables control for location (coastal or landlocked), resource endowments, colonial legacy and region. Prados de la Escosura’s estimates exhibit per capita GDP growth during the late 19th and early 20th centuries, a period when the production of cash crops for export was expanding rapidly under favourable terms of trade (Hopkins Reference Hersh and Voth1973; Havinden and Meredith Reference Harttgen, Klasen and Vollmer1996)Footnote 2 . Many countries then experienced a sharp reversal during the Great Depression of the 1930s, when export prices declined. In Tanzania, this reversal was sufficiently severe that the level of per capita income achieved in 1925 was not reached again until after World War II.
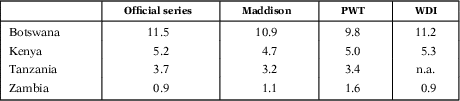
Table 2 provides a summary of these new data for the pre-1950 period, linked to Maddison’s (Reference Maddison2010) estimates for the period 1950-2008. The use of these series needs some justification, since it has long been common for economists to point to shortcomings in the national accounts produced by African statistical offices (Samuels Reference Samuels1963; Lury Reference Livi-Bacci1964). Indeed, Jerven (Reference Jerven2013, Reference Jerven2014) has recently argued that the errors are so large that they systematically distort the picture of African growth and cannot be used to support the common perception of poor economic performance in Africa since World War II. As these data form the basis of Maddison’s (Reference Maddison2010) series of GDP per capita used in this study, a consideration of Jerven’s arguments is called for. First, many of the issues raised by Jerven concerning the calculation of a GDP series for a particular country are not unique to Africa, and apply equally to other regions. Second, Jerven (Reference Jerven2014) particularly focusses on disagreement between GDP series reported by different international data sets, taken from National Statistical Offices (official series), the Maddison data set, the Penn World Tables and the World Bank’s World Development Indicators. However, the differences in long-run trends reported by these agencies are much smaller than the differences in annual growth rates that Jerven emphasises. Also, the different agencies agree closely on country rankings of performances over the medium run, as can be seen clearly in Table 3. Indeed, as van Waijenburg (Reference Van Waijenburg2014, p. 302) notes, the correlation coefficients of relative rankings of countries across the various data sets are higher for Africa than for Asia, and are not uniformly lower than for Latin America or even for Western countries. As always, criticism of data quality needs to be accompanied by a careful assessment of the purposes for which the data are being used. If the question concerns the performance of African economies over periods of more than a year or two and if account is taken of levels and growth rates together, then Jerven’s bleak assessment of the state of African national accounts since 1950 loses much of its force.
REAL GDP PER CAPITA IN SUB-SAHARAN AFRICA, 1701-2008 (1990 INTERNATIONAL DOLLARS)

Sources: Cape Colony/South Africa: Cape Colony, 1701-1910 and South Africa, 1910-2008: Fourie and van Zanden (Reference Fourie2013); Ghana, Kenya, Tanzania: 1870-1950: Prados de la Escosura (Reference Pomeranz2012, pp. 33-34); 1950-2008: Maddison (Reference Maddison2010).
AVERAGE ANNUAL RATES OF GDP GROWTH IN AFRICAN COUNTRIES (1966-1995)
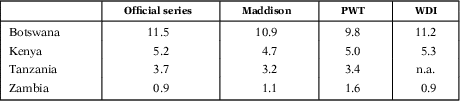
Note: PWT: Penn World Tables, WDI: World Development Indicators.
Source: Derived from Jerven (Reference Jerven2014, pp. 50-51).
Although Jerven (Reference Humphries2012, Reference Jerven2014) provides no alternative series to GDP per capita, other authors have responded to the allegations of an African «statistical tragedy» by suggesting the use of other data to track African economic growth in recent decades (Devarajan Reference De Vries, Timmer and De Vries2013). Henderson et al. (Reference Havinden and Meredith2012) suggest using satellite maps of lights at night, but they find that the GDP per capita data neither overstate nor understate economic growth consistently. Although Young (2012) claims that indices of asset ownership from the World Bank’s Demographic and Health Survey have grown much more rapidly than GDP per capita in African countries in recent years, Harttgen et al. (Reference Gardner2013) find no evidence of a recent African growth miracle beyond that which is visible in the GDP per capita data, once account is taken of the weakness of the relationship between growth in assets and growth in income.
3. COMPARING EUROPE AND AFRICA
Having assembled data on GDP per capita in Europe and Africa in the same units, 1990 international dollars, in Tables 1 and 2, it is natural to compare the two continents. The most obvious way to do that is to compare European and African economies at the same point in time. In 2008, the scale of the per capita income difference between the two continents was very large. Comparing the Netherlands with Tanzania, the scale of the difference was >33 to 1. Even comparing the richest African country in the sample, South Africa with the poorest European country, Spain, the difference was >4 to 1. An alternative way of comparing two economies is at the same level of development, an approach pioneered by Chenery and Syrquin (Reference Cowen and Shenton1975) in the context of post-war global development and applied to 19th century Europe by Crafts (Reference Crafts1984), who used it to highlight the distinctive features of British industrialisation. Comparisons at the same level of GDP per capita suggest that the poorer African economies in 2008 were at the same level as England during the late medieval period, 1086-1348. Even moderately well-off African countries in 2008 such as Ghana were at the same level as Britain in 1700, while the richest sub-Saharan African countries such as South Africa were still only at the level of the United Kingdom around 1913. Findings such as these have prompted criticism of comparative research based on national accounting measures (Austin Reference Austin2007; Jerven Reference Humphries2012).
3.1. Criticisms of Historical National Accounting
Comparisons of economic performance based on historical national accounts are sometimes criticised for being inevitably «Eurocentric» and biased against non-Western countries (Jerven Reference Humphries2012). This may at first sight appear to be a natural development of the calls for reciprocal comparisons in global economic history made by many economic historians (Wong 1997; Pomeranz Reference O’brien2000; Austin Reference Austin2007). However, whilst Jerven (Reference Humphries2012, p. 110) is correct to point out that Maddison’s (Reference Maddison2010) estimates of GDP per capita for the period before 1820 are largely conjectures based on assumptions that are open to challenge, they cannot be used to demonstrate an inherent bias against non-Western economies in the whole national accounting framework. Indeed, although Maddison’s (Reference Maddison2010) estimates show the leading Western economies well ahead of the leading Asian economies from the 19th century, they also show a reversal of fortunes during the second millennium, with China leading the world in the year 1000.
Another criticism of the national accounting approach is that «GDP measures a very specific concept of development: the growth of large-scale industrial production and the reach of the nation-state, defined as its ability to tax and record marketed production» (Jerven Reference Humphries2012, p. 116)Footnote 3 . However, services have always been included in national income, even going back to the work of early pioneers such as Gregory King in the 17th century, and it has always been possible to make allowances for non-marketed production and to estimate GDP for regions within and beyond nation states (Reference Kelly and Ó Gráda[1696]1936). This is particularly the case for estimates of GDP derived from the output side, built up on a sectoral basis. Historical national accountants now routinely derive agricultural output from data on cultivated land area and crop yields in a particular geographical area, irrespective of the proportion of output marketed or changes in political boundaries, in line with the United Nations (Reference Thomas2009) System of National Accounts, which aims to capture all of the agricultural output of rural households, but only that part of their non-agricultural production that was marketed. Information on the share of commodity output marketed can then be used to estimate the output of distribution and transport services. This approach has been followed all the way back to the 13th century in the case of Britain (Broadberry et al. Reference Broadberry, Campbell and Van Leeuwen2015a). For economies where information is more limited, agricultural output can be estimated from a demand function, using data on population, wages and prices, together with elasticities of demand derived from the same economy at a later date, or from other economies at a similar level of development. Again, there need be no presumption that all of the output was marketed, and an allowance can also be made for imports and exports where trade data are available (Allen Reference Allen2000; Malanima Reference Maddison2011; Álvarez-Nogal and Prados de la Escosura Reference Prados de la Escosura2013).
The historical national accounting approach is sometimes criticised on the grounds that nature, climate and factor endowments can be used to explain many economic decisions that at first sight seem inefficient, such as the choice of particular crops, agricultural production systems and patterns of specialisation, or the use of old technology and capital (Jerven Reference Humphries2012, pp. 117-123). This general proposition is obviously consistent with much work in economic history, and one with which we are in full agreementFootnote 4 . However, the suggestion by Jerven (Reference Humphries2012, pp. 119-120) that measures of output should somehow avoid including the economic advantages from, say, the use of manure and ploughs in England because the tsetse fly made it impossible to hold livestock in Asante, is surely to confuse the explanation with what is to be explained. The endorsement by Jerven (Reference Humphries2012, p. 120) of Sugihara’s (Reference Solar2007) view that the «East» followed a different labour-intensive path of development from the capital-intensive path followed by the West, as a result of different endowments, is subject to the same assessment. It may well explain a lower level of per capita income in the East, but it does not make Eastern incomes the same as Western incomes. Furthermore, without wishing to deny that the Japanese economy today is highly distinctive in many ways, it is worth noting that it is now just as capital intensive as the West (Broadberry et al. Reference Broadberry, Guan and Li2015c). Again, without seeking to suggest a single path to development, it is at least worth asking to what extent the labour-intensive industrialisation highlighted by Hayami and Tsubouchi (1989) in Tokugawa and early-Meiji Japan shared characteristics with proto-industrialisation in early modern Europe.
3.2. Human Development Indicators
The HDI can be seen as an attempt to deal with some of the issues raised in the previous section, and to provide an alternative to GDP per capita for comparing economies at different levels of development. After all, medieval Europe did not have access to modern technologies which are available to at least some in all African countries today, such as mobile phones, motor vehicles and effective medicines. As the prices of these goods in medieval times were therefore effectively infinite, consumers with $400 in 1990 prices today have a wider range of options than consumers in the pastFootnote 5 . Partly as a result of modern technology, other welfare indicators, such as life expectancy and educational attainments, show much smaller gaps between developed and developing countries.
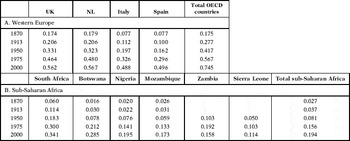
The HDI is constructed as an unweighted arithmetic average of indices of educational attainments, life expectancy and per capita GDP, with each component of the index transformed linearly to reflect its asymptotic limits. This has been applied in a historical context by Crafts (Reference Deane and Cole2002). However, Prados de la Escosura (Reference Prados de la Escosura2013, 2014) has proposed an alternative measure, which he calls the Historical Index of Human Development, which involves taking the geometric rather than arithmetic mean of the component sub-indices and transforming each sub-index in a non-linear way. HIHD measures from Prados de la Escosura are provided in Table 4. They show that, with the exception of South Africa, sub-Saharan Africa at the end of the 20th century was achieving levels of human development on a par with the major Western countries (current members of the OECD) during the late 19th century, while South Africa in 1999 was achieving levels of human development experienced by the richest parts of Western Europe in the mid-20th century. This is thus consistent with the finding noted by Crafts (Reference Deane and Cole2002) that the HDI measure provides a much more optimistic assessment of the performance of developing countries relative to OECD countries than GDP per capita.
HISTORICAL INDEX OF HUMAN DEVELOPMENT ACROSS WESTERN EUROPE AND SUB-SAHARAN AFRICA (1870-1999)

If a researcher is interested primarily in how levels of welfare compare between sub-Saharan Africa today and Europe in the past, then the relevant point of comparison is with Europe in the late 19th century, as suggested by the human development measures. However, if a researcher is interested in issues of economic development, encompassing production and the sustainability of consumption, GDP per capita provides a better guide for comparisons. This will become more apparent in the next section, where it will be shown that the share of the labour force in agriculture also suggests that many African countries today are at a similar level of development to Europe in the medieval and early modern periods.
4. STRUCTURAL CHANGE AND ECONOMIC DEVELOPMENT
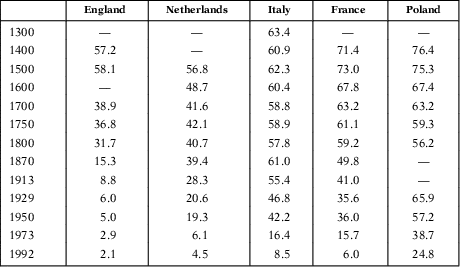
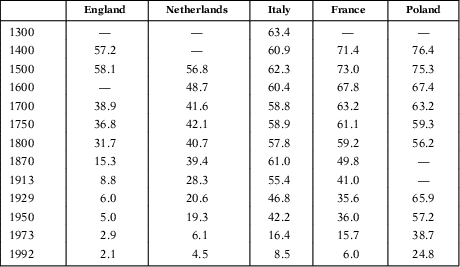
By the 19th century, many European economies were much more diversified than most African economies today, which have economic structures more in line with those of Europe in the pre-industrial period. Table 5 gives the share of the labour force of selected European countries since the medieval period. Rising per capita incomes were strongly associated with declining shares of labour in agriculture. The growth of specialised industrial and service sectors can be seen to have proceeded faster in Holland and Britain than in the rest of Europe. By 1600, the release of labour from agriculture had proceeded further in the Netherlands than in the rest of Europe, as the Dutch economy relied increasingly on imports of basic agricultural products such as grain and paid for them with exports of higher value-added products (de Vries and van der Woude Reference Van Bavel and Rijpma1997). By 1700, the share of the labour force engaged in agriculture was even smaller in England, where a highly commercialised agriculture produced enough grain to feed the population without recourse to substantial imports until well into the 19th century (Deane and Cole Reference Devarajan1967; Crafts Reference Crafts1985). The share of the labour force in agriculture remained substantially higher in the rest of Europe well into the 20th century.
SHARE OF AGRICULTURE IN THE EUROPEAN LABOUR FORCE (%)
Sources: Derived from Broadberry et al. (Reference Broadberry, Custodis and Gupta2013), Allen (Reference Allen2000, pp. 8-9), Mitchell (Reference Milanovic, Lindert and Williamson1998).
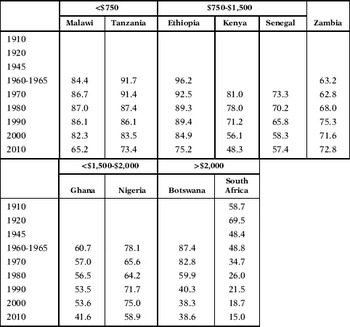
Data on the agricultural share of the labour force in African countries are shown in Table 6. As in Europe, there is a general negative relationship between the level of per capita income and the share of the labour force in agriculture, although it seems to be looser than in Europe. Thus the countries in the poorest category of income, Malawi and Tanzania, clearly have higher shares of labour in agriculture than the countries in the richest category, South Africa and Botswana. However, in the intermediate categories, the relationship is not monotonic. Thus, for example, Kenya has a lower agricultural share than Nigeria, despite being poorer.
SHARE OF AGRICULTURE IN THE AFRICAN LABOUR FORCE, COUNTRIES GROUPED BY PER CAPITA INCOMES IN 2008 (%)

Comparing Tables 5 and 6, it is clear that agriculture’s share of the labour force in African countries today is in most cases still much higher than in late 19th century Europe. By contrast, the HIHD in Table 4 suggests that welfare levels were similar in these two cases. If the question of interest is structural change and economic development, then human development measures will not be helpful in guiding researchers to the appropriate period of European economic history for comparison with Africa today. By contrast, Tables 1 and 2 suggest that the GDP per capita measures do indeed capture the relevant dates for comparison. GDP per capita and the share of the labour force in agriculture both suggest Europe before 1700 as an appropriate comparator for most of sub-Saharan Africa This has important implications for reciprocal comparisons between the two continents.
5. RECIPROCAL COMPARISON (1): AFRICA IN A EUROPEAN MIRROR
The next two sections of the paper outline possibilities for reciprocal comparisons based on GDP per capita. In the current section, we focus on revising lessons drawn from the European experience by looking at Europe at a comparable stage of development. The next section will suggest ways in which the study of African economies in the modern period can similarly help us to understand the process of development by providing access to the types of sources which do not exist for historical economies elsewhere. It should be stressed that the aim of these two sections is to suggest agendas for future research rather than to develop a coherent theory of economic development and the transition to sustained growth.
Applying the experience of Europe to Africa is nothing new. A common complaint about studies of African economies as well as development policy recommendations is that both are often based exclusively on the experience of Europe and North America, or theories derived from it (Cowen and Shenton Reference Crafts1996, pp. 11-12; Austin Reference Austin2007). These ideas, it is argued, neglect the potentially more comparable perspective of other developing nations. Austin observes that «India, Southeast Asia, and the Caribbean are for Africanists probably more promising, for both geographical and historical reasons, than Europe or North America as sources of comparable experience» (Reference Austin2007, p. 3).
One reason why Asia and the Caribbean may seem more likely as comparators is that the experiences and concepts drawn from Europe and North America have often originated in the relatively recent histories of these regions. One specific example is the «Washington Consensus», which informed policy prescriptions under structural adjustment in the 1980s. The certainty in these policies, which stressed a limited role for government, was linked to the combination of intellectual shifts away from Keynesianism and towards the new classical economics alongside the failure of the Soviet economies and a political backlash against state-led development (Mkandawire and Soludo Reference Mkandawire1999, p. 41). However, many have suggested that they were not appropriate in an African context, arguments supported by the largely unimpressive results of structural adjustment programmes. In particular, it has been argued that the prescribed policies demanded greater institutional capacity than was possessed by many poor countries at that time (Mkandawire Reference Mitchell2001; Rodrik Reference Prados de la Escosura2007). Critics have argued that European countries did not possess such institutional capacity when they themselves were developing, and therefore such recommendations set up unfair expectations (Chang Reference Chenery and Syrquin2002). One consequence of structural adjustment programmes in Africa was a substantial scaling back of the state. This retrenchment in the state was accompanied by significant deindustrialisation and the movement, in some cases, of labour back into agriculture and the loss of early gains in indicators of well-being such as life expectancy, literacy and infant mortality (Sender Reference Rodrik1999; Whitfield 2012, p. 242).
Nor are such problems limited to widely criticised structural adjustment programmes. In a recent review of development policies in Africa, Monga and Lin argue that such policies «generally promote a uniform set of macroeconomic and structural policies across countries, regardless of their levels of economic development and economic structure» (Reference Mkandawire and Soludo2015, p. 5). One problem, they argue, is the adoption of inappropriate comparisons: for the DRC, the relevant example is not advanced countries such as Canada but rather other developing countries such as Brazil or Malaysia when their levels of GDP per capita were lower than today (Monga and Lin Reference Mkandawire and Soludo2015, p. 11).
Our approach to Europe-Africa comparisons can help to guard against the choice of inappropriate policies by focussing on what conditions were like when Europe was itself developing. We are not the first to do this — Bates (Reference Bates2010), for example, compares the development of political institutions in medieval Europe with contemporary Africa. However, his comparisons were based on largely impressionistic information on the structure of societies and economies. With the publication of new estimates of GDP per capita for a longer period of European history, we can now guide such comparisons more precisely, using the methods pioneered by Chenery and Syrquin (Reference Cowen and Shenton1975) and Crafts (Reference Crafts1984). One implication of the new GDP per capita estimates has been to show that the appropriate point of comparison is therefore Europe before the Industrial Revolution, when institutions in Europe were very different from what they had become by the late 19th century, the point of comparison suggested by the HIHD.
During this earlier period, success was arguably driven by building state intervention and institutional capacity rather than by dismantling it (Karaman and Pamuk Reference Jones2010; O’Brien Reference Monga and Lin2011). While the policy prescriptions of the Washington Consensus may have been useful in the context of the United States and Britain in the 1970s (and this is still debated), they stand in contrast to the conclusions which would be drawn from Europe’s early experience, when the challenge was building the capacity and reach of a centralised state and establishing its supremacy over competing organisations and institutions at a local level. Epstein (Reference Dincecco2000) and Dincecco (Reference De Vries and Van Der Woude2013) argue forcefully that one of the central features of European development in the medieval and early modern period was the consolidation and centralisation of state power which facilitated internal market integration. A common way to measure this development in state capacity is through fiscal data — Dincecco (Reference De Vries and Van Der Woude2013) uses data on tax revenues to show links between improved fiscal performance, state centralisation and the restriction of autocratic power. Karaman and Pamuk (Reference Jones2010, p. 611) show that in England and the Dutch Republic, the two countries which first transitioned to sustained economic growth, per capita fiscal revenues increased through the 17th and 18th centuries while revenues in other parts of Europe largely stagnated.
Such conclusions support recent arguments in the study of African economic development, which have also stressed the importance of increasing state capacity. In one of a series of critiques of the Washington Consensus, Stiglitz (1998) called for development efforts to take the «lessons of history» into account, particularly the fact that «successful development efforts in the United States as well as many other countries had involved an active role for government». As in the case of Europe, increasing fiscal capacity has been linked in Africa to improvements in governance and institutions (Brautigam et al. Reference Broadberry2008; Baskaran and Bigsten Reference Baskaran and Bigsten2013). This hypothesis has motivated several studies of the historical development of fiscal capacity amongst African countries (Frankema Reference Fourie and Van Zanden2010; Gardner Reference Frankema, Williamson and Woltjer2010, Reference Gardner2012; Mkandawire Reference Mkandawire2010).
These institutional changes in Europe were accompanied, as shown in the previous section, by a decline in the share of labour in agriculture, starting as early as the 14th century. This association suggests that structural change and institutional development combined were important in the transition of European countries to sustained economic growth. One broad lesson which might be derived from this is that the indicators of economic development by which we assess African economies should emphasise these two factors. Whitfield writes that «all advanced industrial countries underwent processes where the share of manufacturing increased and the share of agriculture decreased, in terms of both GDP and percentage of labour force employed, and where agricultural productivity increased significantly» (2012, p. 241). Tracking the extent to which countries are undergoing the same processes may help us to understand divergent patterns of development within sub-Saharan Africa.
Beyond this, however, the European experience can illustrate the types of economic diversification most likely to facilitate the transition to sustained economic growth. The literature on the Little Divergence in Europe emphasises that there are two ways to achieve diversification at the level of the aggregate economy. One possibility is for individuals to perform multiple activities, dividing their time between working on the land and other occupations. This leads to a peasant economy with some proto-industry, but such economies tend to remain subject to growth reversals. A second possibility is for each individual to specialise in a single sector, with those remaining on the land becoming large-scale farmers, while those who leave the land become specialised workers in industry or services. This tends to result in rising productivity and a greater resilience to growth reversals. We would characterise Italy and Spain as remaining in the diversified peasant economy category experience growth reversals until the 19th century and Britain and Holland as moving towards the diversified but specialised category from the 14th century.
This approach need not be limited to comparisons between Africa and Europe. New estimates of GDP per capita in Asian countries before the 19th century have been published recently, and could be used for the same purpose (van Zanden 2003; Broadberry et al. Reference Broadberry, Guan and Li2015c, Reference Broadberry and Van Leeuwen2015d). An advantage of European data is that the extent of research on European development over time has provided a more comprehensive picture of development across the medieval and early modern periods. One of our purposes in writing this paper is to suggest that this knowledge should not be abandoned in attempts to understand the transition to sustained economic growth. This is not to argue that Europe provides a specific blueprint for African development; changing circumstance and technologies must be factored into the patterns outlined above (Bates Reference Bates2010, pp. 85-87). Further, the next section will argue that the comparison can go the other way and the study of African economies can do much to inform our views of the European past.
6. RECIPROCAL COMPARISON (2): EUROPE IN AN AFRICAN MIRROR
Gains from the comparison of Africa and Europe need not be only one way. There remains much that we do not know about the nature of the transition to sustained growth in Europe. In particular, although it is not difficult to recognise big differences between the institutions of Europe before the Industrial Revolution and after the transition to modern economic growth, little is known about the dynamic processes involved in getting from one to the other, as well as the links between institutional improvements and structural change. This section will highlight two hypotheses related to institutions and economic development in Europe, for which we have not yet understood the underlying process which led from point A to point B. If we could understand how institutional change works in very poor economies today, then these insights could be used to shed light on how development occurred in Europe in the past. Evidence from Africa in more recent years can contribute to this. As they are at the same level of development as pre-industrial Europe, but provide access to survey evidence concerning individual responses to institutions and institutional change, African economies today hold out the promise of pointing historians towards the key factors that got Europe started on the development transition.
There are precedents for the use of evidence from development research to fill in gaps in our knowledge of European economic history. For example, recent studies of per capita calorie consumption (an important indicator of living standards) in pre-industrial Europe have used evidence from modern developing countries to estimate the number of calories needed to survive (Livi-Bacci Reference King1991; Allen Reference Allen2009; Humphries Reference Hopkins2012, pp. 6-11), while other studies have made use of estimates of income and price elasticities of demand from later developing countries to work out food consumption trends in pre-industrial Europe (Álvarez-Nogal and Prados de la Escosura Reference Álvarez-Nogal and Prados de la Escosura2013; Kelly and Ó Gráda Reference Karaman and Pamuk2013, p. 1139; Broadberry et al. Reference Broadberry, Fukao and Zammit2015b). Others have drawn on the experience of African countries now or in the past to understand the implications of similar events or phenomena in Europe, such as, for example, the history of slavery (Fenoaltea Reference Epstein1999) or witchcraft trials (Thomas Reference Sugihara1971). Inspired by these examples, we explore survey and experimental data from Africa today in search of insights into the dynamics of institutional change in pre-industrial Europe. In particular, we examine two hypotheses concerning the interactions between institutional change, structural change and economic development.
The first hypothesis concerns the way that attitudes towards taxation can change so as to permit state development, which then provides the institutional basis for sustained economic growth. This can be addressed using survey data. In a recent paper motivated by largely European narratives surrounding the rise of the «fiscal contract», Bodea and LeBas (Reference Brautigam, Fjeldstad and Moore2016) find that individuals are more likely to support the state’s right to tax if they benefit from public goods delivery, while individuals are less likely to support the state’s right to tax if they live in communities with effective provision of club goods. These findings can only be regarded as suggestive, but they do hold out the promise of shedding light on the dynamics of institutional change in early modern Europe, as well as in Africa today.
These results can be bolstered by those from the broader Afrobarometer surveys. Afrobarometer, a cross-national survey undertaken across a growing number of African countries and repeated at regular intervals, asks a series of common questions about the current economic and social circumstances of subjects as well as their attitudes to government and politics. The results have been widely used in political science, economics and development research. In this survey, responses to a question about where (or rather, to whom) respondents would go for assistance if they had been a victim of a crime showed a relatively small number who would go to the police as opposed to private-order organisations such as a traditional leader, family members or a neighbourhood committee. Amongst wealthier countries like South Africa or Botswana, 70 or more per cent of respondents would go to the police. In poorer countries, this dipped to as low as 27 per cent for Guinea or 29 per cent in Niger. In a number of cases, these figures correspond to levels of fiscal performance. Guinea, for example, has a tax effort score of 0.65, meaning that it raises less tax revenue than would be expected given its level of income and other endowments, and a relatively low tax/GDP share of 16.2 per cent. Further research on additional countries and taking into account other factors is needed to investigate this relationship more rigorously.
Such work could potentially contribute much to directing studies of past institutional development in European countries. Efforts to document the rise of the fiscal state in different parts of Europe have shown that there was considerable variation in the revenue-raising capacity of European governments through the early modern period (Karaman and Pamuk Reference Jones2010). What explains these differences remains little understood. Research on what drives willingness to pay taxes in poor countries today may help us to understand why some countries, particularly England and Holland, outperformed others in terms of fiscal and institutional capacity during a formative period in their economic development.
A second hypothesis concerns the ways in which people in poor economies cope with risk. Bates (Reference Bates2010, p. 23) writes that minimising risk is an important motivation for people in agrarian societies, and may inhibit economic diversification through specialisation which helped pave the way for sustained growth in Europe. For example, the long survival of the apparently inefficient open fields system in European agriculture has been explained as an effort to mitigate risk (Bekar and Reed Reference Bodea and Lebas2003). Similarly, we can observe trends in the share of the labour force in different sectors but we can only speculate as to the motives of people moving from, say, agriculture to urban manufacturing on a permanent basis. Solar suggests that the insurance function provided by the English system of poor relief from the early modern period played an important role in promoting structural change, suggesting that «by providing protection from destitution, (it) made obtaining access to land less urgent» (Reference Sender1995, p. 9). At the moment, this remains a largely untested hypothesis in Europe, although it is interesting to note that a recent paper by van Bavel and Rijpma (Reference Bekar and Reed2015) finds higher levels of spending on all forms of formalised relief in early modern England and Holland, where growth was sustained, compared with Italy, where per capita GDP fluctuated without trend. The experience of South Africa, the most industrialised country in sub-Saharan Africa, provides something of a parallel here. Fourie (Reference Fenoaltea2007) speculates that the early provision of welfare services to «poor whites» in urban centres, amongst other policies intended to alleviate poverty amongst the white population, may have helped facilitate the initial development of manufacturing and argues that similar policies might help stimulate economic change today.
Studies of developing economies today can help us to understand the interaction between risk-aversion, institutions and structural change. Banerjee and Duflo (Reference Banerjee and Duflo2011) highlight the potential of randomised trials and experiments for understanding what motivates people in poor countries to make particular decisions. They also rely on parallel case studies to illustrate that the incentives facing people in developing countries are not always similar to those which motivate decision-making in rich countries. Levels of risk are an important feature in the cases they examine.
If Austin (Reference Austin2007) is correct in arguing that theories based on the experience of industrialised countries may not always be helpful in developing countries, this may also apply to Europe when it was developing. A research agenda which emphasises genuinely reciprocal comparisons between countries at similar levels of development can take advantage of differences in available sources (e.g. archives vs. surveys or randomised trials) to enrich our understanding of the process of development.
7. CONCLUSIONS
As a result of recent advances in historical national accounting, it is now possible to make comparisons of levels of economic development between regions that are far distant in space and time. Critics have argued that income measures exaggerate differences between developed and developing countries, and hence between Africa today and Europe in the past. By including factors such as life expectancy and literacy, which have improved substantially for even the poorest Africans on low incomes, human development measures such as the HDI and the HIHD narrow the differences in welfare levels between developing and developed countries. This provides an appropriate tool of analysis if the question of interest is the comparison of levels of welfare. However, if the question of interest is economic development, encompassing production as well as consumption, comparisons using GDP per capita are more appropriate.
We believe that there is still much to be learned about the development process in both Europe historically and Africa today. Reciprocal comparisons can therefore aid our understanding of both. Examining Africa in a European mirror, we note that it is necessary to ensure that policy recommendations drawn from European experience are not contingent on a highly developed institutional framework which was not in place when Europe was achieving the levels of GDP per capita of Africa today. It must also be recognised that much remains to be discovered about how the underlying institutional changes that accompanied the process of economic development in Europe occurred. This is where examining Europe in an African mirror can help to understand the process of development in Europe, as well as vice versa. Surveys of Africans today can shed light on the dynamics of institutional change when Europe was at similar levels of development.