Introduction
Some planthopper species of Family Delphacidae are important pests of crops and can act as pathogen vectors. In Argentina, different planthopper species transmit the most economically important corn disease, Mal de Río Cuarto virus (MRCV) (Reoviridae, Fijivirus). The main vector, Delphacodes kuscheli Fennah, is the most abundant and frequent vector species in the endemic area of the disease (Laguna et al., Reference Laguna, de Remes Lenicov, Virla, Avila, Giménez Pecci, Herrera, Garay, Ploper and Mariani2002). Nonetheless, there are other species that can transmit MRCV: Chionomus haywardi (Muir) (Velázquez et al., Reference Velázquez, Arneodo, Guzmán, Conci and Truol2003), Peregrinus maidis (Ashmead) (Virla et al., Reference Virla, Giménez Pecci, Carpane and Laguna2004), Toya propinqua (Fieber) (Mattio et al., Reference Mattio, Velazquez, Cassol, Alemandri and Truol2005), Caenodelphax teapae Fowler (Velázquez et al., Reference Velázquez, de Remes Lenicov and Truol2005), Pyrophagus tigrinus Remes Lenicov and Varela (Velázquez et al., Reference Velázquez, Guzmán, Conci, Remes Lenicov and Truol2006) and Tagosodes orizicolus (Muir) (Mattio et al., Reference Mattio, Cassol, de Remes Lenicov and Truol2008). These species contribute distinctively in the epidemiology of MRCV because they vary in their distribution, frequency and transmission efficiency (Remes Lenicov & Virla, Reference Remes Lenicov and Virla1999; Laguna et al., Reference Laguna, de Remes Lenicov, Virla, Avila, Giménez Pecci, Herrera, Garay, Ploper and Mariani2002). Other common planthopper species found in the corn production area are Chionomus balboae (Muir & Giffard, 1924) and Dicranotropis fuscoterminata (Berg, 1879) (Remes Lenicov & Virla, Reference Remes Lenicov and Virla1999), although they have not been established as MRCV vectors. Hence, correctly identifying every planthopper species present in the endemic area is of considerable importance in epidemiological studies of MRCV.
Planthopper species identification is presently based on the use of taxonomic keys. These keys describe structures of the male genitalia for species identification (Remes Lenicov & Virla, Reference Remes Lenicov and Virla1999; Bartlett, Reference Bartlett2014), which requires extensive training and a broad knowledge of these morphological structures. This technique also restricts the precise identification of females and nymphs, two forms that are frequently found in the field and are markedly important in MRCV epidemiology (Garat et al., Reference Garat, Trumper, Gorla and Perez Harguindeguy1999; Boito & Ornaghi, Reference Boito and Ornaghi2008). Another difficulty that limits delphacids identification is the occurrence of brachyptery (reduced wing length) (Denno & Roderick, Reference Denno and Roderick1990), since some characters in wings are frequently used in taxonomic keys (Remes Lenicov & Virla, Reference Remes Lenicov and Virla1999; Bartlett, Reference Bartlett2014). Therefore, accurately identifying planthopper species is usually complex and requires high taxonomic expertise.
Presently, molecular techniques can complement traditional morphological identification in Auchenorryncha (Hemiptera) (Gopurenko et al., Reference Gopurenko, Fletcher, Löcker and Mitchell2013). Mitochondrial DNA (mtDNA) genes are commonly used as molecular markers as they are highly informative for species identification and intraspecific phylogenetic analyses (Behura, Reference Behura2006). These genes can be easily amplified in insects using universal primers and are therefore widely used in this group of arthropods (Behura, Reference Behura2006). Another advantage of these genes is that, as it is a coding region, sequencing errors and pseudogene presence can be easily detected by checking the amino acid translation for evidence of codon slippage and/or stop codon presence (Jinbo et al., Reference Jinbo, Kato and Ito2011). Inside the mtDNA there is a region coding for the cytochrome c oxidase I (COI) gene. This gene has been proposed as a potential region for ‘DNA barcoding’ (Hebert et al., Reference Hebert, Cywinska, Ball and deWaard2003). In DNA barcoding, accuracy in species identification is given by the extent of separation between intra and interspecific divergence known as ‘barcode gap’ (Meyer & Paulay, Reference Meyer and Paulay2005). If levels of intra and interspecific variation overlap between species, the DNA barcode gap is absent and DNA barcode identification of those species is imprecise (Jinbo et al., Reference Jinbo, Kato and Ito2011). This failure has been reported for some insect groups and may be due to diverse causes, including broad genetic diversity within a species, paraphyly or polyphyly between species, mitochondrial introgression, recent species diversification, among others (Jinbo et al., Reference Jinbo, Kato and Ito2011). For Auchenorryncha, DNA barcoding has been suggested as a reliable method for species identification in biodiversity studies in Barrow Island, Australia (Gopurenko et al., Reference Gopurenko, Fletcher, Löcker and Mitchell2013) and applied for planthopper identification in Central America (Bartlett & Kunz, Reference Bartlett and Kunz2015). These previous works show the potential of this molecular tool for identification of most frequent planthopper species of central Argentina.
In turn, mitochondrial genes such as COI can be employed for other molecular techniques, such as ‘Restriction Fragments Length Polymorphism’ (RFLP) (Behura, Reference Behura2006). RFLP technique has been already used for the classification of different insects of difficult morphological identification (Schroeder et al., Reference Schroeder, Klotzbach, Elias, Augustin and Pueschel2003; Thyssen et al., Reference Thyssen, Lessinger, Azeredo-Espin and Linhares2005; Nagoshi et al., Reference Nagoshi, Brambila and Meagher2011; Ming et al., Reference Ming, Wang and Cheng2014). This is an efficient technique, and is more cost-effective and rapid than DNA sequencing. This is particularly important when numerous field samples should be processed, in which COI gene sequencing can prove expensive and barely practical.
Considering the difficulties involved in the traditional morphological identification of planthoppers, the aim of this study was to develop a molecular framework based on DNA barcoding, and using RFLP profiling to provide an expedient method for species identification of the most frequent vector planthoppers affecting corn in central Argentina.
Material and methods
Specimen collection and identification
Adult planthoppers (n = 86) were collected from the MRCV endemic area (Río Cuarto department, Córdoba province, Argentina) during the 2012 corn crop. Insects were sexed and grouped according to genus with the aid of the taxonomic key proposed by Remes Lenicov & Virla (Reference Remes Lenicov and Virla1999). Isogenic lines were generated by individually placing gravid females in pots containing young wheat plants isolated with polycarbonate tubes. These plants were kept in growth chambers under controlled conditions of temperature (25 ± 4°C), photoperiod (16 h of light) and relative humidity (50%) (Truol et al., Reference Truol, Usugi, Hirao, Arneodo, Giménez Pecci and Laguna2001), until egg hatching and development of the first generation. One male and one female of the adults born in the first generation were separated and sent and deposited in the Entomology Division of the Facultad de Ciencias Naturales y Museo de La Plata, La Plata, Buenos Aires, Argentina) for identification. The remaining individuals of the first generation were kept in order to obtain ‘type sequences’ of each species and as reference material for classification of other specimens into morphospecies.
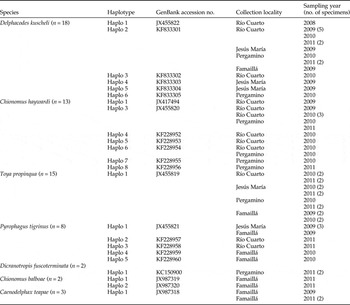
In addition, 61 planthopper specimens of unknown identity were analyzed. These specimens proceed from samples collected in different localities of the corn production region of central Argentina (Famaillá [27°03ʹ 22″S: 65°24ʹ8″W], Jesús María [30°58ʹ35″S; 64°05ʹ45″W], Río Cuarto [33°07ʹ55″S; 64°20ʹ58″W], Pergamino [33°53ʹ18″S; 60°34ʹ59″W]) in 2008, 2009, 2010, 2011 and 2012 (table 1). These individuals were preserved in 100% ethanol at –20°C. They were preliminarily classified into morphospecies, taking the already identified individuals from the isogenic lines as reference and with the aid of the taxonomic key (Remes Lenicov & Virla, Reference Remes Lenicov and Virla1999). Finally, these morphospecies were assigned to species by comparing their sequences with the ‘type sequences’ obtained from the identified isogenic lines.
Description of the planthopper specimens and cytochrome c oxidase I (COI) haplotypes obtained in this study.

DNA extraction, amplification and sequencing of a COI gene fragment
Individual DNA extraction was performed using the cetyltrimethylammonium bromide protocol (Doyle & Doyle, Reference Doyle and Doyle1990). Different combinations of primers published for Hemiptera were tested to amplify the COI gene by polymerase chain reaction (PCR) (table 2), with the aim of selecting the most efficient combination for all the studied species. PCR reactions were performed in a mixture of 20 µl final volume composed of 3 mM MgCl2, 1× buffer, 0.1 mM deoxyribonucleotides, 0.2 µM of primers and 1 U Taq Polymerase (Invitrogen, California, USA) with 100 ng DNA. Thermal cycling conditions for primer combination A were: 94°C for 4 min, 5 cycles of 1 min at 94°C, 45°C for 1 min, 72°C for 1 min, 40 cycles of 1 min at 94°C, 47°C for 1 min, 72°C for 1 min, and a final extension at 72°C for 10 min. Conditions for primer combination B were: 94°C for 2 min, 40 cycles of 1 min at 94°C, 50°C for 1 min, 72°C for 1 min and a final extension at 72°C for 5 min. For primer combinations C and D: 94°C for 4 min, 40 cycles of 30 s at 94°C, 50°C for 1 min, 72°C for 1 min and a final extension at 72°C for 10 min. The amplified products were analyzed via electrophoresis in 1.5% agarose gels in 1× tris-acetate-EDTA buffer and then stained with ethidium bromide and visualized using a ultraviolet transilluminator (Molecular Imager® Gel Doc™, BioRad, California, USA).
Primer combinations tested for polymerase chain reaction (PCR) amplification of a segment of cytochrome c oxidase I (COI) gene from different planthopper vectors species from central Argentina.

[F]: forward primer; [R]: reverse primer.
Samples that amplified a single band were purified in commercial columns QIAquick PCR purification kit (Qiagen Science, Hilden, Germany) and quantified by spectrophotometry using an ND-1000 spectrophotometer (NanoDrop Technologies, Wilmington, USA). Samples with concentrations above 30 ng µl−1 were sent to the Laboratorio de Biotecnología of CICVyA-INTA (Hurlingham, Buenos Aires, Argentina) for sequencing.
Sequence data analysis
The quality of the chromatograms was analyzed with BioEdit versión 7.0 (Hall, Reference Hall1999). Sequences exhibiting low quality and/or ambiguous peaks were discarded and/or sent for re-sequencing. Consensus sequences were obtained using the sense (+) and antisense (–) sequence assembly using Contig Assembly Program in BioEdit version 7.0 (Hall, Reference Hall1999). Translation of sequences to proteins was verified, and sequences were aligned against a GenBank reference [JN391182.1| Laodelphax striatellus COI gene] to determine correct translation with the program MEGA 5 (Tamura et al., Reference Tamura, Peterson, Peterson, Stecher, Nei and Kumar2011). The sequences were queried against pre-existing accessions in GenBank (http://www.ncbi.nlm.nih.gov/genbank) and in Barcode of Life Databases (BOLD – http://www.barcodinglife.com/) to confirm that the fragments were of the COI genes of planthoppers. All the sequences obtained in the present work were deposited at GenBank under accession numbers indicated in table 1.
The sequences were aligned with the Clustal W algorithm (Thompson et al., Reference Thompson, Higgins and Gibson1994) and a pairwise sequence difference matrix was elaborated using the model Kimura-2 – parameter with the option ’pairwise deletion’ of unidentified sites in MEGA 5.0 (Tamura et al., Reference Tamura, Peterson, Peterson, Stecher, Nei and Kumar2011).
The difference between intra and interspecific variation was estimated using Automatic Barcode Gap Discovery (ABGD – http://wwwabi.snv.jussieu.fr/public/abgd/ – Puillandre et al., Reference Puillandre, Lambert, Brouillet and Achaz2012). This tool uses pairwise distance to automatically detect a ‘barcode gap’ and then clusters the sequences into hypothetical species (i.e., genetically homogeneous groups) based on a prior set maximum genetic species delimiter distance. The following values were used for the analysis: Pmin = 0.001, Pmax = 0.1, Steps = 10, X (relative gap width) = 1.5 and Kimura (K80) for distance calculation.
In addition, a genetic distance tree was constructed using the Neighbour Joining (NJ) method in MEGA 5.0 (Tamura et al., Reference Tamura, Peterson, Peterson, Stecher, Nei and Kumar2011) with 1000 bootstrap (BS) replicates. A COI sequence of Lycorma delicatula (Hemiptera, Fulgoridae) [GenBank: FJ456942.1] was used as outgroup.
PCR-RFLP analyses
Restriction enzymes were selected using in silico tests simulating cuts of the sequence of COI fragment with different enzymes available in the market via the New England Biolabs cutter version 2.0 (Vincze et al., Reference Vincze, Posfai and Roberts2003). Enzymes that generated polymorphic profiles among planthopper species were selected.
The selected enzymes were tested in 20 µl reactions from 100 to 200 ng of the amplified PCR product of the COI gene. Reaction conditions were those recommended by the manufacturer for each enzyme (New Enlgand Biolabs). Restriction products were analyzed by electrophoresis along with a molecular marker (MM) (100 bp DNA Ladder, Invitrogen, USA) in 2% agarose gels in 1× tris-borate-EDTA buffer at 50 V. Gels were stained with ethidium bromide and photographed under a ultraviolet transilluminator (Molecular Imager® Gel Doc™, BioRad, California, USA). Fragments smaller than 100 bp were not considered for classification as they showed low resolution in agarose gel.
Results
Identification of isogenic lines
Ten isogenic lines were obtained from the material collected in the field and identified as follows: three isogenic lines of D. kuscheli, three of Ch. haywardi, three of T. propinqua and one of P. tigrinus.
Most of the planthoppers (87%) with origin in different localities (Famaillá, Jesús María, Río Cuarto, Pergamino) and years (2008, 2009, 2010, 2011 and 2012) were grouped into four morphospecies. These morphospecies were identified as D. kuscheli, Ch. haywardi, T. propinqua and P. tigrinus by comparing their sequences with the ‘type sequences’ of the isogenic lines. Remaining specimens were taxonomically re-examined and identified as Dicranotropis fuscoterminata (n = 2), Chionomus balboae (n = 2) and Caenodelphax teapae (n = 1) (table 1).
COI gene amplification and sequencing
The COI fragments amplified in the different species were identical in size in the four primer combinations tested. Mix A amplified a fragment of approximately 880 bp in Ch. haywardi and in T. propinqua, although amplification with this combination was not efficient in P. tigrinus and D.kuscheli. Primer combination B amplified a fragment of about 470 bp in the four principal species, although spurious bands were observed. Primer combinations C and D amplified all the tested species efficiently. A fragment of about 1070 bp was obtained with mix D, whereas one of 540 bp was obtained with mix C. Finally, the D mix was selected for use as DNA barcode as it amplified the largest PRC product and therefore, more likely to find polymorphic sites for species identification.
The 1070 bp fragment was sent for sequencing and an 843 bp fragment was obtained after sequence edition, which was used as barcode. This fragment overlaps in 352 bp with the COI fragment proposed by Hebert et al. (Reference Hebert, Cywinska, Ball and deWaard2003) as DNA barcode for biological identification. This fragment showed identities between 98 and 83% with different planthopper sequences in GenBank: Metadelphax propinqua – synonym to Toya propinqua- [GenBank: HM233891.1, HM017486.1], C. teapae [GenBank: HM017471.1], Laodelphax striatellus [GenBank: FJ360695.1], Sogatella furcifera [GenBank: AB572344.1] and Nilaparvata lugens [GenBank: AB572311.1]. Sequences were also compared with the BOLD, in which similar identity values were observed (between 98.50 and 83.52%) with different planthopper genera and species. Sequences obtained in this work for C. teapae [GenBank: JX987318] were identified to species level using the option ‘Species level Barcode Record’ in BOLD, with 98.56% identity with previously recorded sequences for this specie.
Sequence analysis
Of the 843 bp sequence alignment, 569 sites were conserved, 274 were variable and of those 235 were parsimony informative. The sequences were A-T rich (~66%).
Twenty-three haplotypes were detected among the studied planthopper species (table 1). All the species exhibited at least two haplotypes, except for T. propinqua, which presented the same haplotype (‘Haplo 1’) in the different sampling localities and years (table 1).
The maximum intraspecific nucleotide distance observed was 0.72% between Haplo 5 and 7 of Ch. haywardi, and the average distance within species was 0.12%. (SD ± 0.17) (table 3). Interspecific divergence values ranged between 14.81 and 26.46%, with an average of 20, 79% (SD ± 2.32) (table 3).
Maximum intraspecific and minimum interspecific divergence based on Kimura-2-parameter model for planthopper species from corn production area of central Argentina.

Highlighted in light gray: intraspecific divergence values.
In bold: minimum interspecific divergence and maximum intraspecific divergence values.
‘–’ No haplotypes were recorded therefore no intraspecific variation was estimated.
C. teapae was the most genetically distant species, with divergence values between 20.21 and 26.46% with respect to the remaining species (table 3). By contrast, the most similar species were Ch. balboae and D. fuscoterminata, with the lowest interspecific divergence value (14.81%) (table 3). This divergence value was even lower than with Ch. haywardi (15.54%), a species of the same genus. Maximum intraspecific divergence was 0.72% between haplotypes ‘Haplo 5’ and ‘Haplo 7’ of Ch. haywardi (table 3).
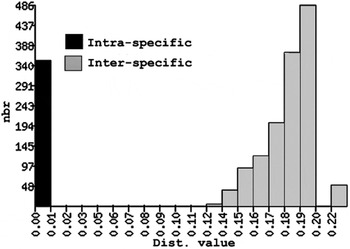
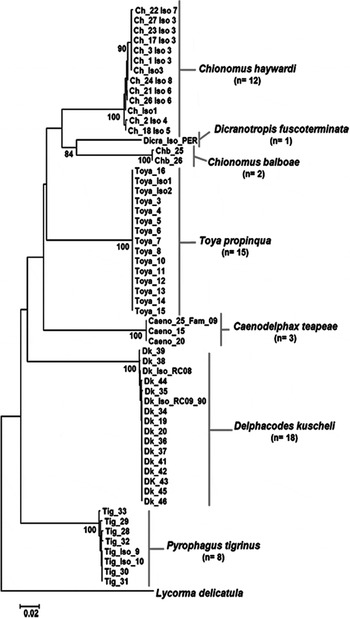
The analysis performed using ABGD showed a major barcode gap between distances of 1 and 12% (fig. 1). In the recursive partition, the haplotypes were classified in seven genetically different groups based on a prior maximal distance of 0.77%. Specimen affiliation in each of the seven ABGD species clusters were identical to the well supported (100% BS) species clades reported in the NJ tree (fig. 2).
Frequency histogram of intra and interspecific genetic distances calculated with Automatic Barcode Gap Discovery (ABGD) for cytochrome c oxidase I (COI) sequences of delphacid species of corn production area from central Argentina.

Neighbour joining analysis of different haplotypes of cytochrome c oxidase I (COI) gene sequences from planthoppers of central Argentina. Numbers above branches are 1000X bootstrap values.

Selection of restriction enzymes for RFLP
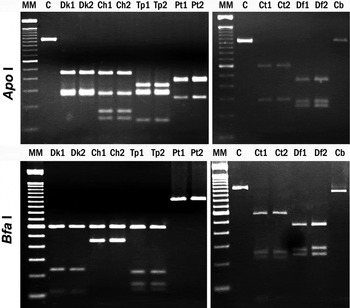
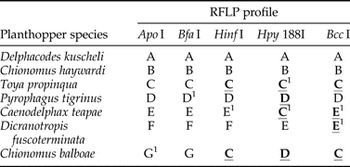
Two enzymes were selected, based in in silico analysis, which generated differential restriction profiles among all the species: Apo I and Bfa I (fig. 3; table 4). These enzymes were tested in reactions and the expected profiles were obtained according to the in silico analysis. RFLP profiles unique to each species were not affected by presence of haplotype variation detected within the species (fig. 3). Three other restriction enzymes that generate differential profiles among the four most common species endemic area of MRCV (D. kuscheli, Ch. Haywardi, T. propinqua, P. tigrinus) were selected: Hinf I, Hpy 188I and Bcc I. Although some of the profiles obtained with these later restriction enzymes, were repeated with patterns of the less frequent species (C. teapae, Ch. balboae, D. fuscoterminata) (table 4).
Restriction fragment length polymorphism (RFLP) profile of cytochrome c oxidase I (COI) gene from most common planthopper species of central Argentina with restriction enzymes Apo I and Bfa I. Dk 1-2: Delphacodes kuscheli, Ch 1-2: Chionomus haywardi, Tp 1-2: Toya propinqua, Pt 1-2: Pyrophagus tigrinus, Ct 1-2: Caenodelphax teapae, Df 1-2: Dicranotropis fuscoterminata, Cb: Ch. balboae, C: Control (original COI fragment with no restriction), MM: 100 bp DNA ladder (fragment sizes: 100, 200, 300, 400, 500, 600, 700, 800, 900, 1000, 1100, 1200, 1300, 1400, 1500, 2072 bp).

Profile groups produced by different restriction fragment length polymorphism (RFLP) analysis of cytochrome c oxidase I (COI) gene from planthoppers from central Argentina.

Underlined and highlighted in bold: repeated RFLP profiles between species.
1 Uncut fragment.
Discussion
One of the advantages of using mitochondrial genes as molecular marker in insects is that those genes have highly conserved regions and therefore can be amplified with universal primers (Simon et al., Reference Simon, Frati, Beckenbach, Crespi, Liu and Flook1994; Lunt et al., Reference Lunt, Zhang, Szymura and Hewitt1996). In this study, different primers published for Hemiptera were tested with the aim of selecting an effective combination for the different planthopper vector species present in central Argentina. Primer combination D was selected because it amplified the largest fragment (1070 bp) efficiently in all the studied species. This amplification product presented the same size in all the tested species, which is an expected result considering that the size of mitochondrial genes is deeply conserved in insects (Lunt et al., Reference Lunt, Zhang, Szymura and Hewitt1996). Once the fragment was sequenced and edited, an 843 bp sequence was obtained and then implemented as DNA barcode for the studied species. This fragment is longer than the standard DNA barcode region proposed by Hebert et al. (Reference Hebert, Cywinska, Ball and deWaard2003) for fauna and overlaps in 365 bp with that standard region.
Regarding the variability of this fragment, the average intraspecific divergence was low (0.12%) with respect to results reported for other insect groups: 0.36% for aphid parasitoids (Hymenoptera) in China (Zhou et al., Reference Zhou, Xi, Yu, Zhang, Li, Liu, Niu, Zhu, Qiao and Zhang2014), 0.80% for species of the genus Spodoptera of Lepidoptera in Florida (USA) (Nagoshi et al., Reference Nagoshi, Brambila and Meagher2011), 1.39% for the genus Epitrix (Coleoptera) in Europe and North America (Germain et al., Reference Germain, Chatot, Meusnier, Artige, Rasplus and Cruaud2013), 1.60% in sandfly species (Diptera) in Colombia (Contreras Gutiérrez et al., Reference Contreras Gutiérrez, Vivero, Vélez, Porter and Uribe2014), and 3.14% for aphid species of the genus Toxoptera (Hemiptera) in China (Wang & Qiao, Reference Wang and Qiao2009). This expected low intraspecific variability may be explained by the restricted geographic area included in the present study (corn production area of central Argentina). In this sense, Bergsten et al. (Reference Bergsten, Bilton, Fujisawa, Elliott, Monaghan, Balke, Hendrich, Geijer, Herrmann, Foster, Ribera, Nilsson, Barraclough and Vogler2012) showed that increasing the geographic scale, also increases the intraspecific variation. Likewise, same authors emphasize the importance of regional and national projects of barcoding for greater accuracy of DNA barcoding for species identification.
The low intraspecific variability observed might also be explained by the sample size, although the necessary ‘n’ for characterizing genetic variability of a species varies widely among species (Zhang et al., Reference Zhang, He, Crozier, Muster and Zhu2010). For example, in this work, six and seven haplotypes were detected for D. kuscheli with n = 18 and Ch. haywardi with n = 13, respectively, whereas a single haplotype was found for T. propinqua with a n = 15 (table 1).
Surprisingly, only one haplotype was observed for T. propinqua among samples from the different localities and years. In some cases, haplotype diversity of mitochondrial genes is associated with the presence of endosymbionts such as Wolbachia. The presence of this endosymbiont can reduce maternal genetic diversity of the host (Shoemaker et al., Reference Shoemaker, Dyer, Ahrens, McAbee and Jaenike2004; Hurst & Jiggins, Reference Hurst and Jiggins2005; Sun et al., Reference Sun, Xiao, Cook, Feng and Huang2011). For T. propinqua, 100% of infection with the same Wolbachia strain has been reported for different populations from the maize production area in central Argentina (Argüello Caro et al., Reference Argüello Caro, Mattio, Alemandri and Truol2011). Therefore, the bias observed in haplotype diversity of T. propinqua might be associated with a selection driven by the presence of the endosymbiont.
A high interspecific variability was observed between the seven studied species (table 3). This could be explained by the diversity of genera present in the corn production area of central Argentina. The lowest interspecific divergence value was detected between haplotypes of Ch. balboae and D. fuscoterminata (14.81%). This lowest value observed between Ch. balboae and a species of another genus, was even lower than with Ch. haywardi (15.54%), a species of the same genus (table 3). This may be because the COI gene is subjected to a high rate of base saturation resulting in homoplasy of systematic relationships above the species level. In particular for tribe Delphacini, Dijkstra et al. (Reference Dijkstra, Rubio and Rory2003) reported that the COI gene is not useful for resolving relationships between most genera within the tribe Delphacini.
Among the studied species, the minimum interspecific variability was 14.81%, whereas maximum intraspecific variation was 0.72% (table 3). These variations determined a major DNA barcode gap, where intra and interspecific divergences never overlap (fig. 1). This major DNA barcode gap observed for the seven studied species could explain the efficiency of DNA barcodes for identification of planthoppers species from central Argentina.
Finally, two restriction enzymes were selected, which generate differential profiles among the seven species: Bfa I and Apo I (fig. 3, table 4). When these enzymes are used for identification, it should be considered that point mutations can alter the restriction sites, generating different profiles from the expected ones or, rather, lead to erroneous identifications. For this reason, if a nonspecific profile was obtained, digestions with both enzymes could be performed or, rather, the segment of the COI gene could be sequenced to confirm sample identity.
In turn, other three restriction enzymes (Hinf I, Hpy 188I, Bcc I) performed polymorphic profiles among the most common planthopper species from central Argentina (D. kuscheli, Ch. haywardi, T. propinqua, P. tigrinus), although some of these profiles were repeated with less frequent species (C. teapae, Ch. balboae, D. fuscoterminata) (table 4). Even though these enzymes only differentiate the most frequent species, a combination of two or more enzymes can be used to separate species that presents the same patterns.
Although adults were used in the tests, both techniques (COI gene sequencing and RFLP) can be applied to identify juvenile stages. In such a case, it would be possible to determine species of nymphs collected in the field with no need of relying on adult development for identification. Several works have successfully compared molecular identification of juvenile stages with their respective adult stages (Germain et al., Reference Germain, Chatot, Meusnier, Artige, Rasplus and Cruaud2013; Gopurenko et al., Reference Gopurenko, Fletcher, Löcker and Mitchell2013; Wang et al., Reference Wang, Li, Zhang, Varadínová, Jiang, Kucerová, Stejskal, Opit, Cao and Li2014). Similarly, identification of morphologically indistinct adult females could be more precise using these molecular techniques.
The results obtained in the present study showed consistency between the morphological and the molecular identification approach of different planthopper species. This indicates that both sequencing of the COI gene and digestion of this PCR product with restriction enzymes by RFLP are efficient tools for the identification of the most frequent planthoppers from central Argentina. These novel and practical tools are oriented for aiding non-experts in traditional morphological identification. Moreover, the developed protocols are especially useful in the classification of female and nymphs, for which there are no taxonomic keys available. Finally, identification via RFLP is a rapid and cost-effective tool, mainly for field samplings which require processing of a large number of samples.
Acknowledgements
This work was supported by research projects PE AEPV 214032 from Instituto Nacional de Tecnología Agropecuaria (INTA) and Fundación ArgenINTA. EBAC and ADD hold doctoral fellowships from the Consejo Nacional de Investigaciones Científicas y Técnicas (CONICET). The authors thank Ana María Marino de Remes Lenicov from the Entomology Division of Facultad de Ciencias Naturales y Museo de La Plata (FCNyM-UNLP) for planthopper identification. They want to especially thank Franco Fernández for his helpful guidance on RFLPs and Gastón Vaghi Medina for his advice in phylogenetic analysis. The authors also want to thank Paola López Lambertini and Humberto Debat for the critical reading and contributions made to the manuscript.