1 Introduction
From the mid 90s, user simulation has become an important area of research in the field of spoken dialogue systems (SDSs) because collecting and annotating real human–machine interactions is often expensive and time-consuming (Eckert et al., Reference Eckert, Levin and Pieraccini1997; Zukerman & Albrecht, Reference Zukerman and Albrecht2001; Cuayahuitl et al., Reference Cuayahuitl, Renals, Lemon and Shimodaira2005; Georgila et al., Reference Georgila, Henderson and Lemon2005; Pietquin, Reference Pietquin2006; Schatzmann et al., Reference Schatzmann, Thomson and Young2007b; Janarthanam & Lemon, Reference Janarthanam and Lemon2009b; Pietquin et al., Reference Pietquin, Rossignol and Ianotto2009). Such data are generally required for designing, training and assessing dialogue systems (Levin et al., Reference Levin, Pieraccini and Eckert2000; Scheffler & Young, Reference Scheffler and Young2001; López-Cózar et al., Reference López-Cózar, de la Torre, Segura and Rubio2003; Pietquin & Dutoit, Reference Pietquin and Dutoit2006; Schatzmann et al., Reference Schatzmann, Thomson, Weilhammer, Ye and Young2007a). Especially, when using machine learning methods for optimizing dialogue management strategies such as Reinforcement Learning (RL) (Sutton & Barto, Reference Sutton and Barto1998; Frampton & Lemon, Reference Frampton and Lemon2010), the amount of data necessary for training is larger than existing corpora. In particular, it is important for methods such as RL to be able to explore the entire possible state space, including all the user responses that the system might have to deal with but that do not occur in the training data. Indeed, exploring the whole dialogue state space and strategy space requires a number of interactions that increases exponentially with the number of states. Furthermore, even simple dialogue systems have continuous state spaces because of the inclusion of speech recognition and understanding confidence levels into the state description. User simulation (sometimes referred to as user modelling)Footnote 1 is, therefore, necessary to expand data sets. The general goal of a user simulation is thus to produce as many as necessary natural, varied and consistent interactions from as little data as possible. The quality of the user simulation is, therefore, of crucial importance because it dramatically influences the results in terms of SDS performance analysis and learnt strategy (Schatzmann et al., Reference Schatzmann, Stuttle, Weilhammer and Young2005b). Assessment of the quality of simulated dialogues and user simulation methods is an open issue and, although assessment metrics are required, there is no commonly adopted metric (Schatzmann et al., Reference Schatzmann, Georgila and Young2005a; Georgila et al., Reference Georgila, Henderson and Lemon2006).
Previous publications include Frampton and Lemon (Reference Frampton and Lemon2010) who give a summary of RL methodology for dialogue management and Schatzmann et al. (Reference Schatzmann, Weilhammer, Stuttle and Young2006) who give an overview of statistical user simulation techniques. This paper complements these publications by providing a survey of user simulation metrics. In this paper, we will first define a list of desired features of a good user simulation metric. Second, state-of-the-art metrics described in the literature are presented in Section 3. A new metric based on Inverse RL (IRL) is discussed in Section 4 and finally, a discussion of all metrics is provided in Section 5.
2 Desired features
Although several theoretical and experimental comparisons of user simulation metrics can be found in the literature (Zukerman & Albrecht, Reference Zukerman and Albrecht2001; Schatzmann et al., Reference Schatzmann, Georgila and Young2005a, Reference Schatzmann, Weilhammer, Stuttle and Young2006), none of these papers provide a list of desired features for a good user simulation metric. In this section, such a list is provided and will be used to judge the metrics described in the rest of the paper.
In order to do so, it is necessary to provide a clear idea of the purpose of a user simulation. User simulation is required to expand data sets used for training RL-based dialogue managers (Levin et al., Reference Levin, Pieraccini and Eckert1997; Singh et al., Reference Singh, Kearns, Litman and Walker1999; Scheffler & Young, Reference Scheffler and Young2001; Pietquin, Reference Pietquin2004; Williams et al., Reference Williams, Poupart and Young2005) and natural language generation systems (Janarthanam & Lemon, Reference Janarthanam and Lemon2009a, Reference Janarthanam and Lemon2009b, Reference Janarthanam and Lemon2009c). This provides at least two requirements for the user simulation evaluation metric: it should assess how well the simulation fits the original data statistics (consistency) and it should result in efficient strategies when used for training RL-based systems (quality of learnt strategy). An efficient user simulation should not only reproduce the statistical distribution of dialogue acts measured in the data but should also reproduce complete dialogue structures. The optimal metric should, therefore, measure the ability of the user simulation to generate consistent sequences of dialogue acts.
User simulation can also be used to assess the quality of an SDS, regardless of the method used to design its management strategy (e.g. machine learning, rule-based or hand-crafted policies; Eckert et al., Reference Eckert, Levin and Pieraccini1997; Walker et al., Reference Walker, Litman, Kamm and Abella1997b; Scheffler & Young, Reference Scheffler and Young2001; López-Cózar et al., Reference López-Cózar, de la Torre, Segura and Rubio2003). A good user simulation metric should, therefore, predict how well it can be used to predict the performance of an SDS (which may be different from the one used to collect data) when interacting with real users (performance prediction).
Another goal of user simulation is to expand existing data sets. It is, therefore, important to measure the capability of the user simulation to generate unseen dialogues (generalization).
Ideally, the metric should allow ranking of different user simulation methods. Practically, it should, therefore, be a scalar metric or such a scalar number should be computable from the metric. As a side effect, a scalar metric could be used as an optimization criterion to use statistical methods applied to parameter search for user simulation.
There are many application domains where spoken dialogue can be useful. The metric should, therefore, be task independent and should apply to any domain (task independence). The metric should also be independent of the dialogue management system used. Even if the task is similar, the SDS can be different and the user simulation evaluation metric should not be affected.
Finally, the metric should of course be automatically computed from objective measures and should not require any external human intervention.
To summarise, an evaluation metric for user simulation should be able to:
• measure statistical consistency of generated dialogue acts with data (consistency);
• measure the ability to generate consistent sequences of dialogue acts (consistent sequences);
• assess the quality of learnt strategies when the user simulation is used to train a machine-learning-dialogue management system (quality of learnt strategy);
• predict the performance of an SDS with real users (performance prediction);
• measure the generalization capabilities of the method (generalization);
• compute a scalar value to rank and optimize user simulation (ranking and optimization criteria);
• evaluate user simulation independently from the task and the SDS (task independence);
• automatically compute an assessment measure from objective information (automatic computation).
Ideally, a good metric should also correlate well with human evaluation metrics but this is hard to predict. Of course, some of these criteria are more important than others and some weighting should be taken into account when designing a metric. Yet, these criteria will be used as a framework for describing state-of-the-art metrics, and will help identify where these metrics are lacking, providing new avenues of research for designing optimal metrics.
3 State-of-the-art metrics for evaluating user simulations
In this section, the state of the art in user simulation evaluation is provided, reflecting the most frequently used evaluation methods in the literature of the last decade. There are many ways to cluster these methods. In Zukerman and Albrecht (Reference Zukerman and Albrecht2001) and Schatzmann et al. (Reference Schatzmann, Weilhammer, Stuttle and Young2006), the authors distinguish two categoriesFootnote 2: direct methods that assess the user simulation by testing the quality of its predictions (e.g. precision and recall) and indirect methods that evaluate the performance of strategies learned from the different models (e.g. utility). We will take a different approach, splitting methods into local methods, which measure turn-level statistics (e.g. frequency of dialogue act types), and global methods, which measure dialogue-level statistics (e.g. task completion, perplexity).
3.1 Turn-level metrics
A large number of early metrics are based on turn-level context and measure local consistency of generated data and data from real users (Schatzmann et al., Reference Schatzmann, Georgila and Young2005a). Some turn-level metrics are useful to analyze the dialogues in terms of dialogue style or user initiative and cooperativeness. They can take the form of distributions or of a set of scalar measures. They all share one major drawback of failing to measure the consistency of sequences of dialogue acts. F-measure and the Kullback–Leibler (KL) divergence provide a single scalar measure; however, they cannot be used to assess the generalization capabilities of a model (see Sections 3.1.3 and 3.1.2). We will discuss each of these turn-level metrics in detail below.
3.1.1 Dialogue act statistics
As a human–machine dialogue can be considered as a sequence of dialogue acts uttered in turn by the human user and the dialogue manager, it is natural to compare statistics related to dialogue acts used in real and simulated dialogues. In a goal-driven dialogue, the dialogue acts can be open questions, closed questions, implicit or explicit confirmations but also greetings and dialogue closures. The first set of metrics that compares real and simulated dialogues is the measure of the relative frequency of each of the dialogue acts (Pietquin, Reference Pietquin2004; Schatzmann et al., Reference Schatzmann, Georgila and Young2005a). This provides a histogram of dialogue act frequencies for each data set (real and simulated). It allows for comparison of dialogue styles, for example, are there more or less confirmations or open questions in one of the data sets.
Schatzmann et al. (Reference Schatzmann, Georgila and Young2005a) propose other statistics related to dialogue acts such as:
• the ratio of user and system acts, which is a measure of the user participation;
• the ratio of goal-directed actions vs. grounding actions vs. dialogue formalities vs. misunderstandings;
• the proportion of slot values provided when requested, which is a measure of the user cooperativeness.
When comparing the above-mentioned metrics with respect to the desired features listed in Section 2, one can see that these metrics allow for comparison of similarities with actual data but have several shortcomings. They do not provide a single scalar measure for ranking models and it is difficult to use them to predict performance of an SDS when used with real users. Finally, generalization is also difficult to assess.
3.1.2 Precision, Recall, (Expected) Accuracy
Precision and Recall are common measures in machine learning and information retrieval and measure how well a model predicts observed values. A user model can be considered as a predictor of a dialogue act given some context (which can be more or less rich) (Zukerman & Albrecht, Reference Zukerman and Albrecht2001). Similar metrics, adapted from user modelling literature (Schatzmann et al., Reference Schatzmann, Georgila and Young2005a), are widely used in user simulation and even outside the realm of SDSs. Precision and Recall are here defined as
 $$\displaylines{ & {\rm{Precision\!\!:}}\,P\, = \,100\,\times \,\frac{{{\rm{Correctly}}\;{\rm{predicted}}\;{\rm{actions}}}}{{{\rm{All}}\;{\rm{actions}}\;{\rm{in}}\;{\rm{simulated}}\;{\rm{response}}}} \cr \; \; \cr {\rm{Recall\!\!:}}\,R\, = \,100\,\times \,\frac{{{\rm{Correctly}}\;{\rm{predicted}}\;{\rm{actions}}}}{{{\rm{All}}\;{\rm{actions}}\;{\rm{in}}\;{\rm{real}}\;{\rm{response}}}} \cr}$$
These two measures are complementary and cannot be used individually to rank user simulation methods. However, the classical balanced F-measure (van Rijsbergen, Reference van Rijsbergen1979) can be used to combine both these measures and obtain a single scalar:
 $$F\, = \,\frac{{2PR}}{{P\, + \,R}}$$
Other related metrics are Accuracy and Expected Accuracy as first introduced in Zukerman and Albrecht (Reference Zukerman and Albrecht2001) and adapted by Georgila et al. (Reference Georgila, Henderson and Lemon2006):
• Accuracy: ‘percentage of times the event that actually occurred was predicted with the highest probability’.
• Expected accuracy: ‘Average of the probabilities with which the event that actually occurred was predicted’.
One of the major drawbacks of these metrics is that they do not measure the generalization capabilities of the user simulation. In fact, these metrics actually penalize attempts to generalize since when the model generates unseen dialogues, their scores are lower.
3.1.3 Kullback–Leibler divergence and dissimilarity
In Section 3.1.1, metrics based on frequencies of dialogue acts have been defined. Histograms of frequencies are obtained for both the simulated data and the human–machine data. One way to obtain a single scalar value from these histograms is to compute a statistical distance between the distributions they represent. Several statistical distances are available but a common choice is the KL divergence (Kullback & Leiber, Reference Kullback and Leiber1951). The KL divergence between two distributions P and Q is defined by
 $${{D}_{KL}}(P||Q)\, = \,\mathop{\sum}\limits_{i\, = \,1}^M {{p}_i}\,{\rm{log}}\left( {\frac{{{{p}_i}}}{{{{q}_i}}}} \right)$$
where pi (resp. qi) is the frequency of dialogue act ai in the histogram of distribution P (resp. Q). Actually, the KL divergence is not a distance since it is not symmetric  $$\[--><$> ({{D}_{KL}}(P||Q)\, \ne \,{{D}_{KL}}(Q||P)) <$><!--$$. To remedy this defect, the dissimilarity metric
 $$\[--><$> DS(P||Q) <$><!--$$ is introduced:
 $$DS(P||Q)\, = \,\frac{{{{D}_{KL}}(P||Q)\, + \,{{D}_{KL}}(Q||P)}}{2}$$
The KL divergence does have some drawbacks. It is an unbounded metric, which is difficult to use for ranking. In addition, there is an unbalanced penalty between the estimation of the mean and the variance of the distributions. To be specific, it gives more importance to the similarity of the means of these two distributions than to the variances. Therefore, two distributions having the same means but very different variances will appear to be closer to each other than two distributions having slightly different means but similar variances. This is particularly prevalent for spoken dialogue applications. KL divergence also requires a correct estimation of densities P and Q while traditionally only counts are available from data. It is also difficult to assess the generalization capabilities of a user model with this metric since it penalizes dialogue strategies, which are different from the real data. In Section 3.3, we discuss new applications of the KL divergence that seek to resolve these last two issues.
3.2 Dialogue-level metrics
In this section, metrics are presented that use higher-level information. They are based on complete dialogue properties instead of local turn information. Most of the metrics discussed in this section have been developed more recently than the turn-level metrics and attempt to achieve the goals listed in Section 2.
3.2.1 Task completion
A task-driven dialogue system assists a user in achieving a goal that is usually not known by the system before the interaction starts. The degree of achievement of this goal is referred to as task completion. Commonly used to measure inter-annotation agreement, the κ coefficient can also be used to measure task completion. The κ coefficient (Carletta, Reference Carletta1996) is obtained from a confusion matrix M summarizing how well the transfer of information performed between the user and the system. M is a square matrix of dimension n (number of pieces of information that have to be transmitted from the user to the system) where each element mij is the number of dialogues in which the value i was interpreted while value j was meant. The κ coefficient is then defined as
 $$\kappa \, = \,\frac{{P(A){\rm{ - }}P(E)}}{{1{\rm{ - }}P(E)}}$$
where P(A) is the proportion of correct interpretations (sum of the diagonal elements of M (mii) on the total number of dialogues) and P(E) is the proportion of correct interpretations occurring by chance. One can see that κ = 1 when the system performs perfect interpretation (P(A) = 1) and κ = 0 when the only correct interpretations were obtained by chance (P(A) = P(E)). Other task completion measures can be defined such as in Pietquin (Reference Pietquin2004).
To assess the similarity between artificially generated dialogues and human–machine dialogues, it is legitimate to measure the similarity in terms of task completion. In Scheffler and Young (Reference Scheffler and Young2001), Schatzmann et al. (Reference Schatzmann, Georgila and Young2005a) and Pietquin (Reference Pietquin2004), the task completion or the task completion rate (ratio of successful dialogues) is used to compare dialogues. In Schatzmann et al. (Reference Schatzmann, Georgila and Young2005a), the authors also propose to use the completion time, that is the number of turns (or the actual dialogue duration) required to achieve a satisfying task completion.
Once again, capturing task completion involves several different metrics (task completion, rate, duration) and each of them provides different information. It is difficult to chose one of them for ranking user models. They cannot be used independently since two corpora sharing a same task completion rate may not contain similar dialogues. In addition, the completion time does not guarantee dialogue similarity.
3.2.2 Perplexity and log-likelihood
Perplexity is a measure that comes from information theory and was first proposed as a user simulation metric in (Georgila et al., Reference Georgila, Henderson and Lemon2006). It is generally used to compare probabilistic predictive models. In natural language processing, it is widely used to compare language models. Perplexity of a model is defined as follows:
 $$PP\, = \,{{2}^{\mathop{\sum}\limits_{i\, = \,0}^N \frac{1}{N}{\log }_2 \,{{p}_m}({{x}_i})}} $$
where pm(xi) is the probability of xi given the model, and xi is a sample from a test data set containing N samples. If the model is good, it will tend to give high probabilities to the test samples since it is supposed to predict them and, therefore, have a low perplexity. In the case of a user model, the data to be predicted are sequences of dialogue acts {a 0, a 1, …, an} so pm(x) = pm(a 0, a 1, …, an) is the probability of a sequence of dialogue acts given the user model.
A similar metric is the log-likelihood  $$\[--><$> {\scr L}(x) <$><!--$$ of a data set
 $$\[--><$> x\, = \,{{\{ {{x}_i}\} }_{i\, = \,1,\, \ldots, \,N}} <$><!--$$ given a model m is defined by
 $$\[--><$> {\scr L}(x)\, = \,\log \,p(x|m)\, = \,\log \,{{p}_m}(x) <$><!--$$. If the data samples xi are assumed to be independent (a common assumption),
 $$\[--><$> {\scr L}(x) <$><!--$$ can be written as
 $${\scr L}(x)\, = \,\log \prod\limits_{i\, = \,1}^N {{p}_m}({{x}_i})\, = \,\mathop{\sum}\limits_{i\, = \,1}^N \log \,{{p}_m}({{x}_i})$$
The higher the log-likelihood is, the higher the consistency between the data and the model.
Perplexity and log-likelihood measure how well a model is able to predict data in a held-out test set and therefore can be used to measure generalization. Perplexity and log-likelihood are scalar numbers that can be used to rank user simulations, however, the perplexity figure can be difficult to interpret as it ranges from 1 to infinity. These metrics can be viewed as global or dialogue-level metrics as they are based on the probability of sequences of dialogue acts. However, it is somewhat difficult to assign relative importance of dialogue-level features such as dialogue length and task completion.
3.2.3 Hidden Markov Model similarity
One particular statistical model that can be used to predict sequences of dialogue acts (or dialogue states) is the Hidden Markov Model (HMM). In Cuayahuitl et al. (Reference Cuayahuitl, Renals, Lemon and Shimodaira2005), the authors propose to train a HMM on a corpus of real human–machine dialogues (the hidden state is the dialogue state, whereas the observations are dialogue acts) and to use the HMM as a generative model to produce artificially generated data. To assess the quality of the model, the authors propose to generate a corpus of artificial data using the trained HMM and then to train a new HMM on these generated data. The metric proposed to assess the model is the distance between the HMM trained on real data and the one trained on artificially generated data. Computing a distance between HMMs is not an easy problem. In Cuayahuitl et al. (Reference Cuayahuitl, Renals, Lemon and Shimodaira2005), the authors choose to use the dissimilarity introduced in Section 3.1.3 based on the KL divergence of distributions encoded by the two HMMs.
This evaluation method does not directly measure the dissimilarity between corpora but instead it measures the dissimilarity of the models by computing a distance between distributions encoded by the models. One can, therefore, assume that the measure captures more than what is in the data and that unseen situations can be taken into account (though this has not been experimentally demonstrated by Cuayahuitl et al., (Reference Cuayahuitl, Renals, Lemon and Shimodaira2005)). This metric could be used regardless of the user model, as the artificially generated data can be produced by any model and not only by HMM-based models. It provides a single scalar, however, it does not directly provide any information about the quality of the interaction between real users and a new dialogue system.
3.2.4 Cramér-von Mises divergence
In many applications, a user model for simulation can be used as a predictor of the performance of an SDS. In Williams (Reference Williams2008), the author describes a metric based on this point of view and built upon the following statements:
1. ‘For a given dialogue system D and a given user population U 0, the goal of a user simulation U 1 is to accurately predict the performance of D when it is used by U 0’.
2. ‘The performance of a dialogue system D in a particular dialogue d (i ) can be expressed as a single real-valued score x (i ), computed by a scoring function
 $$\[--><$>Q({{d}_{(i)}})\, = \,{{x}_{(i)}}<$><!--$$’.
3. ‘A given user population U 0 will yield a set of scores
$$\[--><$> {{S}_0}\, = \,x_{{(1)}}^{0}, x_{{(2)}}^{0}, \, \ldots, \,x_{{({{N}_0})}}^{0} <$><!--$$. Similarly, a user simulation U 1 will yield a set of scores $$\[--><$> {{S}_1}\, = \,x_{{(1)}}^{1}, x_{{(2)}}^{1}, \ldots, \,x_{{({{N}_1})}}^{1} <$><!--$$’.4. ‘A user simulation U 1 may be evaluated by computing a real-valued divergence
$$\[--><$> D({{S}_0}||{{S}_1}) <$><!--$$’.


The proposed metric is thus a divergence measure that expresses how well the distribution of scores obtained by the real users S 0 is reproduced by the user simulation S 1. This divergence could have been the KL divergence described in Section 3.1.3 but the author argues that this metric is accurate only if actual distributions are known or well approximated. This is rarely the case, he argues, in the field of dialogue systems where data are tricky to obtain and usually low amounts of data are available. The normalized Cramér-von Mises divergence (Cramer, Reference Cramer1928; Anderson, Reference Anderson1962) is less demanding in this respect because it is based on the empirical distribution function (EDF) that does not make any assumptions about the distribution of data. It provides a real number ranging from 0 to 1 and is computed as follows:
 $${{D}_{CvM}}({{F}_0}||{{F}_1})\, = \,\alpha \sqrt {\mathop{\sum}\limits_{i\, = \,1}^{{{N}_0}} {{{({{F}_0}(x_{{(i)}}^{0} ){\rm{ - }}{{F}_1}(x_{{(i)}}^{0} ))}}^2} } $$
where Fj is the EDF of the data  $$\[--><$> {{S}_j}\, = \,(x_{{(1)}}^{j}, x_{{({{N}_j})}}^{j} ) <$><!--$$ and α is a normalizing constant given by
 $$\[--><$> \alpha \, = \,\sqrt {\frac{{12{{N}_0}}}{{4N_{0}^{2} {\rm{ - }}1}}} <$><!--$$. By definition, the EDF is
 $${{F}_j}(x)\, = \,\frac{1}{{{{N}_j}}}\mathop{\sum}\limits_{i\, = \,1}^{{{N}_j}} \left\{ {\matrix { 1 \hfill & {\:{\rm if}\;\:x_{{(i)}}^{j} \, \lt \,x} \hfill \cr {\frac{1}{2}} \hfill & {\:{\rm if}\;\:x_{{(i)}}^{j} = \,x} \hfill \cr 0 \hfill & {\:{\rm if}\;\:x_{{(i)}}^{j} \, \gt \,x} \hfill \\\end{}} \right$$
This metric addresses many of the desired features listed in Section 2, as it provides a bounded scalar value usable for ranking; it is a global feature that also predicts the performance of a dialogue system. Since it is based on scores, it is not sensitive to unseen situations given that they result in similar scores. This does not mean that the generalization capabilities of the model are assessed but that they do not result in a reduction of the metric value. One drawback of this metric is that it does not measure the degree of similarity of sequences of dialogue acts and, therefore, dialogues may not be realistic even for high values of the metric.
3.2.5 Bilingual Evaluation Understudy and Discourse-Bilingual Evaluation Understudy
The bleu (Bilingual Evaluation Understudy) score (Papineni et al., Reference Papineni, Roukos, Ward and Zhu2002) is widely used in machine translation. It is a metric that compares two semantically equivalent sentences. Generally, it is used to compare an automatically translated sentence to several reference sentences generated in the target language by human experts. Papineni et al. (Reference Papineni, Roukos, Ward and Zhu2002) argue that ‘the closer a machine translation is to a professional human translation, the better it is’. The bleu score is the geometric mean of the N-gram precisions with a brevity penalty (BP). It is computed as follows: let C be a corpus of human-authored utterances and S be a translation candidate. First, a precision score is computed for each N-gram:
 $${{p}_n}\, = \,\frac{{\mathop{\sum}\limits_{S \in C} {\mathop{\sum}\limits_{ngram \in S} {coun{{t}_{matched}}(ngrams)} } }}{{\mathop{\sum}\limits_{S \in C} {\mathop{\sum}\limits_{ngram \in S} {count(ngrams)} } }}$$
where countmatched (ngrams) is the number of ngrams in S that match the N-grams in the corpus. The BP is defined as
 $$BP\, = \,\left\{ {\matrix { {1\,\,{\rm if}\ g\, \gt \,r} \hfill \cr {e(1{\rm{ - }}r/g)\ {\rm if}\,g\,\leqslant \,r} \hfill \\\end{}} \right$$
where g is the length of the generated utterance while r is the length of the reference. Finally, the bleu score is computed as
 $${\rm{\sc {bleu}}}\, = \,B{{P}^{\left( {\mathop{\sum}\limits_{n\, = \,1}^N \frac{1}{N}\log \,{{p}_n}} \right)}} $$
Using the BP, bleu penalizes abnormally short utterances because short-generated utterances have higher N-gram precision.
Jung et al. (Reference Jung, Lee, Kim, Jeong and Lee2009) propose to use the same metric to compare a sentence automatically generated by a user simulation and sentences produced by human experts or available in the training data. It is indeed the same task since in both cases the problem is to compare surface realizations of a semantic target. The bleu measure can, therefore, be used to measure the naturalness of a given utterance.
As described above, the bleu metric can be used to measure the naturalness of a simulated utterance but what we are interested in is a measure of naturalness of dialogues (that is a sequence of utterances). To achieve this goal, Jung et al. (Reference Jung, Lee, Kim, Jeong and Lee2009) propose another metric they call Discourse-bleu (d-bleu). It is designed to measure the similarity of simulated dialogue and human–machine dialogues. d-bleu is also the geometric mean of the N-gram precisions with a BP but the N-grams considered here are not sequences of words but sequences of intentions (both user and system intentions). d-bleu is, therefore, computed in the same way as bleu by replacing words by intentions. d-bleu score ranges from 0 to 1 and gives higher scores to similar dialogues (especially if they have the same length).
The bleu score is known to be highly correlated with human judgement Papineni et al. (Reference Papineni, Roukos, Ward and Zhu2002), Doddington (Reference Doddington2002) and Jung et al. (Reference Jung, Lee, Kim, Jeong and Lee2009) argue that d-bleu also follows the same tendencies as human judgement. In some cases, bleu has been reported to fail to predict translation improvements and naturalness. Too few studies are reported about the d-bleu score for dialogue to allow one to draw the same conclusions, however, the bleu and d-bleu are quite similar in their definitions. Once again, this metric also fails to measure the generalization capabilities of the user simulation.
3.2.6 Simulated User Pragmatic Error Rate
super (Simulated User Pragmatic Error Rate; Rieser & Lemon, Reference Rieser and Lemon2006a; Rieser, Reference Rieser2008) is an attempt to combine different metrics so as to take advantage of their respective features. The aim of super is to measure the naturalness and variety of artificially generated dialogues. Naturalness is actually measured as a mix of completeness and consistency (defined below). It is based on the three following statements:
• The simulated user should not produce intentions that real users would not produce in the same context. It should not create insertions (I) of intentions. This relates to consistency.
• The intentions generated by the simulated user should cover the whole range of intentions generated by real users. It should not create deletions (D) of intentions. This relates to completeness.
• The user should generalize and produce a sufficient variety (V) of behaviours and not reproduce exactly the real users’ behaviour. A lower bound ε is defined to reflect the desired variation and an upper bound δ is defined to reflect undesired variation.
The variables I, D and V are computed as follows:

where P 0 is the unigram probability of observing an action in the real data and P 1 is the probability of a user simulation predicting a action.
The super score is then given by
 $${\rm{\sc {super}}}\, = \,\frac{1}{m}\mathop{\sum}\limits_{k\, = \,1}^m \frac{{V\, + \,I\, + \,D}}{n}$$
where n is the number of possible user acts and m the number of contexts. Notice that the super score is similar to the Word Error Rate measurement used to assess speech recognition systems.
The super score addresses many of the desired features described in Section 2, however, it is not a direct measure of the ability of the user model to predict the performances of an SDS when used with real users.
3.2.7 Human evaluation
Ai and Litman (Reference Ai and Litman2008) propose to use human judges to evaluate automatically generated corpora. In this approach, human judges serve as a gold standard for user simulation assessment. This choice is based on several arguments. First, it provides a method to evaluate how hard it is to distinguish between simulated and real dialogues. If a human judge performs a bad classification, the machine is likely not to perform better. Second, a new metric could be developed by using human judgement as a gold standard. This new metric should predict this judgement using objective measures. Finally, comparing human judgement with automatically computed scores can help in validating the quality of the metric.
The study reported in Ai and Litman (Reference Ai and Litman2008) is based on subjective questions asked to the human judges observing dialogues between a student and a tutor. It subsequently uses the scores provided by human judges to train different metrics with supervized learning methods (stepwise multiple linear regression and ranking models). The study concludes that the latter method is able to mimic correctly human judgements and could be used to evaluate new simulated dialogues. This method is very close to paradise (Walker et al., Reference Walker, Litman, Kamm and Abella1997b), which evaluates SDS strategies by predicting user satisfaction from real interactions.
The major drawback of the human evaluation method is that it requires human judges to score the dialogues. It is very time-consuming and it is always difficult to know how many human judges should be involved (e.g. what is the protocol for reaching a meaningful inter-annotator agreement?). The metrics are also trained for a specific application and it is very difficult to tell how such a metric could generalize to other domains.
3.2.8 Absolute performance of learnt strategy
User simulations are frequently used for training optimization algorithms for SDS management strategies, such as RL (Sutton & Barto, Reference Sutton and Barto1998). Ai and Litman (Reference Ai and Litman2009) propose to measure the performance of the SDS when trained against different user models. The performance is measured as an expected cumulative reward (Williams & Young, Reference Williams and Young2007) when applying a learnt strategy. The performance of the SDS with real users is used as an assessment measure for the user simulation. Also, the transition probabilities  $$\[--><$> P({{s}_{i\, + \,1}}|{{s}_i},{{a}_i}) <$><!--$$ (where si is the dialogue state and ai the system's dialogue act at time step i) are measured in both the real data and the simulated data and compared state by state.
This method suffers from a bootstrapping problem. It requires testing the dialogue system on real users after training to obtain the quality measurement while it is precisely the goal of the user model to predict the performance of the trained system when used with real users. Concerning the comparison of the transition probabilities, it is very similar to the methods discussed in Section 3.1.1 and raises the same issues.
3.2.9 Strategy evaluation on real dialogue data
Schatzmann et al. (Reference Schatzmann, Stuttle, Weilhammer and Young2005b) discuss the influence of the user model on the system dialogue strategy learnt by means of RL (Sutton & Barto, Reference Sutton and Barto1998). Although most of the assessment methods are based on user simulation, the paper proposes one method based on direct comparison with real data. The principle of the method is rather simple. Let us suppose that a database of real dialogues {di} is available, a user model is trained on this data set. This user model is then used to train an RL algorithm that searches for the optimal dialogue strategy π* to interact with this model. After learning, the computed strategy π* is compared with the strategy  $$\[--><$> {{\pi }_{{{d}_i}}} <$><!--$$ followed in each of the dialogues di in the database. To do so, for each dialogue di a similarity measure
 $$\[--><$> Sim\{ {{\pi }^\ast}, {{\pi }_{{{d}_i}}}\} <$><!--$$ is computed. A quality measure Ri is also computed for each dialogue di. This quality measure can be the same as the reward function used for training the reinforcement algorithm for instance. The basic idea is thus that if the user model represents the real user population well, then there should be a positive correlation between
 $$\[--><$> Sim\{ {{\pi }^\ast}, {{\pi }_{{{d}_i}}}\} <$><!--$$ and Ri. Indeed, if the strategy followed by the system during dialogue di is close to π* then Ri should be high. If not, it means that the learnt strategy is not optimal for real users and so that the user model that served for learning the strategy π* did not behave similarly to the actual users. The actual metric that can be extracted is thus the correlation coefficient between
 $$\[--><$> Sim\{ {{\pi }^\ast}, {{\pi }_{{{d}_i}}}\} <$><!--$$ and Ri.
This metric is very interesting since it directly uses existing data rather than needing new data collection or human evaluation. Besides the need of training an RL algorithm for each user model, the main drawback of this method is the need of a similarity measure between strategies. Indeed, defining such a measure could probably be a topic of research by itself. Depending on the definition of the Sim measures, the proposed metrics may exhibit interesting features such as the consistency of sequences of dialogue acts for instance.
3.3 N-gram Kullback–Leibler divergence
As discussed in Section 3.1.3, KL divergence is a direct measure and captures the similarity between two distributions. However, it does not capture similarities between sequences of dialogue acts but only between frequency distributions of dialogue acts. It is, therefore, hard to tell whether dialogues are similar as they could simply use the same dialogue acts but not in the same order.
As discussed in Section 3.2.3, the KL divergence has been computed by comparing the distribution captured by two HMMs, one being trained on the original data (containing real human–machine interactions) and the other being trained on the artificially generated data (Cuayahuitl et al., Reference Cuayahuitl, Renals, Lemon and Shimodaira2005; Cuayahuitl, Reference Cuayahuitl2009).
In a similar way to the HMM approach discussed in Section 3.2.3, the N-gram KL divergence (Janarthanam & Lemon, Reference Janarthanam and Lemon2009b) is computed between the distributions captured by advanced N-grams trained on a human–machine interaction corpus. Notice that Georgila et al. (Reference Georgila, Henderson and Lemon2006) already introduced the combination of N-grams with other metrics such as prediction and recall. These combined metrics have properties similar to the super one. The advanced N-gram model is a realistic model of each corpus since it takes into account context variables and is deemed sufficiently smoothed by the author to support variability in the generated sentences. This way, unseen dialogues are not penalized if they are ‘too far’ from the distribution captured by the advanced N-gram thus solving the generalization problem. It could be argued that this application of the KL divergence takes it from a turn-level metric to a dialogue-level one.
4 Future directions
In this section, we propose a new metric for ranking and optimization of user simulations using IRL. RL (Sutton & Barto, Reference Sutton and Barto1998) is now a state-of-the-art method for optimizing dialogue management systems (Levin et al., Reference Levin, Pieraccini and Eckert1997; Singh et al., Reference Singh, Kearns, Litman and Walker1999; Scheffler and Young, Reference Scheffler and Young2001; Pietquin, Reference Pietquin2004; Williams et al., Reference Williams, Poupart and Young2005; Frampton and Lemon, Reference Frampton and Lemon2010). It is based on the Markov Decision Processes paradigm where a system is described in terms of states and actions. The goal of RL is to learn the best action to perform in each state according to a criterion called a reward function. In the context of dialogue management, states are given by the dialogue context and actions are the different dialogue acts the dialogue manager can perform. The reward function is often defined as the expected user satisfaction, which has to be maximized (Singh et al., Reference Singh, Kearns, Litman and Walker1999). RL is, therefore, used to learn which dialogue act should be transmitted to the user given the dialogue context so as to maximize their satisfaction.
The RL problem has a dichotomy: the IRL problem (Russell, Reference Russell1998). By observing an expert agent (mentor) performing optimally, IRL aims at discovering the reward function serving as the optimization criterion to the expert. Once this reward function is learnt, an artificial agent can be trained upon this function so as to mimic the expert's behaviour. The main problem of IRL is that there exists an infinite number of reward functions explaining the expert's behaviour including trivial solutions and constraints have to be added to obtain a solution usable for optimizing an artificial agent (Ng & Russell, Reference Ng and Russell2000).
The idea of using IRL for dialogue management optimization has been proposed in Paek and Pieraccini (Reference Paek and Pieraccini2008). In their paper, the authors propose to use IRL on data collected from human–human interactions to learn the policy followed by the human operator. Similarly, Rieser and Lemon (Reference Rieser and Lemon2008) and Janarthanam and Lemon (Reference Janarthanam and Lemon2009d) use Wizard-of-Oz techniques to gather data and train a policy that mimics the human wizard. The assumption here is that the human operator or wizard's behaviour is optimal; however, several criticisms can be made about this approach. First, in most of the real-world applications, human operators are instructed to follow decision tree-based scenarios. Imitation of the human operator would result in learning this decision tree and nothing can ensure that this is optimal. Second, even if the human operator can freely interact with the users, optimality from the user satisfaction point of view is not guaranteed. Third, when interacting with a human, users adopt different behaviours than when interacting with machines (Walker et al., Reference Walker, Hindle, Fromer, Fabbrizio and Mestel1997a).
In this paper, we propose to use IRL in a different manner. We argue that if the human operator may not be optimally acting to maximize the users’ satisfaction, the users are unconsciously trying to optimize their satisfaction when interacting with a machine. IRL could, therefore, be used to learn the internal (non-observable) reward function that users naturally try to maximize (Chandramohan et al., Reference Chandramohan, Geist, Lefèvre and Pietquin2011).
There are several advantages to this approach. First, IRL algorithms can be trained on human–machine interaction data, which are easier to automatically annotate than human–human interaction data. Second, the learnt reward function can serve as a metric for user simulations since a user simulation that performs badly according to this function is probably not reproducing real users’ behaviour. Finally, this reward function can serve as an optimization criterion to train a user simulation that is independent from the dialogue management system. Indeed, the reward function optimized by the user is related to their satisfaction and not to the actual performance of the system. Therefore, if the SDS policy is modified, the user simulation should change its behaviour so as to continue maximizing the reward function as a real user would change their behaviour so as to continue maximizing their satisfaction.
This last feature is important for training RL-based dialogue management systems since RL involves a trial-and-error process aiming at incrementally improving the interaction policy. The policy thus changes frequently and current user models that are trained from data collected with a fixed interaction policy, cannot adapt their behaviour according to modifications of the SDS.
A metric obtained from IRL addresses many of the features listed in Section 2. It would provide a single scalar value that is automatically computed and can serve to rank and optimize user models. It could be used to predict performances of real users when interacting with an SDS since this metric is related to user satisfaction. It would not be sensitive to unseen dialogues that are generated by simulation since if they reach good performance, the dialogues themselves are not important but can be judged as realistic from the user's point of view. It could be automatically obtained regardless of the task since nothing is task dependent in the IRL paradigm.
Several issues have still to be solved. First, there is inter-user variability that makes the notion of satisfaction user dependent. Thus, it would be hard to compute a single reward function for a whole set of users. A method for automatically clustering the user population according to the metric while learning this metric is required. Moreover, users may not always be optimal according to their internal reward function (they can make errors) and a tolerance factor has to be included in the learning algorithm.
5 Discussion and conclusions
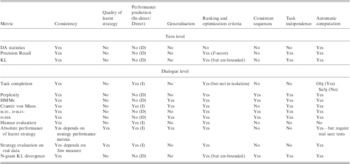
Table 1 shows a comparison of metrics presented in this paper with respect to the list of desired features presented in Section 2. In this paper, we have described metrics in terms of turn level and dialogue level. An alternative approach is to categorize metrics into direct or indirect methods of measuring quality of user simulation: direct methods assess the user simulation by testing the quality of its predictions and indirect methods attempt to measure the quality of a user model by evaluating the effect of the model on the dialogue system performance. Direct metrics include Perplexity, HMM similarity, d-bleu, super and (N-gram) KL. Indirect metrics include Task Completion, Cramér-von Mises divergence, human evaluation, quality of learnt strategy and strategy evaluation on real data.
A comparison of metrics presented in this paper with respect to the list of desired features presented in Section 2

DAs = dialogue acts; KL = Kullback–Leibler; HMMs = Hidden Markov Models; bleu = Bilingual Evaluation Understudy; d-bleu = Discourse-bleu;super = Simulated User Pragmatic Error Rate.
(D) is a Direct and (I) is a Indirect measure.
As illustrated in Table 1, not one of the existing metrics possesses all the desired features; however, the Cramér-von Mises divergence is one metric presenting most of the desired features together with the super score. The Cramér-von Mises divergence is able to predict the performance of a dialogue system with real users while it is not able to judge if the user simulation can generalize to unseen situations. The super score is able to measure generalization capabilities, although it cannot be used to predict performance of a dialogue system as such. The N-gram KL metric has all the advantages of the KL metric but is also able to capture generalization. Only d-bleu really focuses on the naturalness of generated dialogue but it also fails in predicting performance of an SDS when interacting with real users. It also shares the disadvantages of the bleu metric, which is widely used in machine translation. All the described methods provide metrics that can be automatically computed from the log files. Finally, a scalar value is provided by all the metrics, however, some are easier to use for ranking than others as they provide a bounded variable, for example, Cramér-von Mises divergence, which is between 0 and 1. The newly proposed IRL metric fulfills all of the above-mentioned desired features with one exception that it does not explicitly measure consistency of the sequences of dialogue acts.
In summary, this paper contains several contributions. First, a list of desired features for user simulation evaluation metrics is provided in Section 2. This list serves as comparison criteria for state-of-the-art metrics that can be found in the literature and summarised in Table 1. A comprehensive list of state-of-the-art metrics for assessing user simulation are listed in Section 3. Instead of using the standard direct/indirect classification, metrics are described according to their level of analysis, specifically turn-level or dialogue-level analysis. For each of these metrics, advantages and disadvantages are listed and it is evident that no one single metric fulfills all of these desired features. Finally in Section 4, we present a promising, new metric based on IRL, which comes close to fulfilling all the desired features of a user simulation quality metric.
Acknowledgements
This research has received funding from the European Community's Seventh Framework Programme (FP72007-2013) under grant agreement no. 216594 (CLASSIC project: www. classicproject.org). The authors thank the referees, as well as Oliver Lemon and Paul Crook for their help and comments.