Introduction
Polyacrylonitrile (PAN) is a synthetic acrylic resin which is a popular material in high-performance technologies due to several properties including thermal stability, chemical resistance, and high mechanical strength. These properties of PAN fibers make them viable for cement reinforcement, filtration, absorption, insulation, energy storage, sensors, and flame-resistant fabric. The production of synthetic carbon has been a major focus in materials science and manufacturing since 1886 when the National Carbon Company was formed. Considerable research has pursued the manufacture of carbon nanofibers for their high-performance properties including exceptional mechanical strength, electrical conductivity, thermal stability, and chemical resistance.[Reference Zhang, Aboagye, Kelkar, Lai and Fong1] Precursor materials with a carbon backbone, such as PAN, pitch, or lignin; can be converted to carbon through a pyrolysis process, the most common method of carbon fiber manufacture. PAN is regarded as an excellent carbon fiber precursor and is the most common precursor material for carbon fiber production, utilized in approximately 90% of carbon fiber manufacture worldwide.[Reference Zhang, Aboagye, Kelkar, Lai and Fong1] The popularity of PAN fibers is due to a higher carbon yield and stronger resultant fibers after carbonization compared to other precursor materials.[Reference Zhang, Aboagye, Kelkar, Lai and Fong1] Furthermore, precursor PAN fibers allow a higher rate of pyrolysis and have a lower cost in comparison to other common carbon precursor materials. Currently, the strongest carbon fibers available are manufactured from conventionally spun PAN microfibers and possess a tensile strength of approximately 7 GPa at a diameter of 5 µm after carbonization, however; the maximum theoretical strength of carbon fibers is estimated to be in the range of 150–180 GPa.[Reference Zhang, Aboagye, Kelkar, Lai and Fong1]
It has been established that fiber tensile strength increases when the diameter is reduced for fibers produced from various materials and manufacturing methods.[Reference Fitzer2,Reference Griffith3] For example, the tensile strength of carbon microfibers from polymer precursors increased from 2 to approximately 8 GPa when fiber diameter was reduced from 12 to 6 µm.[Reference Fitzer2] However, when manufacturing precursor fibers through conventional spinning it is only possible to reduce precursor fiber diameter by decreasing the size of the spinneret opening and post-drawing after spinning.[Reference Zeng, Hu, Zhao, Zhang and Pan4] Through these methods the PAN precursor fiber diameter can only be reduced to 10 µm, resulting in a PAN precursor fiber tensile strength and elastic modulus up to 512 MPa and 6 GPa, respectively.[Reference Moncrieff5,Reference Wang, Zhang, Zhu, Hsiao and Chu6] The diameter of these 10 µm PAN microfibers is reduced to 5 µm after carbonization, increasing ultimate tensile strength and Young's modulus up to 7 and 294 GPa, respectively.[Reference Zhang, Aboagye, Kelkar, Lai and Fong1] PAN fibers manufactured with alternate approaches and nanoscale diameters far <10 µm may possess enhanced tensile strength and push the mechanical properties of resultant carbon fibers toward theoretical values. Additionally, many high-performance applications require materials with nanoscale dimension. Chemical vapor deposition (CVD) is one alternative method of carbon fiber production which can produce fibers smaller than 5 µm, however; this process introduces different limitations. CVD is associated with a higher cost, lower carbon yield, short fiber length, difficulty handling for further processing, and faces difficulties in mass production.
Electrospinning offers another alternative method to manufacture precursor fibers from PAN in the nanoscale. However, electrospun nanofibers are weaker than conventionally produced microfibers of the same materials despite significantly smaller diameters.[Reference Reneker, Yarin, Fong and Koombhongse7] Electrospun PAN nanofibers have exhibited ultimate tensile strengths of 45–50 MPa and a tensile modulus of 0.5–0.8 GPa.[Reference Wang, Zhang, Zhu, Hsiao and Chu6,Reference Xie, Niu and Lin8] After heated drawing well above ambient temperature, PAN precursor tensile strength increased up to 372 MPa and Young's modulus increased up to 11.8 GPa.[Reference Wang, Zhang, Zhu, Hsiao and Chu6,Reference Xie, Niu and Lin8] Carbon fiber yarn from electrospun and hot drawn PAN yarns may possess a tensile strength of 1.2 GPa and a modulus of 40 GPa.[Reference Xie, Niu and Lin8] Carbon fiber from electrospun PAN single fibers may possess tensile strength up to 3.5 GPa and a modulus of 191 GPa.[Reference Arshad, Naraghi and Chasiotis9] These values are comparable but do not exceed the mechanical strength of conventional carbon microfibers, regardless of high-temperature fiber post-drawing or diameter reduction.
Studies have shown that residual solvent in electrospun fibers allows polymer chain relaxation, causing unorganized polymer chain conformation within individual fibers.[Reference Reneker, Yarin, Fong and Koombhongse7] This results in a loss of macromolecular organization contributed by the electrospinning process and creates fibers with mechanical properties below both theoretical nanofiber values and reported values for conventional microfibers. Chain relaxation caused by residual solvent occurs in electrospinning rather than conventional solution spinning due to differences in manufacturing and processing methods, specifically, the absence of a semi-solid drawing stage. Ideally, the drawing process would occur as the solvent evaporates and the polymer is still moldable, preventing chain relaxation during fiber drying.
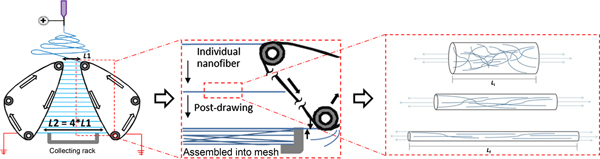
The application of a drawing stage has been well documented to improve the mechanical properties of conventionally manufactured PAN fibers.[Reference Yao, Bastiaansen and Peijs10] Conventional spinning involves the extrusion of the material through a die followed by several stages of post-drawing and tensioning of the fiber in the semi-solid or solid state to reduce polymer chain relaxation. During post-drawing, the fiber elongates, and fiber diameter decreases while polymer chains uncoil and extend. Extended chains align and compact together under continued draw and diameter reduction, as illustrated in Fig. 1. Post-drawing and tensioning in the semi-solid or solid state prevents the subsequent reversal of chain organization that would occur due to rapid chain relaxation in the dilute polymer solution. Aligned and organized polymer chains become more prevalent, which has previously shown to be a primary source of mechanical strength in polymer fibers and has shown to improve the mechanical properties of the carbon fibers after pyrolysis.[Reference Bahl, Mathur and Kundra11] In addition, the strength of a material is limited by the presence of small defects, such as surface cracks, in the material.[Reference Griffith3] The decrease in fiber diameter during drawing also reduces the probability of a defect occurring; resulting in a material with mechanical properties closer to theoretical values.[Reference Fitzer2,Reference Sawai, Fujii and Kanamoto12,Reference Fennessey and Farris13]
(Left). Automated-tracks facilitate continuous collection of PAN nanofibers across the initial gap of length (L1) and then post-draw fibers to a final length (L2). (Center). Individual fibers rather than collective meshes are post-drawn. When fibers reach the bottom of the device they are sheared from the track and transferred to a stationary rack which holds the fibers in tension as the tracks continue to turn and collect more fibers. (Right) As the fibers are lengthened, the diameter decreases as polymer chains align and extend. Organized chains are expected to become more prevalent resulting in a stronger fiber.

The inclusion of a drawing stage is ideal to overcome these limitations but is difficult to implement in the electrospinning process.[Reference Yao, Bastiaansen and Peijs10] In electrospinning, the polymer solution is pulled through a spinneret by a high voltage and after exiting the needle the jet of polymer solution is subject to strain rates up to 105 s−1 and draw ratios as high as 105. However, jet induced orientation can be reversed because residual solvent allows fast polymer chain relaxation and results in nanofibers with low molecular orientation and mechanical strength.[Reference Reneker, Yarin, Fong and Koombhongse7] Drawing meshes of fibers after collection results in junctions at fiber crossover, which cause nonuniform draw and by extension nonuniform mechanical properties. In comparison, the drawing of single fibers would be highly inefficient. Furthermore, it has also been observed that post-drawing after carbonization does not improve the macromolecular orientation and mechanical properties of the fibers.[Reference Fitzer2] Therefore, the drawing process must be included during precursor fiber processing, while the fiber remains moldable. Here a method of electrospinning is described which enables the possibility of post-drawing electrospun nanofibers in the semi-solid state to impart organized polymer chain structure and prevent spontaneous chain relaxation during collection. This unique method utilizes a parallel automated-track collecting device to overcome the size limitations imposed by conventional spinning and the processing limitations associated with electrospinning. The automated-track design combines vital post-processing methods of conventional spinning and the diameter range of electrospinning to extend post-drawn processing to nanoscale polymer fibers. This study investigates the effect of automated-track drawing at increasing draw ratios on the properties of electrospun PAN nanofibers.
Materials and methods
Electrospinning
An automated-track collecting device, unique to our laboratory (Fig. 1), employs a set of adjustable tracks and allows individual nanofibers to be simultaneously collected and drawn to induce macromolecular alignment before assembly into a mesh, as described previously.[Reference Brennan, Jao, Siracusa, Wilkinson, Hu and Beachley14] Electrospun PAN nanofiber samples were collected and post-drawn to four increasing draw ratios (DR = Final Length/Initial Length); from 1:1(DR1) where fibers are collected across parallel tracks and removed without drawing, to 1:4 (DR4) where fibers are drawn from an initial length of 4 cm to a final length of 16 cm. Randomly aligned control fiber samples were collected on a flat, aluminum plate under the same conditions and without further processing.
Electrospinning was completed using 18% wt./wt. PAN (MW 150,000 Da, Sarchem Labs) dissolved in dimethylformamide (DMF, Sigma Aldrich) mixed at 60°C for 24 hrs. The polymer solution was loaded into a syringe pump (New Era Pump Systems) and fed through a 21-gauge needle at a rate of 1.5 mL/hr. The PAN solution was heated to 45°C with a syringe heater and the relative humidity was kept in the range of 10–40% to produce smooth, uniform fibers in a continuous process. Electrospinning was performed at 15 kV with the needle set 15 cm above the initial gap of the automated-track target. Fibers were collected between two tracks, 10 cm in width, for 2 minutes per sample. The track speed remained at 8 mm/s for all samples, resulting in a 0, 2.8, 5.6, and 7.7 mm/s linear elongation rate for DR1, DR2, DR3, and DR4 samples, respectively. Six samples (n = 6) were spun for each collection condition and analyzed as described in the following sections. After collection, fibers were transferred onto plastic slides which can hold four, 1 × 1 cm2, nanofiber sheets for testing and characterization. Further details of the automated-track system and nanofiber collection are described in a previous paper.[Reference Brennan, Jao, Siracusa, Wilkinson, Hu and Beachley14]
Fiber morphology
A desktop scanning electron microscope (SEM, Phenom Pure) was used to observe fiber morphology, individual fiber diameter, fiber density and alignment in the 1 × 1 cm collective sheet. Fiber meshes from each sample set were observed under 800x and 8000x magnification to measure fiber mesh density and individual fiber diameter, respectively. Image J software was used to measure fiber diameter, evaluate the density of the fiber arrays, and quantify fiber alignment from SEM images. Individual fiber diameter and collective sheet density measurement were used to determine the total cross-sectional area of each 1 × 1 cm sample used for stress-strain analysis. The average fiber diameter was calculated from measurements taken from 5 images per sample at 8000x magnification (n=5). The average density of the fiber mesh was determined using the Cell Counter plug-in to tally the number of fibers per 100 µm orthogonal to the draw direction from 3 images per 1 × 1 cm sample taken at 800x (n = 3). The total cross-sectional area of a sample was calculated as the average cross-sectional area of an individual fiber multiplied by the average number of fibers in a 1 × 1 cm sheet. ImageJ was also used to analyze fiber alignment within the mesh and assess the degree of deviation from the intended direction of fiber orientation. Perfect alignment of fibers relative to the intended direction is defined as 0° and 90° indicates alignment perpendicular to the intended direction.
Polymer chain orientation
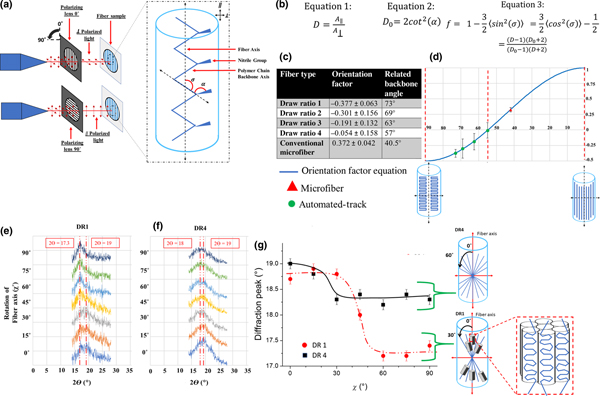
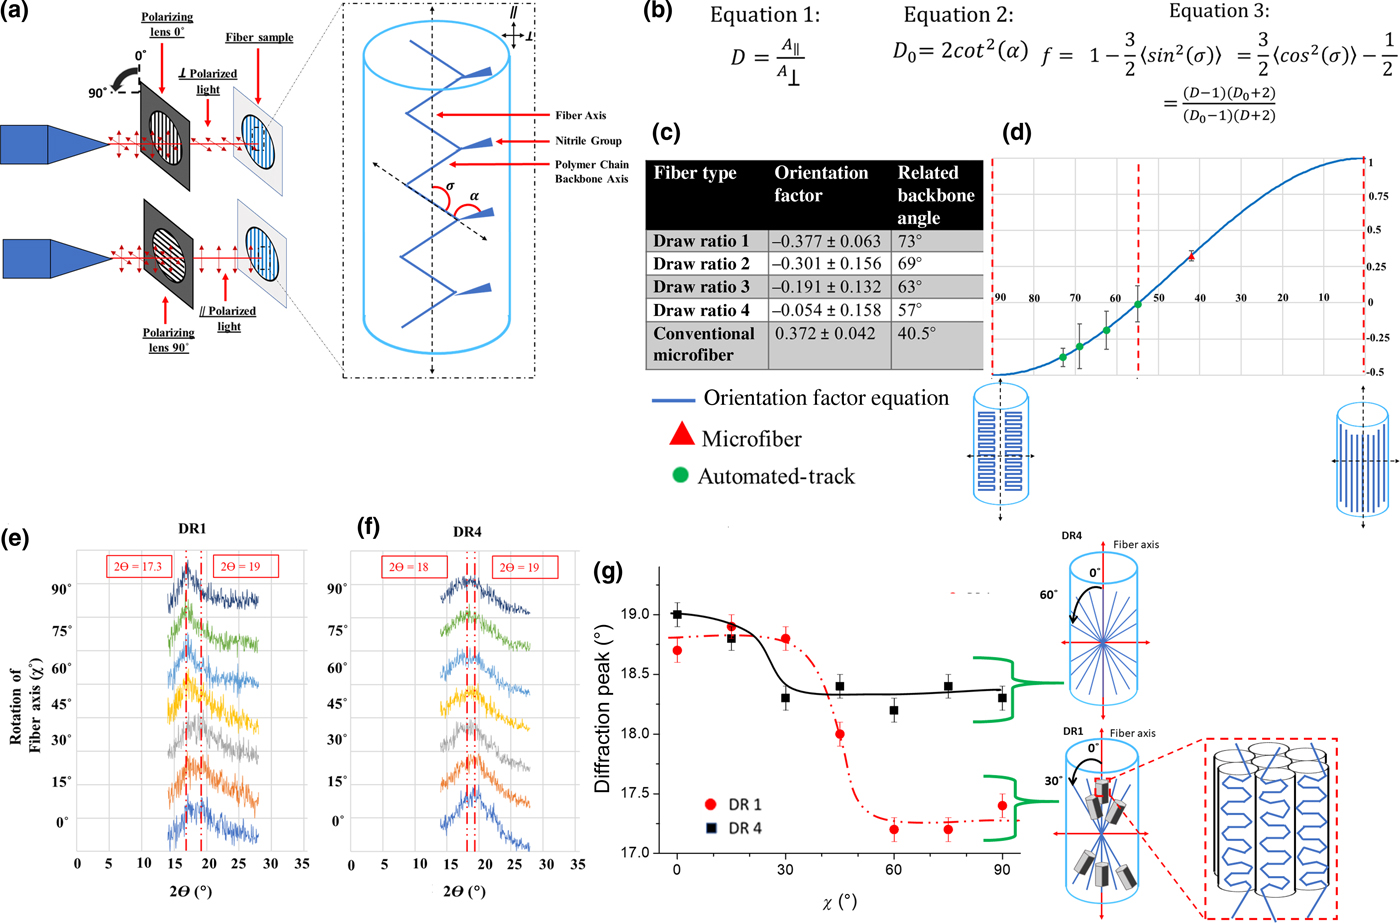
The molecular alignment of samples collected at each draw ratio (DR1–DR4) was analyzed using polarized Fourier-transform infrared spectroscopy (FTIR) (Thermo, IS50 Nicolet). As a control, the orientation factor was also calculated in the same way for conventionally manufactured PAN microfibers kindly donated by Sarchem Labs. In unpolarized light, rays oscillate normal to the beam axis in any possible vibrational plane orientation. Using a polarizing filter, only light vibrating in a single direction can contact the sample. The direction of polarization (parallel versus perpendicular) is defined in relation to the ray vibration direction and orientation of the sample surface (fiber axis). For our experiments, parallel polarization (A ||) coincides with light vibrating in the same direction as the fiber axis and perpendicular (A⊥) denotes vibrations normal to the fiber axis (Fig. 3). The FTIR polarizer orientation was verified by validating the orientation of the FTIR polarizing lens, as described in the Supplementary Material. When the polarized light contacts the material the intensity of the resultant peak is greatest when it is at the same angle as the chemical bond represented by the peak. The macromolecular orientation of fibers collected on a flat plate could not be assessed due to the random alignment of the fibers. Samples collected on the automated-tracks had sufficient degree of fiber alignment for characterization of macromolecular orientation. With polarized FTIR and were loaded into the spectrometer vertically (Fig. 3). Omnic software was used to obtain spectra and analyze changes in peak intensity to evaluate changes in polymer chain orientation with changing draw ratios. The peak at 2240 cm−1 depicts the presence of the triple bonded nitrile group (C ≡ N) inherent to PAN and was used to evaluate change in polymer backbone orientation with draw. Dichroic ratio (D) (Eq. (1)) was determined as the ratio between the normalized parallel (A ||) and perpendicular ( $A$⊥) absorption peaks (Fig. 3). An isotropic material will have a dichroic ratio of 1. In the configuration used (Fig. 3), chemical bonds with dichroic ratio >1 absorbed more parallel polarized light and are aligned toward the direction of the fiber axis. Chemical bonds with dichroic ratio <1 absorbed more perpendicular polarized light and are aligned toward the direction perpendicular to the fiber axis. However, since the C ≡ N group is not aligned in the same direction as the PAN polymer chain backbone a correction (Eqs. (1)–(3)) must be made to determine backbone alignment via (C ≡ N) characterization. The dichroic ratio for a polymer backbone with optimal orientation in the direction of the fiber axis (D 0) was calculated using the transition moment angle (α) of 70° for the triple bonded nitrile group.[Reference Fennessey and Farris13] The transition moment angle is the average angle of the nitrile group relative to the backbone of the polymer chain. Because this nitrile bond is rigid and the angle from the backbone is constant, the angle can be used to calculate D 0 (Eq. (2)). Herman's orientation factor (f) (Eq. (3)) was then calculated using the D and D 0 to determine the average orientation of the polymer chain backbone relative to the axis of the polymer fiber. For materials with polymer chain backbones aligned perfectly with the fiber axis f is 1 and the angle between the fiber axis and the backbone is zero (σ = 0°). Isotropic samples with no orientation have a value of f = 0. Materials with polymer chains lying perfectly perpendicular to the fiber axis would have a value of f = −0.5 and the angle between the fiber axis and the backbone is σ = 90°.[Reference White and Spuiell15]
Electrospun fiber samples collected at DR1 and DR4 were also examined with x-ray diffraction (XRD) using a Panalytical Empyrean diffractometer with Cu Kα radiation to confirm orientation obtained from polarized FTIR. Measurements were done in Bragg-Brentano geometry with a parallel beam mirror and ¼° divergence slit. A parallel plate collimator was used to minimize the noise, and data were collected with a Pixel detector. Measurements were made every 0.05° at a rate of 30 s per point. Samples were visually oriented and then rotated on a 5-axis Eulerian cradle in 15°increments from the fiber axis.
Mechanical properties
The mechanical properties of the fibers were assessed by uniaxial tensile loading in a Shimazdu EZ-SX tensile tester with a 2 Newton load cell. Individual slides of 1 × 1 cm fiber sheets were secured in the clamps of the device and the sides of the collection slide are cut away so only the fiber sheet is loaded. Each sample was then elongated at a rate of 5 mm/min until failure. The ultimate tensile stress was calculated as the recorded load divided by the fiber sheet cross-sectional area obtained from measurements of SEM images (section “Fiber morphology”) Young's modulus was determined by calculating the slope of the initial, linear portion of the stress-strain curve, for strain from 0 to 0.01. The strain was calculated as the change in length divided by the initial length of the sample in the fiber axis direction (10 mm) and the maximum elongation was recorded at the point of sample failure. Toughness was calculated as the area under the stress-strain curve, using Riemann sums. Statistical significance of sample sets was determined by group to group comparison with Mann–Whitney tests in IBM SPSS Statistics software.
Results and discussion
Electrospinning
The automated-track system was able to post-drawn individual PAN nanofibers up to a draw ratio of four (4 cm up to 16 cm) (DR4) and collect the fibers in aligned arrays. Electrospun nanofibers deposited across the top gap of the device and the automated-tracks pulled the fibers down, away from the initial point of collection and the high voltage source. The adjustable angle of the tracks allowed the drawing of thousands of individual fibers per minute. As the fiber traveled down the tracks it reached a stationary collection tray which sheared the fiber from the tracks and fixed the opposite ends of the fiber to the tray to maintain tension after collection. The automated-track electrospinning design facilitated the integration of electrospinning and the post-drawing process fundamental to conventional fiber production. This system elongates fibers immediately upon collection and has previously shown to produce fibers from polycaprolactone with mechanical properties exceeding values previously obtained through both electrospinning and conventional manufacture.[Reference Brennan, Jao, Siracusa, Wilkinson, Hu and Beachley14] The key elements of this design are the ability to draw individual fibers, the simultaneous processing of thousands of fibers, drawing while the solvent evaporates, and compatibility with polymers which can be electrospun across parallel plates.
A DR4 was the maximum achievable draw using the PAN polymer solution and spinning parameters reported in the section “Electrospinning”. The environmental conditions during spinning have a major effect on the ability to spin and draw fibers consistently; deviations outside of the optimal parameters listed consistently result in fibers breaking or peeling from the tracks before collection or the complete inability to spin. Further optimization of environmental conditions, electrospinning and polymer solution parameters, and the draw rate may allow greater draw ratios to be obtained. Additionally, the ability to post-drawn PAN nanofibers in elevated temperature conditions is expected to allow fibers to be drawn to much greater draw ratios.
Fiber morphology
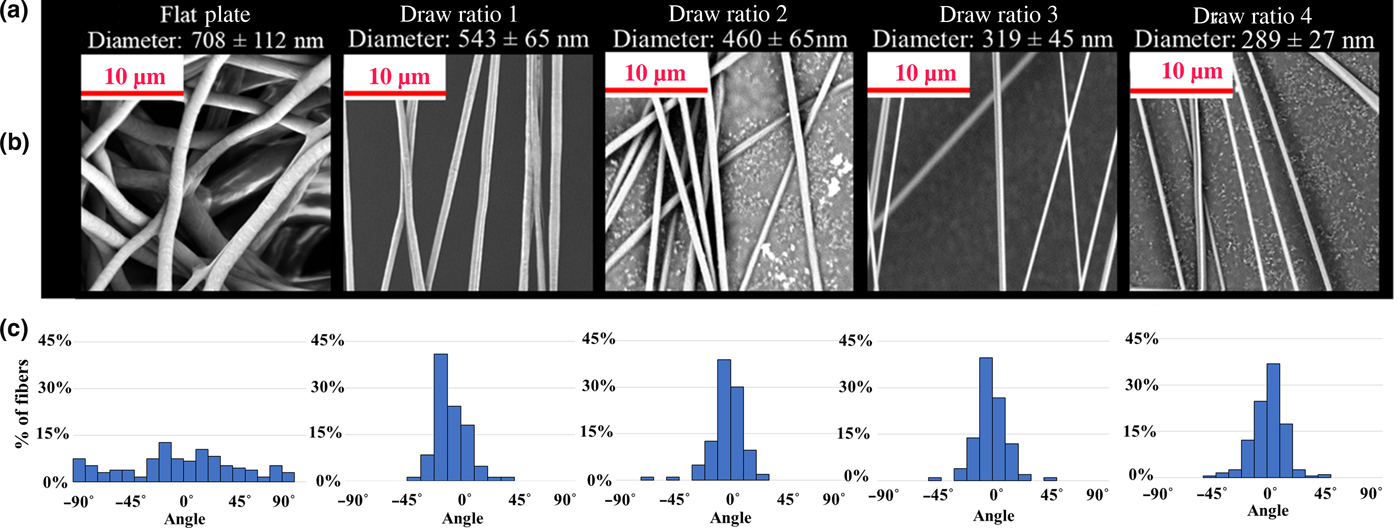
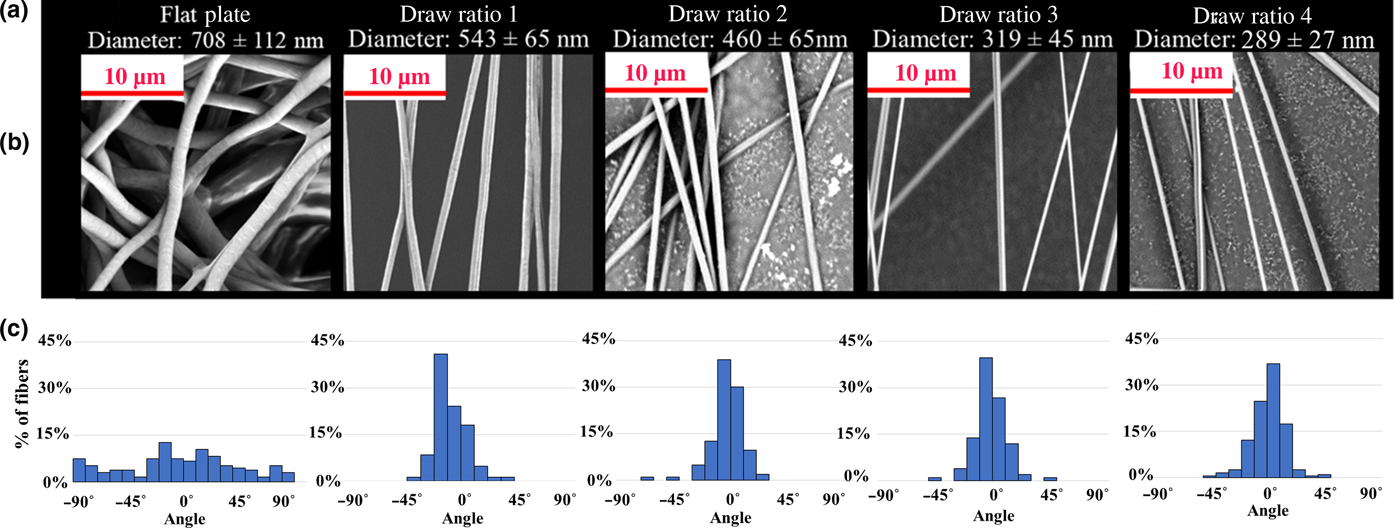
PAN nanofibers with smooth surfaces, without beads or pits, were produced for all four draw ratios. This was achieved by optimizing the electrospinning parameters, as described in detail in the section “Electrospinning”. The fiber diameter showed a systematic reduction from 708 to 289 nm with increasing draw ratio from random alignment to DR4. The final diameter of drawn fibers had an average standard deviation of 27 nm compared to undrawn fibers collected on a flat plate with a standard deviation 112 nm. Alignment of the fibers is achieved by collection between parallel tracks and stays consistent between samples of different draw ratios, where 0° indicates perfect alignment between automated-tracks and 90° represents alignment perpendicular to the draw direction of the tracks (Fig. 2(c)) Fibers collected on a flat plate had high variation in alignment for all samples, with alignment deviating as much as 90° in either direction. Fibers collected between the automated-tracks at DR1 had a smaller distribution, varying 20° from the direction of draw. Beyond DR2, most fibers collected have predominantly ideal alignment, on average deviating by 10° from the direction of draw. Fibers collected across the automated-tracks appear to be free of surface defects, such as cracks, beads, and necking which cause stress concentrations in the fiber which limit the strength of the material and lead to premature failure.[Reference Griffith3,Reference Yao, Bastiaansen and Peijs10]
(a) Fiber diameter systematically decreased with increasing draw ratio. (b) SEM images of Electrospun PAN nanofiber collected on a flat plate and at increasing draw ratios. (c) Change in alignment distribution with draw ratio.
Polymer chain orientation
The effect of automated-track post-drawing on PAN nanofiber polymer chain order was assessed by polarized FTIR to calculate Herman's orientation factor. Changes in dichroic ratio for the nitrile group absorption (wavelength 2240 cm−1) were observed with increasing draw ratio. The nitrile absorption intensities for samples collected on the automated-tracks were greater when the FTIR beam was polarized parallel to the fiber axis. This resulted in dichroic ratios >1 at this wavelength and indicated anisotropic polymer chain structure. Fiber samples collected on the automated-tracks produced negative Herman's orientation at every draw ratio (Fig. 3(c)). At DR1 there is a high degree of polymer backbone orientation perpendicular to the fiber axis, expressed by the Herman's orientation factor of −0.377. The orientation factor became less negative as the draw ratio was increased from DR1 to DR2, DR3 and DR4. When collected at DR4, the orientation value had increased to −0.054, representing a 85% change in orientation factor. The changes in Herman's orientation factor indicate a systematic change in polymer chain orientation with increasing draw ratio.
(a) Schematic representation of polarized FTIR spectroscopy used to calculate orientation of the polymer chain backbone. Where α is the rigid angle between the nitrile group and the polymer chain backbone and σ is the angle between the fiber axis and polymer chain backbone. (b) The equation used for calculating Dichroic ratio (Eq. (1)), ideal dichroic ratio (Eq. (2)), and Herman's orientation factor (Eq. (3)). (c) Values of Herman's orientation factor for PAN nanofibers collected at different draw ratios. (d) Herman's orientation factor for automated-track nanofiber and conventional microfibers plotted against predicted backbone angle from fiber axis. Herman's orientation factor equation plotted against changing angle between polymer chain backbone and fiber axis. (e) Shift in XRD peak with incremental rotation about the fiber axis for fibers collected at DR1 (f) Shift in XRD peak with incremental rotation about the fiber axis for fibers collected at DR4. (g) Change in diffraction peak intensity with rotation about fiber axis related to hexagonal packing and splaying polymer chains for samples collected at DR1 and DR4.
The Herman's orientation factor calculated for all automated-track samples exhibited acutely different trends compared to values commonly reported in the literature for electrospun PAN nanofibers. Studies of commercially available conventional PAN microfibers and electrospun nanofibers generally report positive orientation factors approaching values of 1, indicative of a high degree polymer chain alignment to the fiber axis.[Reference Moncrieff5,Reference Sawai, Fujii and Kanamoto12,Reference Fennessey and Farris13,Reference Naraghi, Arshad and Chasiotis16,Reference Chen17] In contrast, the orientation factor of fibers collected on the automated-track device is negative and approach 0 with increasing draw ratio. This indicates that the electrospun PAN nanofibers in this study have backbone alignment perpendicular to the fiber axis. A trend toward f = 0 is generally accepted to depict a decrease in macromolecular order so the data initially could indicate that the polymer chains in the PAN nanofibers are becoming more disordered with increasing draw ratio. This is unexpected considering previous studies have established that fiber drawing increases chain alignment with the fiber axis (draw direction) from low to high order for both conventional and electrospun fibers.[Reference Sawai, Fujii and Kanamoto12,Reference Chen17] As a control, the same procedure was performed for commercially available PAN microfibers (Sarchem Labs) and obtained positive orientation values (0.37) comparable with previous reports for melt-spun PAN microfibers, drawn PAN films, and electrospun PAN nanofibers.[Reference Wang, Zhang, Zhu, Hsiao and Chu6,Reference Fennessey and Farris13,Reference Chen17]
We hypothesize that the systematic approach of orientation values toward f = 0 with increasing draw ratio indicates a change in the PAN chain conformation rather than just a trend toward isotropic disordering of polymer chains. It is probable that the negative orientation factors at DR1 indicate the organization of polymer chains into kinked lamellar structures, which has been observed for the crystalline state of polymers.[Reference Fried18] Furthermore, research in melt spun polymers described the development of folded chain lamellar structures, oriented in rows perpendicular to the fiber axis (draw direction) when subject to low strain.[Reference White and Spuiell15] Under sufficient drawing strain, the lamellar structure deforms by slip with polymer chains pulled out and aligning in the direction of draw.[Reference Young and Lovell19] Conventionally manufactured and drawn PAN fibers and films have also been described as laterally ordered in some cases.[Reference Bohn, Schaefgen and Statton20] This is due to the steric and dipolar repulsions inherent to the polymer, which created a twisted, folded structure in the polymer chain, even in the presence of draw.
The change in Herman's orientation factor with the angle between polymer backbone and fiber axis (σ) is plotted in Fig. 3(d). This graphical representation shows how an orientation factor of −0.5 could indicate the preferential alignment of the polymer chain with a kinked lamellar geometry at an angle of 90°. Therefore, we propose that the negative orientation factor, approaching zero with increased draw ratio, represents the disruption of the lamellar structure by post-draw processing. Although the values remain negative throughout post-drawing, the major change in orientation factor indicates that the PAN chain moves away from a high degree of perpendicular orientation to straighter unkinked chains.
The effect of automated-track drawing on polymer chain orientation was also analyzed using XRD. Similarly, XRD results indicate that sample DR1 displays preferential alignment of the chains perpendicular to the fiber axis (Fig. 3(e)). At DR1, crystal alignment is predominately 0°–30° from the fiber axis (Fig. 3(g)). This is the characteristic hexagonal packing as indicated by the 17.3° peak (marked in red) of the (200) hexagonal reflection. The breadth of the peak indicates that the crystallite size is quite small, approximately 3 nm based on the Scherrer equation.[Reference Liu and Ruland21–Reference Anghelina, Popescu, Gaba, Popescu, Despa and Ungureanu23] Along the fiber axis (χ = 0°), there is only a peak near 2ϴ = 19° which decreases in intensity as χ increases to 90°. This indicates the chains are not amorphous and have some ordering along the chain direction (Fig. 3(g)). In comparison, the DR4 sample showed a wider, less defined peak at 17.3°, showing no obvious indication of crystallization into a hexagonal structure. Furthermore, along the fiber axis there is a broad peak at 2ϴ = 19° which shifts downward as χ increased to 90° (Fig. 3(e)).
XRD clearly indicates that the sample collected at DR1 shows splaying of the chains with respect to the fiber axis. Crystallization occurs normal to the chain axis, where chain alignment at 90° corresponds to crystal alignment along the fiber axis (Fig. 3(g)). Yet, with a range of only 30° from the fiber axis, the alignment distribution is too narrow to explain the FTIR results. However, the small lateral crystal size is similar to values previously reported for electrospun PAN; and could be an indication of kinks in the chains, which would also tend to contribute to the observed negative value of the Herman factor.[Reference Liu and Ruland21,Reference Song, Hou, Zhang and Wu24,Reference Esrafilzadeh, Jalili and Morshed25] For DR4, the shift of the XRD peak from 19° to 18° as the sample is rotated about the fiber axis may indicate some alignment of the chains, as the 18° peak may be the superposition of the 17° and 19° but are unresolved due to breadth. If true, the splaying of the polymer chains has a greater range in DR4 as compared to that of DR1, varying up to 60° from the fiber axis as seen in Fig. 3(g). This splaying may yield a more negative value for orientation factor compared to DR1, however; drawing during DR4 collection likely impedes crystal formation and chain kinking, thereby leaving an effectively random distribution of straight chains, in accord with FTIR results. The automated-track drawing most likely reduces crystallinity by either a disruption of crystallization kinetics or the removal of inherent crystalline structure. It is possible that the crystallization into a hexagonal structure is disrupted because drawing occurs immediately upon collection, extending the molecular chains faster than the rate of crystallization. Conversely, the crystal formation may begin as the polymer is ejected from the spinneret and is present in the fiber upon deposition. In this case, the drawing process would remove crystalline structures and kinks, reducing crystallinity as the polymer chains are extended. Additionally, this agrees with predictions which suggest that fewer kinks would result in enhanced modulus and lower elongation, as observed.[Reference Liu and Ruland21]
Mechanical testing
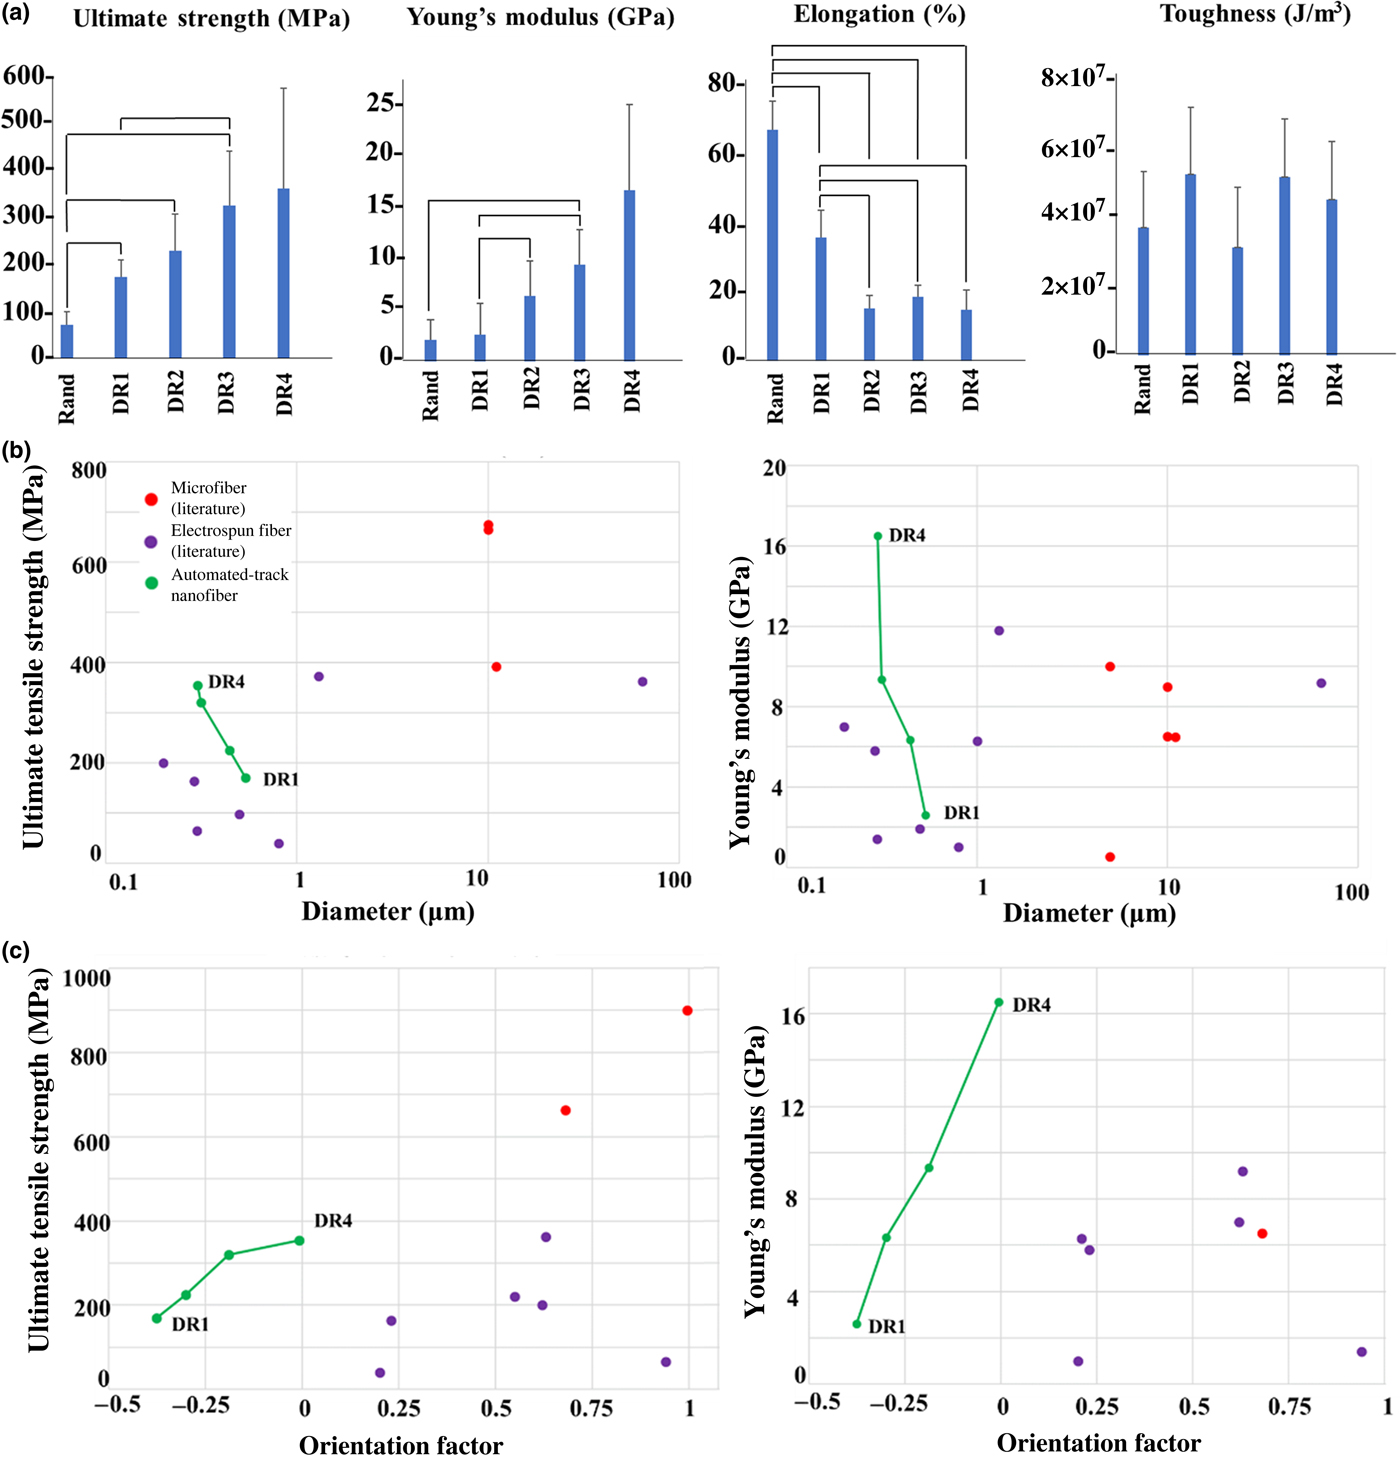
The process of drawing the PAN fibers using the automated-tracks systematically increased the mechanical properties of the fibers with increasing draw ratio (Fig. 4(a)). The ultimate tensile stress increased by 2 times from undrawn (DR1) to DR4. In a similar manner, Young's modulus increased by 6 times at DR4 compared to DR1. The elongation at failure decreased from 3.58 to 1.8 mm from DR1 to DR4, however; DR4 samples are still extensible up to 18% their original length. Toughness remained statistically similar between samples from random to DR4. The average ultimate tensile stress and Young's modulus of elasticity of fibers collected at DR4 are 354 MPa and 16.5 GPa, respectively. The drawing process improves mechanical strength by removing kinks from polymer chains as the fiber lengthens and diameter is reduced. The strength of a material is also limited by the presence of small defects, such as cracks or voids, in the material.[Reference Griffith3] Decrease in fiber diameter reduces the probability of a defect occurring in a fiber compared to bulk material, thus increasing material strength.[Reference Fennessey and Farris13,Reference Chen17]
(a) Tensile testing results for electrospun polyacrylonitrile (PAN) nanofibers collected at increasing draw ratios (DR) of 1 (undrawn), 2, 3, 4 and fibers collected on a flat plate as a random mesh (Rand). Ultimate tensile stress, Young's modulus, elongation at break and toughness were calculated from load-displacement tensile testing data for n = 6 samples. All group to group comparison with Mann–Whitney test that have a P-value <0.05 are connected by lines. (b) Comparison of fiber mechanical properties between manufacturing methods and diameter. (c) Comparison of fiber mechanical properties between manufacturing methods and orientation factor.[Reference Moncrieff5,Reference Wang, Zhang, Zhu, Hsiao and Chu6,Reference Xie, Niu and Lin8,Reference Fennessey and Farris13,Reference Naraghi, Arshad and Chasiotis16,Reference Chen17,Reference Bohn, Schaefgen and Statton20,Reference Lai, Zhong, Yue, Chen, Zhang, Vakili, Wang, Zhu, Liu and Fong27–Reference Liao, Wang, Chen and Lai31]
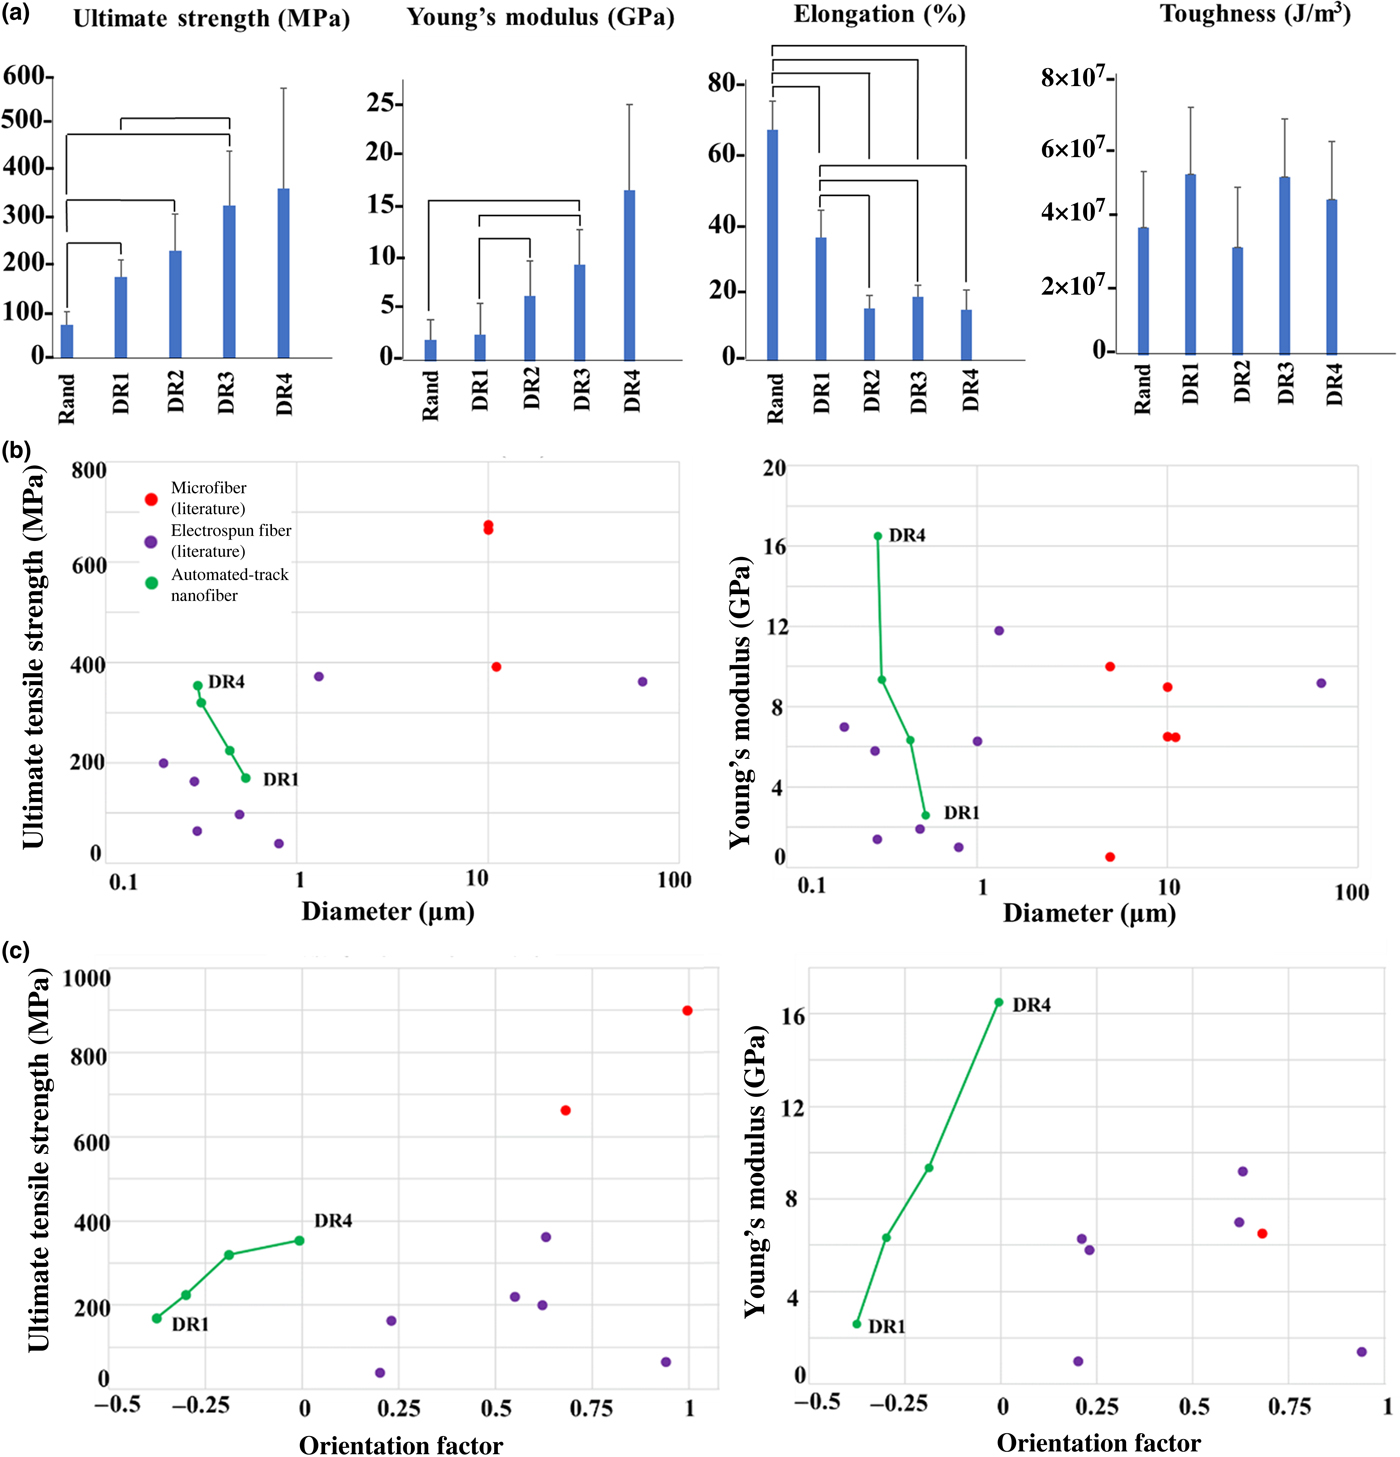
The mechanical properties obtained for automated-track fibers are comparable to commercially available PAN microfibers with a modulus of 7–10 GPa.[Reference Oota, Kunugi and Yabuki26] Nanofibers collected via the automated-track are also comparable to the values previously reported for electrospun PAN fibers bundled into yarns and dry-drawn at 140°C, which also exhibit a systematic increase in tensile strength with an increased draw. When bundled into a yarn and drawn to a ratio of five, the electrospun PAN yarns had a tensile strength of 362 MPa and Young's modulus of 9.2 GPa.[Reference Xie, Niu and Lin8]
Pictured in Fig. 4(b), PAN nanofibers collected and drawn via the automated-track design (green) have a tensile strength greater than most previously reported electrospun nanofibers of the same diameter (purple). Furthermore, the tensile strength is similar to some conventionally manufactured, commercially available PAN microfiber (red). The tensile modulus of automated-track PAN fibers meet or surpass previously reported values for PAN fibers, except for wet spun microfiber produced by Courtalds Fibers and ultra-high molecular weight microfibers prepared by Sawai et al.[Reference Sawai, Fujii and Kanamoto12,Reference Chen17]
Interestingly, automated-track nanofibers (green) achieve proportionate mechanical properties with low orientation factor compared to PAN fibers in the literature (red/purple) (Fig. 4(c)). It is reasonable to expect that the orientation factor of the automated-track fibers can be increased through additional processes such as thermal post-drawing, similar to multistep drawing common in conventional PAN microfiber manufacture.[Reference Zeng, Hu, Zhao, Zhang and Pan4] In addition, it is anticipated the mechanical strength will increase accordingly with orientation. Therefore, it is feasible that the mechanical properties of automated-track PAN nanofibers could be engineered to exceed values of fibers produced by other manufacturing methods.[Reference Moncrieff5,Reference Wang, Zhang, Zhu, Hsiao and Chu6,Reference Xie, Niu and Lin8,Reference Fennessey and Farris13,Reference Naraghi, Arshad and Chasiotis16,Reference Chen17,Reference Bohn, Schaefgen and Statton20,Reference Lai, Zhong, Yue, Chen, Zhang, Vakili, Wang, Zhu, Liu and Fong27–Reference Liao, Wang, Chen and Lai31]
Conclusions
Electrospun PAN nanofibers have promising applications in numerous fields. However, current manufacturing restrictions limit the material's strength and potential utility. The inclusion of a post-drawing stage is vital to improve the molecular orientation and mechanical properties of electrospun PAN nanofibers. The automated-track collector presented here successfully implements the ability to post-draw individual PAN fibers in the nanoscale, addressing points of difficulty in electrospinning and conventional PAN fiber production, respectively. Analysis of polarized FTIR and XRD indicates that the polymer chain backbones of undrawn automated-track fibers are organized into hexagonal structures with kinked chain segments aligned perpendicular to the fiber axis. With increasing draw ratio, the polymer chains were pulled and extended in the draw direction, illustrated by a systematic increase in Herman's orientation factor, diminishment of the crystalline peak in XRD, increase in modulus, and reduction of max elongation. The Young's modulus of PAN nanofibers increased by 500% and the ultimate tensile strength increased by 100% as a result of increased orientation via post-drawing up to a DR4. The method of electrospinning described in this study offers an alternative means to produce nanoscale PAN fibers with altered macromolecular structures and improved mechanical strength. Current data suggest that further testing will reveal carbon fibers made from drawn precursors will have enhanced mechanical, electrical, thermal, and chemical properties. Additionally, the automated-track design is compatible with most polymers which can be spun across a parallel plate. With a simple and versatile production and processing method, enhanced electrospun polymer nanofibers can be used more frequently in wider variety applications.
Supplementary material
The supplementary material for this article can be found at https://doi.org/10.1557/mrc.2019.67
Acknowledgments
This work was made possible by funding from the National Science Foundation (NSF1561966 & NSF1653329) and the United States Army Research Laboratory (W911NF-17-2-0227)