Introduction
The desirable mechanical, chemical, physical, and biological properties of polyether ether ketone (PEEK) have led to the use of pre-formed PEEK spine cages as regular adjuvants in spine surgery.[Reference Kurtz1–Reference Rae, Brown and Orler4] Recent 3D printing technologies with affordable printers have emerged that are able to fabricate complex shapes and forms as scaffolds for tissue engineering.[Reference Do, Khorsand, Geary and Salem5–Reference An, Teoh, Suntornnond and Chua7] A combination of biomaterials and 3D printing have captivated interest in both research and clinical communities for personalized regenerative medicine.
PEEK can be printed using either fused deposition modeling (FDM) or selective laser sintering (SLS) methods.[8] In the FDM process, PEEK filament can be continuously fed into a computer numerical control-movement nozzle head and heated to a semiliquid state, then extruded onto a heated building platform. The computer-controlled nozzle can deposit a small volume of molten PEEK on a previous layer along the cross-section contour and the filling trajectory. At the same time, the extruded material rapidly solidifies (quenches) and adheres to the surrounding material to form the required complex PEEK parts. Given this unique mechanism of FDM, the nature of FDM processing manifests anisotropic characteristics of the printed materials.
PEEK is a high performance, semi-crystalline polymer, which has a number of similar mechanical properties to bone tissue. It has high melting and glass transition temperatures (T m = 340 °C, T g = 143 °C),[Reference Dizon, Espera, Chen and Advincula9] Although PEEK crystalline structure and its formation have been studied in the bulk,[Reference Jin, Ball, Bremner and Sue10,Reference Conrad, Jaekel, Kurtz and Roeder11] there is still a need for elucidation of morphology, processing, and property characterizations of 3D-printed PEEK. It is well known that annealing above the glass transition will cause structural changes to occur including an increase in the growth of the crystallite region.[Reference Talbott, Springer and Berglund12] The amorphous component of PEEK generally is transparent and exhibits lower density and higher elasticity. Its more crystalline counterparts have higher tensile strength, modulus of elasticity, and higher resistance to stress cracking. The amorphous components also lack the chemical resistance and mechanical properties that accompany the more crystalline form.
Thus, the mechanical properties of PEEK depend strongly on the crystalline domain structure and thermal deformation performance of PEEK material. Studies have shown the effect of temperature on the mechanical properties and formative fabrication precision.[Reference Wu, Geng, Zhao, Zhang, Rosen and Zhang13–Reference Bas, Grillet, Thimon and Alberola16]
The conditions of FDM technology and thermal processing strategy to print PEEK can have a significant impact on the crystallinity and mechanical properties of PEEK materials.[Reference Yang, Tian, Li, Cao, Zhao and Shi17,Reference Wu, Geng, Li, Zhao, Zhang and Zhao18]
The processing of PEEK material with FDM is challenging and critical barriers to the FDM technology need to be evaluated. This study investigates printing accuracy, crystallinity, and mechanical properties of 3D-printed PEEK with and without elevated chamber temperature and post-printing annealing.
Materials and methods
A commercially available PEEK filament with a diameter of 1.75 mm (Apium PEEK 450 Natural, Apium Additive Technologies GmbH, Karlsruhe, Deutschland, Germany) was used for all sample printings.
Preparation of 3D printing
PEEK is a moisture-sensitive material. It is important to keep the filaments from moisture contamination before and during printing. It is necessary to keep residual moisture of the filaments below 0.02% to prevent foamy extrusion due to high vapor pressure caused by traces of moisture at a high printing temperature. An air-circulating heater (Hyrel 3D Ltd., Atlanta, GA, USA) was used to dry filaments at 160 °C for 3 h before printing. Two thin layers of Nano Polymer Adhesive (Apium Additive Technologies) were applied to the clean and smooth glass of the build platform and allowed 30 s to evaporate once the platform attained a designated temperature. Mechanical testing samples were printed using Hyrel Hydra 16AS (Hyrel 3D Ltd.). Samples of the same size were also printed by two other PEEK printers, namely, Indmatec HPP 155 (Apium Additive Technologies GmbH) and Intamsys FUNMAT HT (Intamsys Technology Ltd., Shanghai, China). Parameters of the three printers are listed in Supplementary Table S1. Five replicas from each printer were fabricated for tensile, compression, and bending tests. Temperatures of the printer head and the cooling rate of an FDM printer would affect the crystallization and the mechanical properties of the printed PEEK. Printing parameters of the three printers were the same, except that the temperature of the printing chamber of Intamsys was 145 °C. The detail information of the parameters of the printers listed in the Supplementary Material section. The protocol of post-heat treatment (annealing) procedure for each sample was 160 °C for 30 min, followed by 200 °C for 2 h, and slow cooling to room temperature. All samples were printed using an oblique direction of 45° filling mode, 100% filling. The filling direction between two layers was 90°.
Mechanical tests
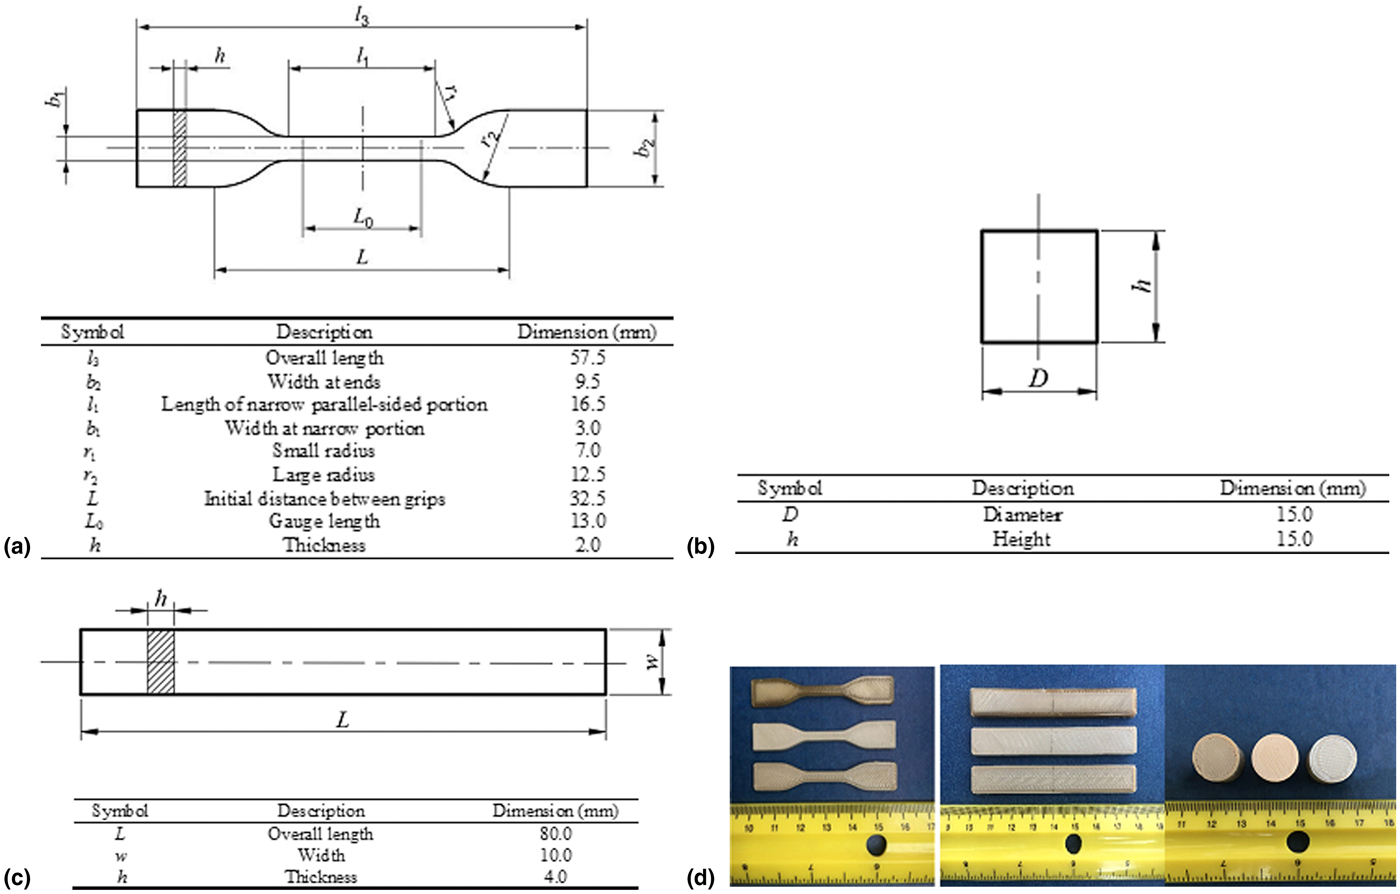
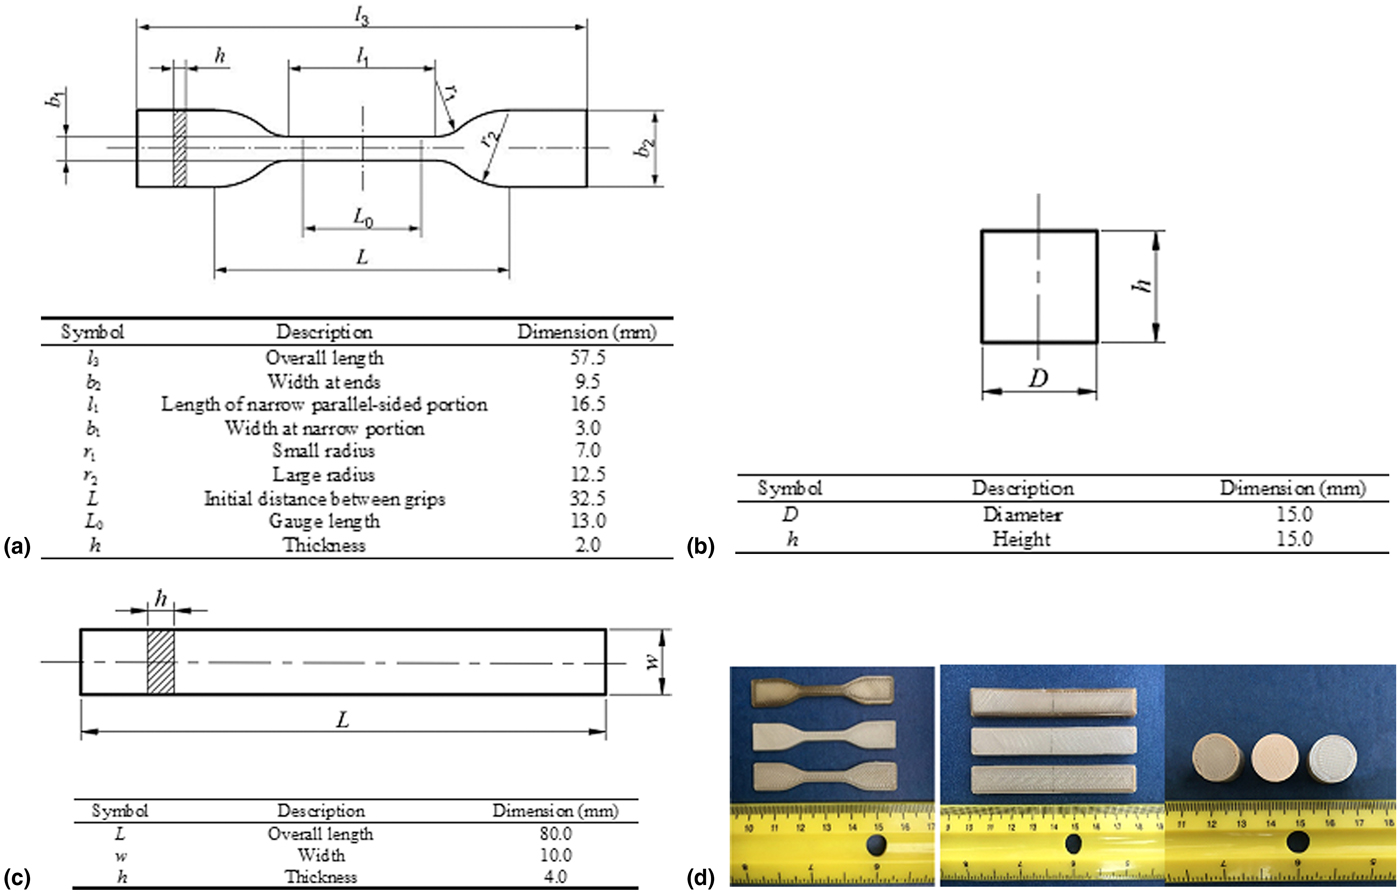
Mechanical testing samples include Mini dumb-bell-shaped tensile specimens (ASTM D638-03, Type IV), cylindrical compressive specimens (15 mm in diameter and 15 mm in height), and flexural specimens (80 mm × 10 mm × 4 mm). The geometries of the samples are shown in Figs. 1(a)–1(c). Tensile, compressive, and three-point bending tests were performed according to ASTM D638-03, ISO 604, and ISO 178 procedures, respectively. Mechanical tests were carried out using a mechanical testing machine (MTS System Inc., Minneapolis, MN, USA) at room temperature. The parameters of the testing machine were set with a 5 kN load cell with crosshead speed of 1 mm/min and a 13 mm gauge for the tensile test. The parameters for the compressive test had a 100 kN load cell with crosshead speed of 5 mm/min. For the flexural test, the load cell was 100 kN with the crosshead speed set at 1.5 mm/min, and the span between the two supports was 62 mm. Shore microhardness values were obtained from a Shore D durometer through completely depressing the durometer tip into the surface of specimens. Each specimen was sampled five times.
Geometry and dimension of specimens. (a) Tensile specimen, (b) compressive specimen, (c) flexural specimen, and (d) specimens printed with three printers from the same filament spool. Color differences are evident (Hyrel, Intamsys, and Indmatec from top to bottom or from left to right, respectively).
Fractured surfaces from the tensile specimens were evaluated by a scanning electron microscope (SEM/FIB, FEI Quanta 200, 3D Dual Beam ESEM) at an acceleration voltage of 20 kV. Specimens were notched along the centerline from the backside and subsequently immersed in liquid nitrogen for approximately 30 min. Samples were bent with two pliers creating a brittle crack from the arrested crack tip. Areas of interests were then dissected, mounted, and sputtered with gold to reduce charging. Micrographs were obtained using secondary electrons. Crystallinity of samples from each group was evaluated and calculated with its software (Diffrac Eva) on an X-ray diffractometer (Bruker D8 discover, Co Kα radiation). Scan angles of 2θ were in the range of 3.9° to 56.4°.
Thermogravimetric analysis and dynamic thermomechanical analysis
Thermogravimetric analysis (TGA) was conducted on a TA Instrument TGA 2050 (thermogravimetric analyser, Model TG2500, TA Instrument Inc., New Castle, DE, USA). Samples were heated from 25 to 600 °C under a nitrogen atmosphere at a heating rate of 10 °C/min.
Dynamic mechanical analysis (DMA) was carried out on a Thermal Analysis Q800. Each printed specimen (35 mm × 12.8 mm × 3.2 mm) from the three PEEK printers was tested under multi-frequency stress mode with 0.1 N force, 0.05% strain amplitude, and scan temperature rate of 3 °C/min. Differential scanning calorimetry (DSC) measurements were performed for fractured samples from the tensile test in a DSC 2920 machine (TA Instruments Inc., New Castle, DE, USA) under a 50 mL/min nitrogen purge. The rates of heating (20–400 °C) and cooling (400–20 °C) were the same as 10 °C/min.
Results
The summary of average means of X-, Y-, and Z-axis measurements and mechanical properties can be found in Supplementary Tables S2 and S3. Figure 1(d) shows the color differences among the samples from the three printers used with the same filament spool.
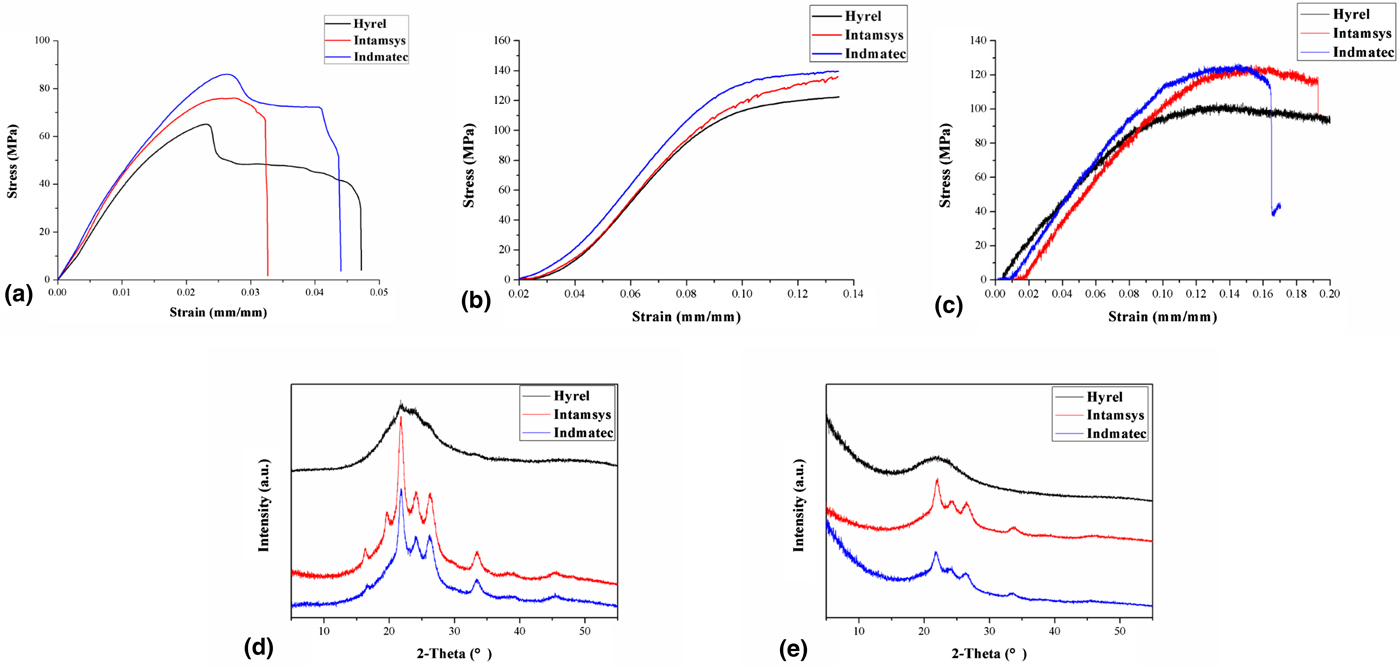
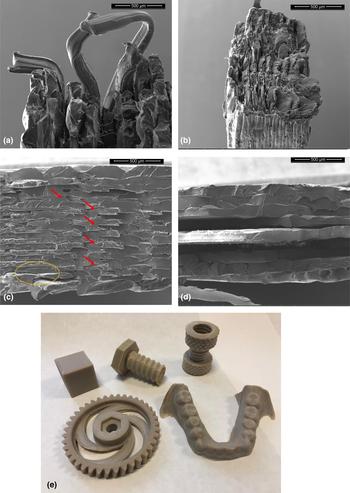
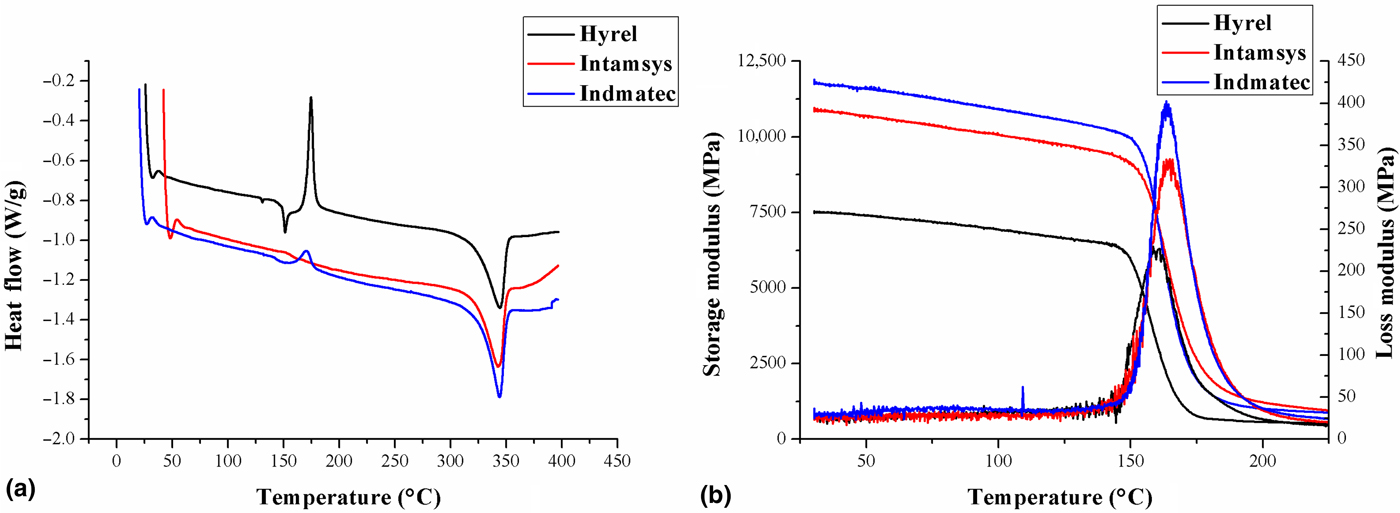
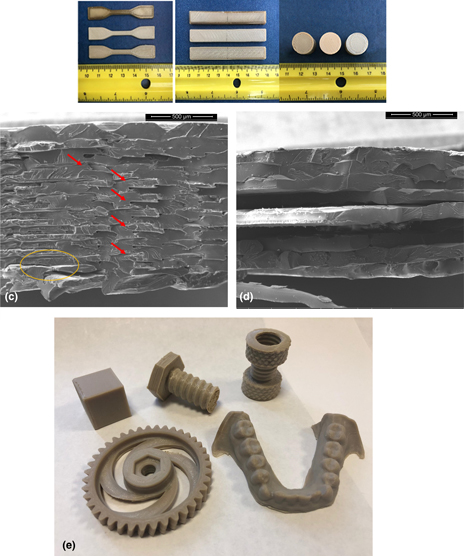
Figures 2(a)–2(c) are typical curves of fracture patterns for tensile, compressive, and bending tests. Supplementary Table S3 summarizes the summary of mechanical and physical properties of samples tested. Figures 2(d) and 2(e) show the summary of x-ray powder diffraction (XRD) results of three group samples in the near fractured areas and in the unstressed area during the tensile test. The results of Intamsys and Indmatec show very similar XRD patterns. Hyrel sample differs from the other samples in that it has lower intensity and smoother peaks, either in the near fractured areas or in the unstressed areas. The percentage of crystallinity was higher in the near fractured area than that of the unstressed area for all the samples. The summary of the crystallinity of the tensile samples for each group can be found in Supplementary Table S4. Figures 3(a)–3(d) show the fractography of tensile samples. Figure 3(e) exhibits some PEEK 3D-printed objects using the Intamsys and Indmatec printers from the same filament spool. Figures 4(a) and 4(b) show the DSC and DMA measurement results.
Mechanical properties of 3D-printed PEEK. (a) Average tensile curve, (b) average compressive curve, (c) flexural curve, (d) XRD results in unstressed area, and (e) XRD in the near fractured area of tensile samples.

SEM images of fractured surfaces and samples of 3D-printed objects. (a) Typical tensile fracture with a less degree crystallized sample. Plastic deformation of fiber-like segments are evident as residual deformation of printed filaments. (b) Typical tensile fracture of more crystallized sample. Fracture occurred as a serrated-layer fracture, meaning higher degree of crystallinity. (c) Micrography of a cryofractured sample under liquid nitrogen. Arrows are printing voids and circle shows interlayer gaps. (d) Micrography of a tensile fractured surface. Layer adhesion near surface is better than that of the layers at the center resulting from the annealing effect. (e) PEEK 3D-printed objects using the three printers from the same filament spool.

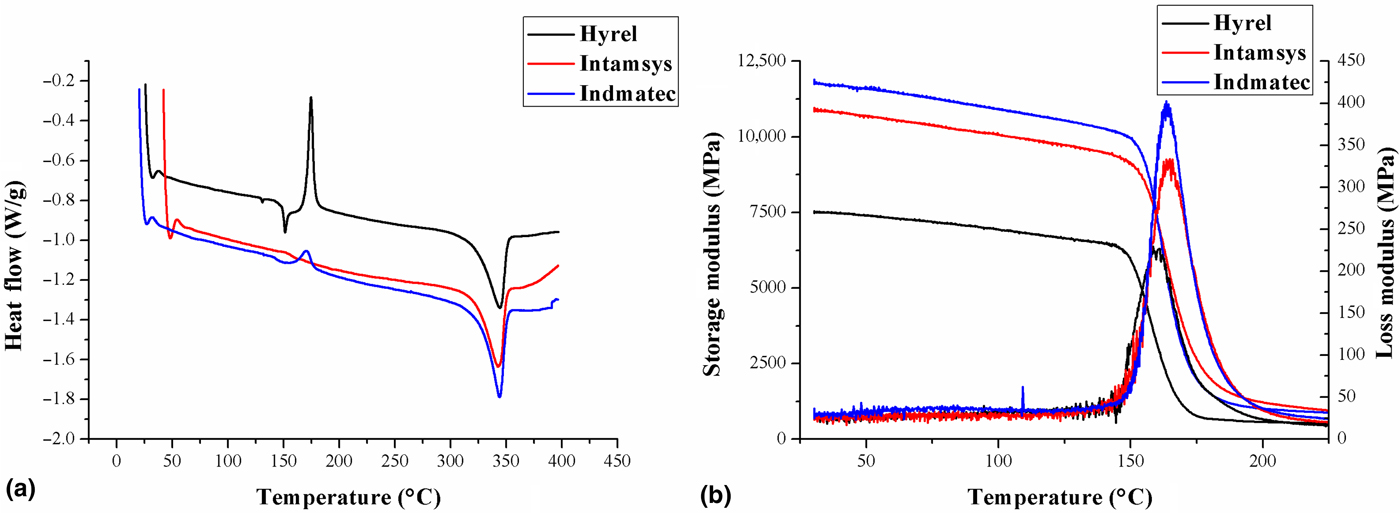
Thermal properties analysis of samples printed from three different printers. (a) DSC data and (b) DMA data.
Discussion
Our results show the printing process provided less accuracy in the z-axis direction and in more complex geometric areas (narrow area of tensile samples) because PEEK has a relatively high glass transition temperature and melting point compared to other polymers. Other factors, such as the viscosity of extruded PEEK at the tip of the nozzle, heating condition of the platform, chamber temperature, software of the 3D printers, and solidification shrinkage, are also important for the accuracy of PEEK printing.
The tensile, compressive, and flexural strength values of our room temperature prints by the Hyrel printer were higher than those printed at ambient temperature as reported by others.[Reference Yang, Tian, Li, Cao, Zhao and Shi17–Reference Valentan, Kadivnik, Brajlih, Anderson and Drstvensek19] This may be attributed by our post-printing annealing procedure. Our data show that mean yield strength ranged from 66.3% of 25 °C printed samples to 85.7% of 145 °C printed samples of reported tensile strength comparing to a Victrex® PEEK 450G.[8] The flexural strength and the compressive strength of our samples printed at elevated temperature of the annealed groups are comparable to the manufacturer's reported value of 125 MPa of PEEK 450G. Samples printed at elevated temperature had an average of 30% higher tensile values than those printed at ambient temperature. These findings are consistent with other studies.[Reference Yang, Tian, Li, Cao, Zhao and Shi17,Reference Wu, Geng, Li, Zhao, Zhang and Zhao18] Our study shows that annealing resulted in an obvious enhancement of yield strength and elastic modulus, and conversely a decrease in elongation. This phenomenon can be explained as a gain in material crystallinity, which has been reported previously.[Reference Yang, Tian, Li, Cao, Zhao and Shi17] Because PEEK is a two-phase material, its mechanical strength is dominated by its crystalline phase. Therefore, a higher crystallinity will lead to a higher mechanical strength and lower elongation.[Reference Chivers and Moore20] Our results show that adjusting the chamber temperature and post-heat treatment could improve the bonding strength or equilibration between printed layers, ultimately improving the mechanical properties and the printing precision of PEEK.
Because the percentages of tensile elongation of our PEEK samples are from 12.3% to 21.2%, the microvoids or gaps between 3D-printed layers on a fractured surface would be distorted from the necking effect during the tensile test. In order to observe original geometries on a cross-sectioned surface of the printed layers by FDM (Fig. 3(c)), a cryofracture technique was used to create a brittle fracture of the PEEK samples for SEM observation and failure analysis of microvoids, cleavage and cracking of the fracture surface of the material.
The observed tensile fractographic patterns were consistent with other studies[Reference Yang, Tian, Li, Cao, Zhao and Shi17,Reference Vaezi and Shoufeng21] where fracture initiates at printing gaps and void nucleation at the inclusion/flaws (arrows and circle in Fig. 3(c)) leads to the formation of large parabolic features, until it reaches a fast fracture region between layers (Fig. 3(d)). Each layer of PEEK samples was printed 90° to the adjacent layer. In brief, the Mode I failure of unidirection is generally characterized by cohesive fracturing[Reference Arkhireyeva and Hashemi22,Reference El-Qoubaa and Othman23] of each printed PEEK layer and separation of interlayers. The fractured surfaces often appear rather flat in each layer at high magnification and exhibit serrated features among the layers. The microcracks initiate and grow in the interlayer gaps and ultimately on individual PEEK layers in the plane subjected to the maximum resolved tensile stress. Fracture under the tensile test appeared as Mode II and mixed-mode I/II interlayer failures because of the printing angulation between layers. Figure 3(a) shows fiber-like ductile fracture of more amorphous material (Hyrel sample) as well as serrated interlayer cracks with a higher crystallinity Intamsys sample in Fig. 3(b).
There were more interlayer fractures in the layers at the center of the samples and less in the surface layers to a large extent controlled by better interlayer bonding from heat treatment. Other factors such as viscosity of molten PEEK, chamber condition, cooling rate, and post-annealing condition are also of great importance. A detailed examination of the fracture surfaces is often helpful in understanding the mechanisms that govern the interlayer fracture of laminated PEEK printed by FDM. There is a need to understand how thermo-mechanical factors regulate the behavior of materials during the 3D printing process. Nevertheless, the 3D-printed objects appear to be within reasonable resolution and achieve near fidelity over the original CAD design (Fig. 3(e)), but will be of higher scrutiny with the printing of much smaller objects.
It is difficult to perform absolute DSC to establish crystallinity and melt temperatures because the sample crystallinity increases during the scan. Our DSC data provide comparative information of samples from the three-tested printers. DSC data show very similar melting peak near 350 °C. However, the crystallization peak at 160 °C is very different among different printers. The sample from Hyrel has a sharp and large crystallization peak, the sample from Indmatec has a much smaller, yet obvious peak, while the peak disappears in the sample from Intamsys. This shows that 3D-printed PEEK from Hyrel had the lowest the degree of crystallinity, while samples printed from Intamsys had the highest crystallinity. This is as expected since the chamber temperature in Hyrel was set at room temperature, which provided fast cooling and very limited time for extruded polymer chains of PEEK to orient and crystallize. The chamber temperature in Intamsys was 145 °C, and thus the cooling rate (quenching) is much lower and allowed more time for polymer chains to crystallize and equilibrate. The Indmatec printer has an “adaptive heating system,” which helped the crystallization of PEEK, but not as much as that of Intamsys.
In the DMA data, the storage modulus of samples from Intamsys and Indmatec are close to each other, but are both much higher than that of the sample printed from Hyrel. This is consistent with the DSC data. The highly oriented structure in crystal regions provides stronger mechanical properties than do the amorphous region. The higher crystallinity in Intamsys- and Indmatec-printed samples has a storage modulus around 11,300 MPa, much higher than that of Hyrel-printed samples, approximately 7500 MPa. The same trend is observed in T g. Intamsys- and Indmatec-printed samples have a T g of around 180 °C, and Hyrel-printed sample has a T g of around 170 °C. The lower T g is also due to the less oriented chains in the amorphous region, which provides more free space for chain segments to move. Changes in the T g of samples with different degrees of crystallinity indicated that the non-crystalline regions were also affected by the annealing process.
In the XRD patterns, the characteristic peak intensity of Intamsys showed slightly higher than Indmatec, but significantly higher than Hyrel. The higher intensity indicates a higher level of crystallinity. The XRD results are in agreement with the DSC results. The reason why crystallinity in the near fractured areas higher than unstressed areas is because the length of PEEK polymer at fractured areas increased, while the width and thickness decreased after an uniaxial tensile test. This process makes the molecular chain point to the direction of force under the influence of an external force.
Multiple factors, such as printing parameters, quality of printers, control of material processing, and the degree of crystallinity, all affect mechanical, physical, and chemical properties of FDM-printed PEEK. To date, the use of almost all of the 3D-printed devices were cleared by the FDA under emergency circumstances or through the conventional 510(k) pathway, a process which can by-pass clinical trials as long as the device can be demonstrated to be “largely equivalent to a legally marketed device.” High-risk Class III devices, such as bioprinted tissue implants comprising biological materials, are subject to a higher standard of regulation and clinical trials for pre-market approval (PMA).[Reference Di Prima, Coburn, Hwang, Kell, Khairuzzaman and Ricles24,25] To date, there is no single 3D-printed medical device with the PMA approval. Important considerations for evaluating 3D-printed devices are the effect of building orientation and location on final device performance, including mechanical and physical properties, processing validation of the 3D-printing system to ensure consistency between printing jobs and characterization of materials before and after printing. Because of the technological limitations of 3D printing,[Reference Di Prima, Coburn, Hwang, Kell, Khairuzzaman and Ricles24] the safety, mechanical properties, and quality of customized medical devices and implants made from various printers must be addressed and properly rectified. As the 3D printing technology advances and more valid information of printed PEEK are available to clinicians, researchers, and manufacturers, there is an urgent need for printing the protocol and stands to assure the safety and efficacy of using PEEK as printed bioimplants.
Conclusions
PEEK samples were printed using fused deposition modeling and evaluated in terms of their dimensional accuracy, crystallinity, and mechanical properties. The development of mechanical properties is directly related to the crystallinity content and therefore to the processing conditions. A thermal processing strategy using elevated chamber temperature and post-printing annealing in this study shows that 3D printing accuracy and control of mechanical properties can be achieved. Furthermore, processing conditions have a significant impact on fracture failures. Variations in material properties from three printers are evident. Spatial accuracy of 3D printing by FDM may need further improvement comparing to sterolithograph and SLS. 3D-printed biomedical implants and devices usually have complex shapes and forms. They may not be suitable for the conventional ASTM/ISO test standards. Test standards of 3D-printed materials, products, or devices may need established by each application for future FDA regulations. It is important for this highly customizable manufacturing process to ensure safety and effectiveness for biomedical applications.
Acknowledgment
The work was partially supported by the James Hayward Research Fund. K.C acknowledges the support from the International Training Fund of the Zhejiang University of Technology.
Supplementary material
The supplementary material for this article can be found at https://doi.org/10.1557/mrc.2019.86.