1. Introduction
Carbonate platform sediments undergo sedimentary differentiation under the action of long-term prevailing winds (Han et al. Reference Han, Tian, Hu, Liu, Wang, Huan and Feng2020; Hu et al. Reference Hu, Zhang, Jiang, Wang, Han and Algeo2020a, Reference Hu, Zhang, Tian, Wang, Han, Wang, Li, Feng, Han and Algeo2020b; Hu et al. Reference Hu, Han, Ma, Deng and Zhao2022). Anisotropy of magnetic susceptibility (AMS) has been widely used as an indicator of paleowind or paleocurrent directions (Lagroix & Banerjee, Reference Lagroix and Banerjee2002; Nawrocki et al. Reference Nawrocki, Gozhik, Lanczont, Panczyk, Komar, Bogucki, Williams and Czupyt2018; Hu et al. Reference Hu, Zhang, Jiang, Wang, Han and Algeo2020a, Reference Hu, Zhang, Tian, Wang, Han, Wang, Li, Feng, Han and Algeo2020b). Hydrodynamic experiments have demonstrated the influence of wind or water motion on grain orientation (Rees & Woodall, Reference Rees and Woodall1975; Tarling & Hrouda, Reference Tarling and Hrouda1993; Hu et al. Reference Hu, Zhang, Feng, Wang, Jiang and Jiao2017; Zhang-YF et al. Reference Zhang, Hu, Wang, Wang, Jiang and Li2017; Zhang-YF et al. Reference Zhang, Hu, Wang, Ma, Wang and Jiang2018). Under calm conditions, the maximum AMS axes are randomly distributed. Under a strong unidirectional flow, oblate particles tend to produce an imbricate fabric in the direction of the flow and elongated particles are aligned parallel to the direction of transport. Under bidirectional flow, elongated grains may align perpendicular to the directions of fluid movement (Rees & Woodall, Reference Rees and Woodall1975; Tarling & Hrouda, Reference Tarling and Hrouda1993; Hu et al. Reference Hu, Zhang, Feng, Wang, Jiang and Jiao2017). This study reconstructed paleowind directions during each epoch of the Cambrian–Ordovician the Yangtze Carbonate Platform (YCP) using sedimentary differentiation and AMS analysis.
The YCP was located in the low-latitude trade winds belt during the Cambrian–Ordovician, and marine carbonates were deposited there (Li et al. Reference Li, Li, Wang and Kiessling2015; Zhang et al. Reference Zhang, Song, Jiang, Jiang, Jia, Huang, Wen, Liu, Xie, Liu, Wang, Shan and Wu2019; Cheng et al. Reference Cheng, Li, Zhang, Liu, Peng, Hou, Wen, Xia, Wang, Liu, Zhong, Huang, Liu, Yuan and Yao2020). Like other platforms, the YCP was subjected to extensive global transgression during the Cambrian (Dalziel, Reference Dalziel2014; Chang et al. Reference Chang, Chu, Feng, Huang and Chen2018; Zhai et al. Reference Zhai, Wu, Ye, Zhang and Wang2018; Wu et al. Reference Wu, Tian, Li, Li and Ji2021). The water in the ocean was warm and conducive to the growth and development of marine organisms (Peters & Gaines, Reference Peters and Gaines2012; Karlstrom et al. Reference Karlstrom, Hagadorn, Gehrels, Matthews, Schmitz, Madronich, Mulder, Pecha, Giesler and Crossey2018; Wood et al. Reference Wood, Liu, Bowyer, Wilby, Dunn, Kenchington, Hoyal Cuthill, Mitchell and Penny2019). Numerous organisms began to emerge during this time, and some primitive invertebrates gradually evolved into invertebrates with hard shells; this phenomenon is known as the ‘Cambrian Explosion’ (Jin et al. Reference Jin, Li, Algeo, Planavsky, Cui, Yang, Zhao, Zhang and Xie2016; Aria & Caron, Reference Aria and Caron2019; Hoyal Cuthill et al. Reference Hoyal Cuthill, Guttenberg and Budd2020). As part of the most extensive transgression in the Early Paleozoic, conditions during the Ordovician favoured the further development of invertebrates (Kröger, Reference Kröger2018; Stigall et al. Reference Stigall, Edwards, Freeman and Rasmussen2019; Fang et al. Reference Fang, Li, Zhang, Song and Zhang2020; Harper et al. Reference Harper, Cascales-Miñana, Kroeck and Servais2021). The paleoecology and biological evolution of the YCP during the Cambrian–Ordovician have been extensively investigated (e.g. Li et al. Reference Li, Li, Wang and Kiessling2015; Lee & Riding, Reference Lee and Riding2018; Zheng et al. Reference Zheng, Clausen, Feng and Servais2020), but studies on its paleogeography and paleoclimate are scarce (e.g. Torsvik & Cocks, Reference Torsvik, Cocks, Harper and Servais2013; Zhang et al. Reference Zhang, Li, Li, Kiessling and Wang2016; Cocks & Torsvik, Reference Cocks and Torsvik2021). The paleogeography and paleoclimate influence paleoecology and biological evolution in a region, and therefore, it is necessary to comprehensively understand these aspects.
Most scholars hold that the YCP was located in low-latitude area of the Northern and Southern hemispheres during the Cambrian–Ordovician. Some scholars hold that the YCP drifted from the Southern Hemisphere (∼12°S) to the Northern Hemisphere (∼11°N), then back to the Southern Hemisphere (∼49°S), and finally drifted to the Northern Hemisphere (∼7°N) from the Middle Cambrian to the Middle Ordovician (e.g. Huang et al. Reference Huang, Zhu, Otofuji and Yang2000). Other scholars believe that the platform first drifted southward across the equator from the Northern Hemisphere (∼13°N) to the Southern Hemisphere (∼28°S) and then drifted northward to a location near the equator from the Early Cambrian to the Late Ordovician (e.g. Torsvik & Cocks, Reference Torsvik, Cocks, Harper and Servais2013; Cocks & Torsvik, Reference Cocks and Torsvik2021). The paleogeographic constraints (paleomagnetic or otherwise) are testable based on the expected paleoclimate conditions, especially the paleowind directions. The paleo-coordinate framework during the Cambrian–Ordovician in the trade wind belt indicates that the prevailing winds in the Northern and Southern hemispheres at the time were from northeast and from southeast, respectively (Kajtar et al. Reference Kajtar, Santoso, McGregor, England and Baillie2018; Helfer et al. Reference Helfer, Nuijens, De Roode and Siebesma2020, Reference Helfer, Nuijens and Dixit2021). On the whole, there is no consensus regarding the specific paleogeographic site and orientation of the YCP (Huang et al. Reference Huang, Zhu, Otofuji and Yang2000; Popov et al. Reference Popov, Bassett, Zhemchuzhnikov, Holmer and Klishevich2009; Nardin et al. Reference Nardin, Goddéris, Donnadieu, Hir, Blakey, Pucéat and Aretz2011; Torsvik & Cocks, Reference Torsvik, Cocks, Harper and Servais2013; Cocks & Torsvik, Reference Cocks and Torsvik2021; Harper et al. Reference Harper, Cascales-Miñana, Kroeck and Servais2021). These conflicting proposals emphasize the need to reconstruct paleowind directions.
The present study conducted an integrated analysis of bed- to platform-scale variations in sediments based on outcrop data to quantitatively reconstruct paleowind directions. One novel feature of the present study is the inclusion of quantitative measurements of sediment properties potentially influenced by the wind and wind-generated currents, such as bedding thickness and grain size and sorting, across the YCP. The aims of the present study were to (1) quantitatively reconstruct paleowind directions over the YCP during the Cambrian–Ordovician and (2) constrain the paleogeographic location of the YCP. The results of the present study can serve as a reference for the integrated use of sedimentological and AMS data for the recognition of paleowind directions over ancient carbonate platforms.
2. Geological setting
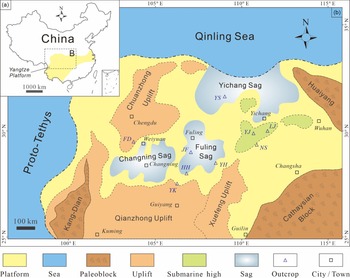
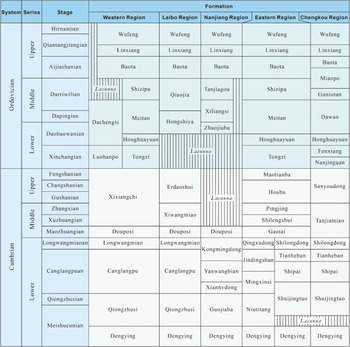
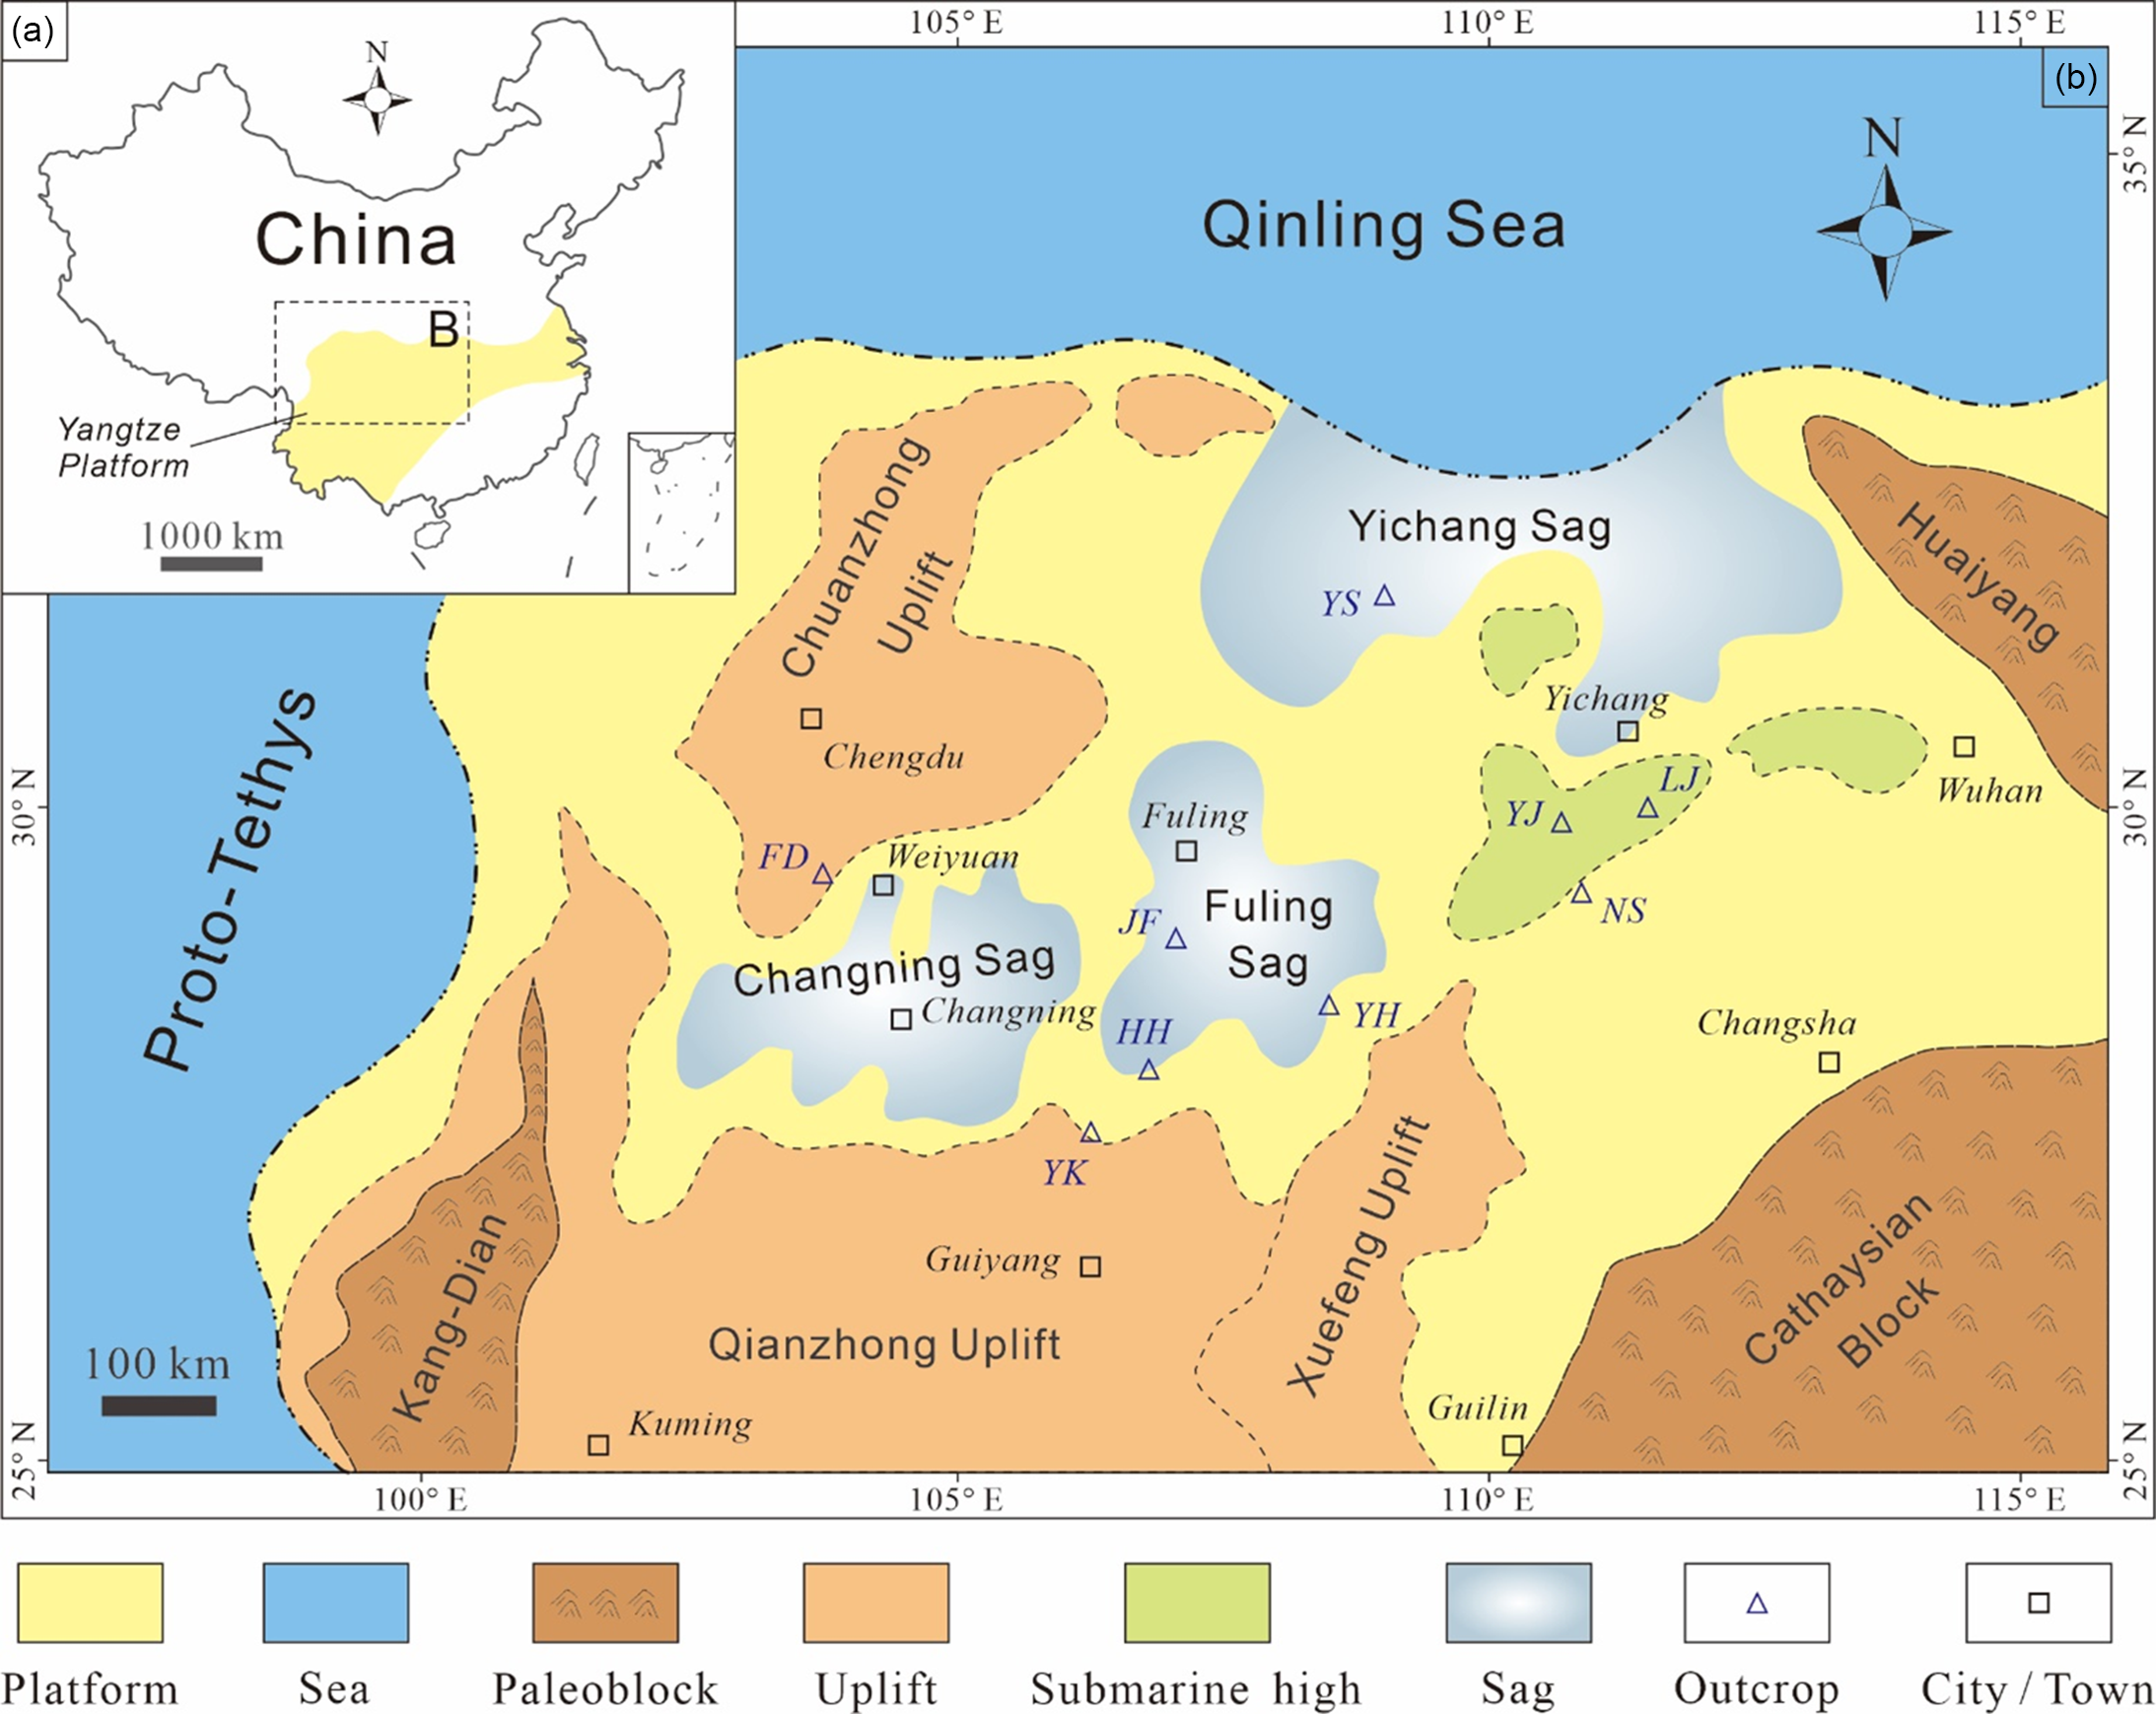
The Sichuan Basin is a gas-bearing superimposed basin (with complex structure due to vertical stacking of different structural layers) that occupies an area of ∼1.9 × 10⁵ km2. It is mainly distributed in Sichuan Province and Chongqing City, the southern part of Shaanxi, eastern portion of Guizhou and western part of Hubei. The basin is bounded by the Micang and Daba mountains in the north, the Daliang and Loushan mountains in the south, the Longmen Mountains in the west and Qiyao Mountain in the east (Liu et al. Reference Liu, Yang, Deng, Zhong, Wen, Sun, Li, Jansa, Li, Song, Zhang and Peng2021; Cheng et al. Reference Cheng, Ding, Pan, Zou, Li, Yin and Ding2022; Dong et al. Reference Dong, Han, Santosh, Qiu, Liu, Ma, He and Hu2022). The Sichuan Basin is situated on a basement of pre-Sinian metamorphic and igneous rocks and contains marine and continental strata with the thickness of 6–12 km (Shi et al. Reference Shi, Cao, Selby, Tan, Luo and Hu2020; Zhao et al. Reference Zhao, Hu, Wang, Li, Tan, She, Zhang, Qiao and Wang2020; Miao et al. Reference Miao, Pei, Su, Sheng, Feng, Jiang, Liang and Hong2022). This study primarily focused on marine carbonate deposits in the YCP region, where the Sichuan Basin was located during the Cambrian–Ordovician (Figs. 1, 2).
Regional index map showing the study area. (a) Simplified map of China showing the location of the YCP (after Chen et al. Reference Chen, Rong, Li and Boucot2004). (b) Paleogeographic map of the YCP during the Late Ordovician, showing the outcrop locations used in the present study (after Chen et al. Reference Chen, Rong, Li and Boucot2004). Detailed information of the nine outcrops (LJ, FD, YK, YS, NY, YJ, HH, JF, NS and YH) is provided in Table S1.
Cambrian–Ordovician stratigraphy in the Sichuan Basin area of the YCP (after Yang et al. Reference Yang, Xie, Wei, Liu, Zeng, Xie and Jin2012).

2.a. Tectonic setting
The Sichuan Basin was in an extensional tectonic setting from the Late Sinian to the Early Cambrian, during which time the Tongwan tectonic event established the paleogeomorphic framework of this basin (Wang et al. Reference Wang, Jiang, Wang, Lu, Gu, Xu, Yang and Xu2014; Che et al. Reference Che, Tan, Deng and Jin2019; Zhou et al. Reference Zhou, Yang, Ji, Zhou and Zhang2020). This tectonic event caused the episodic uplift of the crust, and each portion of this basin underwent varying degrees of uplift and subsidence; furthermore, the platform region underwent several episodes of denudation, which occurred in varying degrees. Moreover, under the influence of the extensional regime, the Deyang-Anyue Rift Tough developed in the western area, and the region as a whole exhibited a north–south-oriented uplift and depression pattern (Liu et al. Reference Liu, Deng, Jansa, Zhong, Sun, Song, Wang, Wu, Li and Tian2017; Jin et al. Reference Jin, Li, Zhu, Dai, Jiang, Wu, Li and Yang2020; Li et al. Reference Li, He, Li, Li, Wo, Li and Huang2020). The Deyang-Anyue Rift Trough formed due to the early tectonic event and entered a stage of compensatory deposition. The basin was filled with a set of thick-bedded deposits dominated by shales whose sedimentary provenance indicated that they originated from the west and north (Liu et al. Reference Liu, Liu, Li and Liu2020; Zhao et al. Reference Zhao, Hu, Wang, Li, Tan, She, Zhang, Qiao and Wang2020; Wang et al. Reference Wang, Wang, Yan, Zhang, Li and Ma2021).
During the deposition of the Canglangpu Formation, the amplitude of vertical tectonic event decreased considerably, the uplift and depression pattern began to disappear, and the basin paleogeomorphology gradually transformed from the pattern of alternating uplift and depression to that of a shelf with a gentle slope from west to east. The Canglangpu Formation, which consists of sandy shale mixed with limestone and dolostone, was deposited in this environment. During the Middle-Late Cambrian, this area was characterized by semi-restricted and restricted lagoon; the seawater receded and the paleo-uplift further developed during this time. From the Douposi Formation, the depositional environment gradually changed to a carbonate platform (Figs. 1, 2; Fu et al. Reference Fu, Hu, Xu, Zhao, Shi and Zeng2020; Li et al. Reference Li, Chen, Yan, Dai, Xi and He2021; Zhang et al. Reference Zhang, Wang, Zhang, Wei, Wang, Zhang, Ma, Wei, He, Ma and Zhu2022).
The Sichuan Basin is dominated by carbonate deposits; it was covered by a wide epicontinental sea from the Early to the Late Ordovician (Zhu et al. Reference Zhu, Zhang, Liu, Xing, He, Zhang and Liu2018; He et al. Reference He, Wang and Chen2019; Yang et al. Reference Yang, Zuo, Fu, Qiu, Li, Zhang, Zheng and Zhang2022). Owing to the Guangxi tectonic event, the convergence of the block intensified, and the Yangtze Block was subducted and compressed by the Cathaysia Block in the southeast (Ge et al. Reference Ge, Mou, Yu, Liu, Men and He2019; Wang et al. Reference Wang, Li, Wang, Jiang, Chen, Ma and Dai2019; Huang et al. Reference Huang, He, Li, Li, Zhang and Chen2020). The surrounding paleo-lands of the Sichuan Basin were uplifted. The Qianzhong Paleo-land was connected with Xuefeng Paleo-land. The Kangdian and Chuanzhong paleo-lands were expanded. At this juncture, the passive continental margin began to transform into a foreland basin, low-energy and undercompensated depositional basins enclosed by uplifts began to form within the plate (Wang et al. Reference Wang, Li, Wang, Jiang, Chen, Ma and Dai2019; Men et al. Reference Men, Mou, Ge and Wang2020; Lu et al. Reference Lu, Qiu, Zhang, Li and Tao2021). Lithofacies analysis indicated that the carbonate deposits were replaced by terrigenous clastic deposits. The early limestone deposits of the Baota and Linxiang formations were overlain by the black shale deposits of the Wufeng and Longmaxi formations from the Late Ordovician to the Early Silurian (Figs. 1, 2; Chen et al. Reference Chen, Rong, Li and Boucot2004; Liang et al. Reference Liang, Jiang, Yang and Wei2012; Huang et al. Reference Huang, He, Li, Li, Zhang and Chen2020).
2.b. Stratigraphy
The Cambrian–Ordovician strata in the Sichuan Basin and its adjacent areas differ greatly in different regions. The Cambrian strata are dominated by terrigenous clastic deposits in the west and marine carbonate deposits in the east (Wang et al. Reference Wang, Guan, Feng and Bao2013; Zhang et al. Reference Zhang, Song, Jiang, Jiang, Jia, Huang, Wen, Liu, Xie, Liu, Wang, Shan and Wu2019; Xi et al. Reference Xi, Tang, Zhang, Lash and Ye2022). The thickness of the Cambrian succession is ∼100–1500 m, whereas the strata in the western part of the basin are thinner (∼100–500 m) because of the later denudation. The strata in the central part of the basin have a medium thickness of ∼500–1200 m. The strata in the eastern part of the basin are thicker, reaching ∼1500 m (Liu et al. Reference Liu, Tan, Li, Cao and Luo2018; Li et al. Reference Li, Li, Li, Liu, Su and Yan2022; Wang et al. Reference Wang, Wang and Zeng2022). The western area contains the Lower Cambrian Dengying, Qiongzhusi, Canglangpu and Longwangmiao formations, the Middle Cambrian Gaotai Formation and the Upper Cambrian Xixiangchi Formation from bottom to top. Thick layers of shale, clastic rock and various carbonate rocks have been deposited (Yang et al. Reference Yang, Xie, Wei, Liu, Zeng, Xie and Jin2012; Gu et al. Reference Gu, Yin, Yuan, Bo, Liang, Zhang and Zhang2015; Gao et al. Reference Gao, Li, Lash, Yan, Zhou and Xiao2021).
The Ordovician strata have inherited the characteristics of the Cambrian succession, with the depositional basement being high in the west and low in the east, and the sediments being coarse in the west and fine in the east. The stratigraphic thickness of the Ordovician succession is less than that of the Cambrian succession. The stratigraphic thickness of the Ordovician succession is ∼0–800 m; the Ordovician strata have undergone denudation, especially in the western part of the basin (Wang et al. Reference Wang, Dong, Huang, Li and Wang2016; Zhu et al. Reference Zhu, Zhang, Liu, Xing, He, Zhang and Liu2018; Yang et al. Reference Yang, Zuo, Fu, Qiu, Li, Zhang, Zheng and Zhang2022). The western area contains the Lower Ordovician Tongzi and Honghuayuan formations, the Middle Ordovician Meitan and Shizipu formations and the Upper Ordovician Baota, Linxiang and Wufeng formations from bottom to top. A succession of carbonate rocks, mixtites and shales has been deposited here (Figs. 1, 2; Yang et al. Reference Yang, Xie, Wei, Liu, Zeng, Xie and Jin2012; Zhu et al. Reference Zhu, Chen, Liu, Shi, Wu, Luo, Yang, Yang and Zou2021; Miao et al. Reference Miao, Pei, Su, Sheng, Feng, Jiang, Liang and Hong2022).
2.c. Carbonate microfacies and depositional environments
Several depositional environments, such as restricted platform, open platform and platform margin, are seen in the Cambrian–Ordovician system (Yang et al. Reference Yang, Xie, Wei, Liu, Zeng, Xie and Jin2012; Li et al. Reference Li, Tan, Zhao, Liu, Xia and Luo2013; Zhang et al. Reference Zhang, Li, Li, Kiessling and Wang2016; Zeng et al. Reference Zeng, Zhao, Xu, Fu, Hu, Wang and Li2018). The restricted platform can be divided into three subtypes (tidal flat, lagoon and intraplatform shoal); it is mainly developed in the Lower Cambrian Longwangmiao Formation, the Middle Cambrian Gaotai Formation and the Upper Cambrian Xixiangchi Formation. The rocks of this depositional environment primarily consist of light grey-dark grey micritic dolomite, sandy dolomite and argillaceous dolomite, along with doloarenite, dolorudite, oolitic dolomite and gypsum dolomite (Li et al. Reference Li, Yu and Deng2012; Liu et al. Reference Liu, Tan, Li, Cao and Luo2018; Wang et al. Reference Wang, Wang and Zeng2022).
The open platform, which is developed in the Cambrian–Ordovician system, can be divided into the intraplatform shoal and intershoal marine subtypes. The deposits consist of medium-thick stratified light grey and grey micritic limestone, oolitic limestone, argillaceous limestone and intraclastic and bioclastic limestone. The intraplatform shoal subtypes can be divided into sand shoals, oolitic shoals and bioclastic shoals. The intershoal marine subtypes is a relatively low-energy region between intraplatform shoals of the open platform. The sedimentary rocks are dominated by grey and dark grey thin to medium-thick stratified micritic limestone, along with argillaceous limestone, mud-bearing limestone and bioclastic micritic limestone. Moreover, horizontal bedding is developed and foraminifers, bivalves, gastropods and other biogenic fossils are seen (Yang et al. Reference Yang, Xie, Wei, Liu, Zeng, Xie and Jin2012; Li et al. Reference Li, Fan, Jia, Lu, Zhang, Li and Deng2019; Ren et al. Reference Ren, Zhong, Gao, Sun, Peng, Zheng and Qiu2019).
The platform margin is mainly developed in the Ordovician and is distributed along the eastern margin of the Sichuan Basin. The beds are thicker than those of other belts, and the deposits in this region primarily consist of oolitic limestone, oolitic dolomite, micrite dolomite, arenaceous limestone and small amounts of micritic limestone. The platform margin shoal often shows a convex up shape in the vertical plane because of its rapid growth (Figs. 1, 2; Zhao et al. Reference Zhao, Shen, Zhou, Wang and Lu2014; Zhao et al. Reference Zhao, Wei, Yang, Mo, Xie, Su, Liu, Zeng and Wu2017; Gu et al. Reference Gu, Lonergan, Zhai, Zhang and Lu2021).
3. Sampling and methods
3.a. Field methods and sample collection
A total of nine field sites in the Sichuan Basin [the Liujiachang (LJ), Fandian (FD), Yankong (YK), Yangsiqiao (YS), Yangjiaping (YJ), Honghuayuan (HH), Jinfoshan (JF), Nanshanping (NS) and Yanhe (YH) outcrops] were investigated (Fig, 1b). A total of 390 samples were collected at ∼17 m intervals through the 1130 m thick Shuijingtuo-Linxiang formations at the LJ site, the 650 m thick Qiongzhusi-Xixiangchi formations at the FD site, the 820 m thick Niutitang-Maotianba formations at the YK site, the 270 m thick Shuijingtuo-Sanyoudong formations at the YS site, the 2330 m thick Niutitang-Maotianba formations at the YJ site, the 440 m thick Tongzi-Wufeng formations at the HH site, the 300 m thick Tongzi-Wufeng formations at the JF site, the 520 m thick Tongzi-Baota formations at the NS site and the 170 m thick Tongzi-Wufeng formations at the YH site (Fig. 2). Detailed field descriptions were made at each site, and numerous measurements and outcrop photographs were obtained. Thin sections of the samples collected at each site were prepared for petrographic analysis (Table S1).
3.b. Microfacies analysis
A total of 390 outcrop samples were prepared for thin-section analysis and examined on a standard petrographic microscope (Carl Zeiss Axio Scope A1) using transmitted light microscopy (Table S1). The samples were impregnated with blue resin to highlight porosity and stained with Alizarin Red S for carbonate mineral determination. Mineral identification procedures followed the Rock Thin-Section Identification Standard SY/T 5368-2016 (Luo et al. Reference Luo, Shao, Yan, Wang, Wang, Yang, Wang, Song, Cui, Wang and Man2016). Grain content was calculated by point counting using a 20 × 30 grid (n = 600 observations per sample). For particulate sediments (i.e. grainstones), sediment properties such as grain size, roundness and sorting were quantified (Tables S2–S5; Zhou et al. Reference Zhou, Jiang, Quaye, Duan, Hu, Liu and Han2018; Hu et al. Reference Hu, Zhang, Jiang, Wang and Han2021; Tang et al. Reference Tang, Hu, Dan, Han and Liu2022; Hu et al. Reference Hu, Han, Tian, Fu, Ma and Algeo2023b). Samples were evaluated using standard descriptive and interpretative criteria (Wilson et al. Reference Wilson, Tucker, Crevello, Sarg, Read and Tucker1990; Wright, Reference Wright1992; Tucker & Wright, Reference Tucker and Wright2009; Flügel, Reference Flügel2013). Sedimentary differentiation analysis conducted in the present study was based on observations of lithology, bedding, sedimentary textures and grain types (including size, roundness and sorting properties) in outcrops and thin sections.
3.c. Magnetic fabric analysis
A total of 1399 fresh samples for magnetic fabric analysis were collected at ∼5 m intervals using a portable mini-core drill (D026-C) and an insertable magnetic compass. Magnetic samples were taken from all nine field sites (LJ = 274, FD = 140, YK = 149, YS = 133, YJ = 137, HH = 139, JF = 144, NS = 135 and YH = 148) (Fig. 1b; Table S1). Each core sample had a diameter of 25 mm and was trimmed to a length of 22 mm to maintain a uniform sample volume. After preparation, the magnetic susceptibility of each sample was measured using a magnetic susceptibility metre [HKB-1 (High-accuracy Kappa Bridge-1); field strength: 300 A/m; field frequency: 920 Hz; power: AC, 220 V/110 V, 50/60 Hz and 15 W; sensitivity: 2 × 10⁻¹² m3] with an automated sample handling system. Each sample was measured three times along orthogonal planes.
AMS analyses are used to study variations in the magnetic susceptibility field of a sample within a three-dimensional (3D) orthogonal framework (Lagroix & Banerjee, Reference Lagroix and Banerjee2004; Zhang et al. Reference Zhang, Kravchinsky, Zhu and Yue2010; Zhao et al. Reference Zhao, Hu, Han, Dong and Yuan2023). The AMS of a sample is typically reported in terms of Kmax, Kint and Kmin values, representing the lengths of the maximum, intermediate and minimum principal axes of the 3D AMS ellipsoid, respectively; D-Kmax, D-Kint and D-Kmin values, representing their respective declinations; and I-Kmax, I-Kint and I-Kmin values, representing their respective inclinations. Superposition of ferromagnetic, paramagnetic and diamagnetic grain properties yields the total AMS signal (Zhu et al. Reference Zhu, Liu and Jackson2004; Nawrocki et al. Reference Nawrocki, Gozhik, Lanczont, Panczyk, Komar, Bogucki, Williams and Czupyt2018).
The values of Kmax, Kint and Kmin can be combined in various ways to describe the ellipsoid shape and features of the magnetic fabric of a sample (Jelinek, Reference Jelinek1981; Lagroix & Banerjee, Reference Lagroix and Banerjee2004; Gong et al. Reference Gong, Zhang, Yue, Zhang and Li2015). The magnetic parameters developed for this purpose are as follows:
 $${\rm{Lineation}}\left( {\rm{L}} \right) = {{\rm{K}}_{{\rm{max}}}}/{{\rm{K}}_{{\rm{int}}}}\;$$
 $${\rm{Foliation}}\left( {\rm{F}} \right) = {{\rm{K}}_{{\rm{int}}}}/{{\rm{K}}_{{\rm{min}}}}$$
 $${\rm{Degree\ of\ anisotropy}}\left( {\rm{P}} \right) = {{\rm{K}}_{{\rm{max}}}}/{{\rm{K}}_{{\rm{min}}}}$$
 $${\rm{Shape\ factor}}\left( {\rm{T}} \right) = (2\eta 2 - \eta 1 - \eta 3)/(\eta 1 - \eta 3)$$
where η1, η2 and η3 are ln (Kmax), ln (Kint) and ln (Kmin), respectively.
The parameters F12 and F23, which are used to evaluate the statistical significance of the lineation and the foliation, were determined following the technique of Lagroix and Banerjee (Reference Lagroix and Banerjee2004) using (1) epsilon ϵ12, the half-angle uncertainty of Kmax in the plane joining Kmax and Kint, and (2) epsilon ϵ23, the half-angle uncertainty of Kint in the plane joining Kint and Kmin. All of the above parameters were calculated using the Safyr and Anisoft software packages (Constable & Tauxe, Reference Constable and Tauxe1990).
The geographic orientations of the principal AMS axes were plotted on stereonets for visualization. The sample set was then screened to isolate the most significant Kmax declination using the technique of Lagroix and Banerjee (Reference Lagroix and Banerjee2004) and Zhu et al. (Reference Zhu, Liu and Jackson2004). All D-Kmax with F12 < 4 and ϵ12 > 22.5° were rejected to eliminate noise. Rejection of samples with F12 < 4 yielded a confidence ratio of 1.0 for the intermediate and minimum susceptibility axes of the lineation axis, and rejection of samples with ϵ12 > 22.5° yielded a confidence ratio of 1.0 for the maximum and intermediate susceptibility axes in the foliation plane. I-Kmin was another parameter used in screening AMS data; values of I-Kmin > 70° generally correspond to undisturbed (low degree of reworking) sediments with an oblate magnetic fabric (Lagroix & Banerjee, Reference Lagroix and Banerjee2004; Nawrocki et al. Reference Nawrocki, Gozhik, Lanczont, Panczyk, Komar, Bogucki, Williams and Czupyt2018; Hu et al. Reference Hu, Zhang, Jiang, Wang, Han and Algeo2020a, Reference Hu, Zhang, Tian, Wang, Han, Wang, Li, Feng, Han and Algeo2020b).
4. Results
4.a. Sedimentary differentiation
Previous studies reported on the general microfacies analysis of Cambrian–Ordovician carbonate facies in the YCP (e.g. Zou et al. Reference Zou, Fang, Zhang and Zhang2017; Tan et al. Reference Tan, Shi, Tian, Wang and Wang2018; Zhang-SC et al. Reference Zhang, He, Hu, Mi, Ma, Liu and Tang2018; Zhai et al. Reference Zhai, Li, Jiao, Wang, Liu, Xu, Wang, Chen and Guo2019; Fu et al. Reference Fu, Hu, Xu, Zhao, Shi and Zeng2020; Gao et al. Reference Gao, Li, Lash, Yan, Zhou and Xiao2021). The present study focused on oolitic and intraclastic grainstones with the aim of identifying sedimentary differentiation due to prevailing wind directions.
4.a.1. Oolitic grainstone
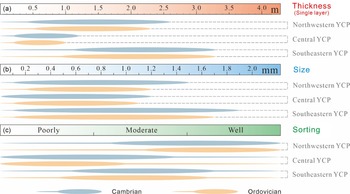
The northwestern, central and southeastern portions of the YCP exhibited differences in the thicknesses of oolitic grainstone beds as well as in the size and sorting of ooids (Fig. 3; Tables S2, S3). The northwestern margin is characterized by moderately sorted to well-sorted ooids that accumulated in a northwest-facing windward environment. In contrast, the southeastern margin shows poorly to moderately sorted sediments (Table 1; Fig. 3). The energy levels at the northwestern margin were relatively high, whereas those at the southeastern margin were relatively low. The southeastern margin has greater bedding thicknesses and ooid grain diameters, and it is inferred to have possessed the optimal growth environment for ooids (Zhang-YY et al. Reference Zhang, Li, Wang and Munnecke2017; Hu et al. Reference Hu, Zhang, Jiang, Wang, Han and Algeo2020a).
Diagram summarizing the variations in the approximate bedding thickness (a), ooid size (b) and sorting (c) of Cambrian–Ordovician oolitic grainstone.

Comparison of the main sedimentary characteristics for different Cambrian–Ordovician sites

4.a.2. Intraclastic grainstone
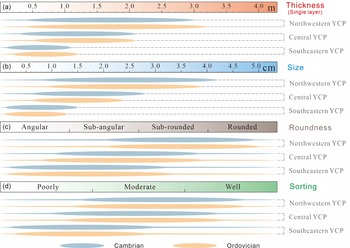
Quantitative measurements of intraclastic grainstone samples from the Cambrian–Ordovician indicated differences in the thickness of intraclastic grainstone beds, as well as in the size, roundness and sorting of intraclasts among the northwestern, central and southeastern regions of the YCP (Fig. 4; Tables S4, S5). The northwestern margin is characterized by moderately sorted to well-sorted and sub-angular to rounded intraclasts that accumulated in a northwest-facing windward environment. In contrast, the southeastern margin shows poorly to moderately sorted sediments with angular to sub-rounded grains (Table 1; Fig. 4). The energy levels at the northwestern margin were relatively high, whereas those at the southeastern margin were relatively low (Hu et al. Reference Hu, Zhang, Jiang, Wang, Han and Algeo2020a, Reference Hu, Zhang, Tian, Wang, Han, Wang, Li, Feng, Han and Algeo2020b; Hu et al. Reference Hu, Han, Ma, Wang, Zhao and Sun2023a).
Diagram summarizing the variations in approximate bedding thickness (a), intraclast size (b), roundness (c) and sorting (d) of the Cambrian–Ordovician intraclastic grainstone.

4.b. AMS
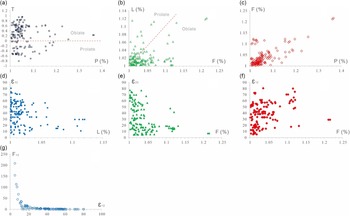
Most of the samples collected at all locales in the present study exhibited an oblate magnetic fabric (Fig. 5a, b, Figures S2–S3; Lagroix & Banerjee, Reference Lagroix and Banerjee2004; Hu et al. Reference Hu, Zhang, Jiang, Wang, Han and Algeo2020a, Reference Hu, Zhang, Tian, Wang, Han, Wang, Li, Feng, Han and Algeo2020b). The observed ratio of the degree of anisotropy (P) to foliation (F) was consistent with a subordinate role for lineation (L) (Fig. 5c, Figure S4). These features are typical of sediments deposited by wind or water currents (Lagroix & Banerjee, Reference Lagroix and Banerjee2004; Nawrocki et al. Reference Nawrocki, Gozhik, Lanczont, Panczyk, Komar, Bogucki, Williams and Czupyt2018). Inverse relationships were observed between ϵ12 and L (Fig. 5d, Figure S5) and between ϵ23 and F (Fig. 5e, Figure S6), which resulted from increased measurement errors for weak lineations and foliations, respectively. In contrast, the absence of a correlation between ϵ12 and F suggested that the lineation and foliation subfabrics were probably defined by the orientations of different minerals (Fig. 5f, g, Figures S7–S8).
Relationships between the AMS parameters of (a) P and T, (b) F and L, (c) P and F, (d) L and ϵ12, (e) F and ϵ23, (f) F and ϵ12, and (g) ϵ12 and F12 for the Ordovician units at the YH outcrop (n = 148). The results for other outcrops (i.e. LJ, FD, YK, YS, YJ, HH, JF and NS) are provided in Figures S2–S8.

4.b.1. AMS for each Cambrian series
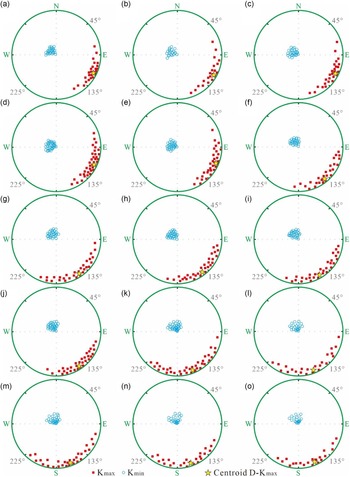
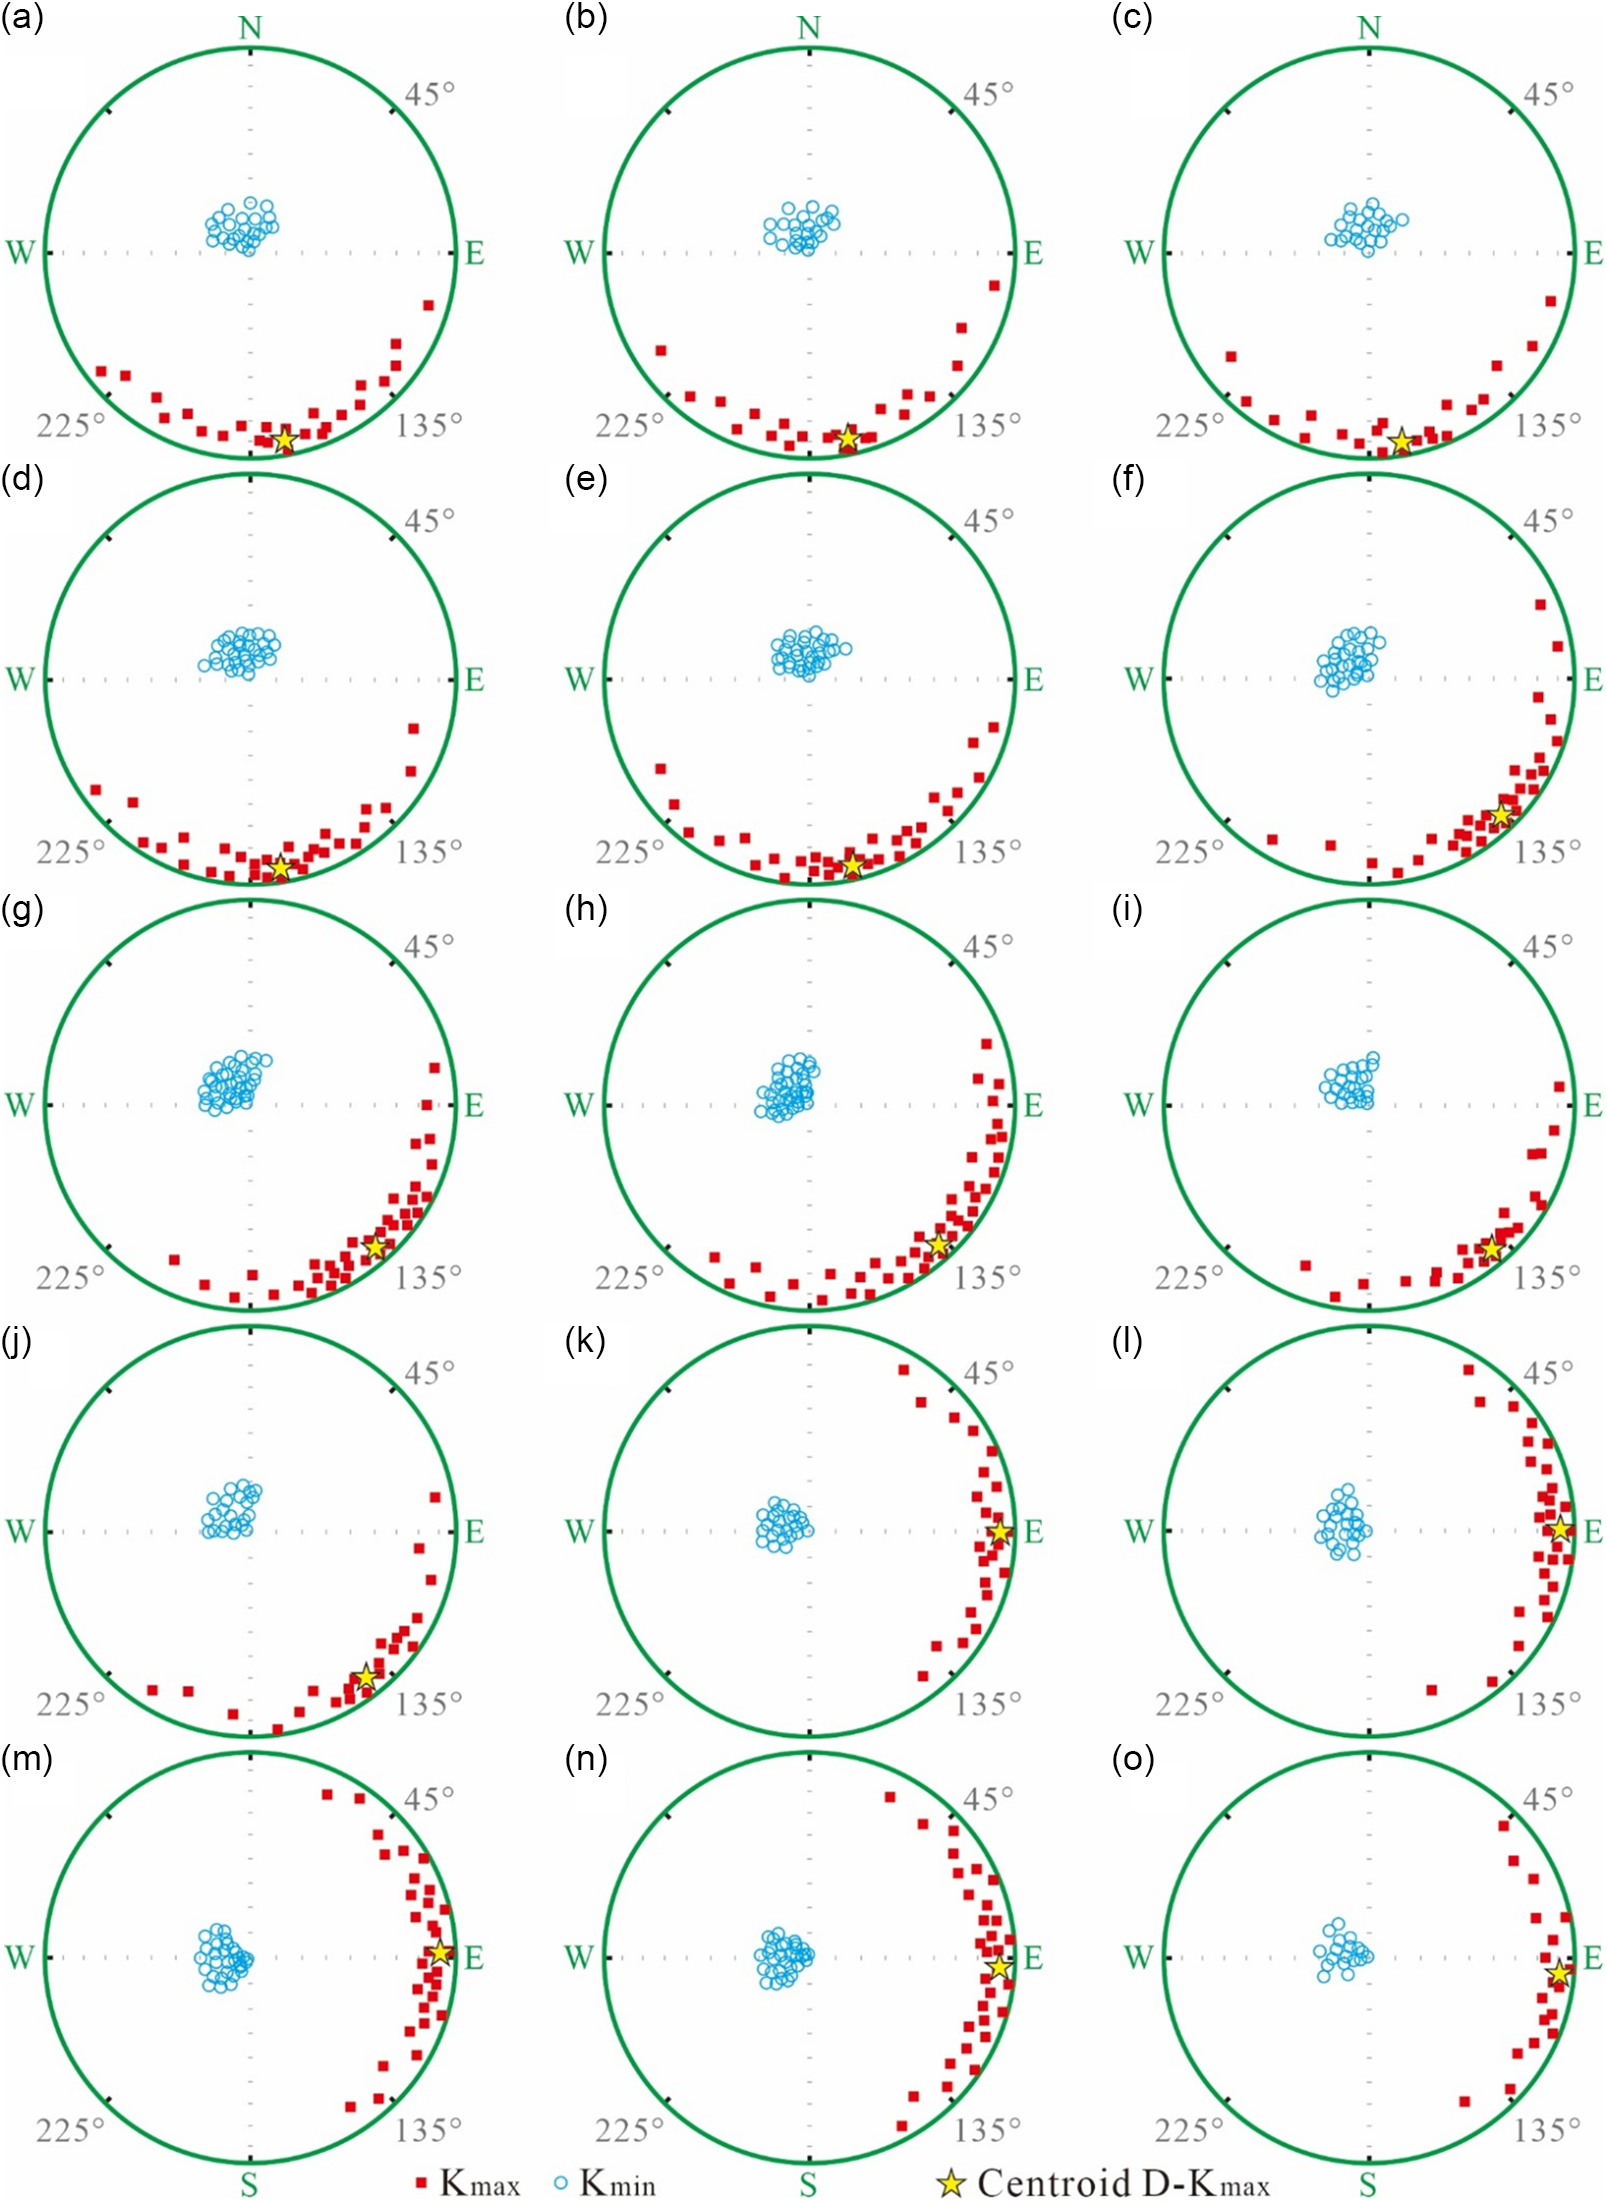
The robustness of statistical calculations was increased by limiting calculations to Cambrian samples, for which F12 > 4, ϵ12 < 22.5° and I-Kmin > 70° (Table 2; Fig. 6, Figure S9). The screened sample sets of each Cambrian series yielded Kmax values with different preferred orientations for each of the five target outcrops (Table 3; Fig. 6, Figure S9). A centroid statistical approach was applied in the Safyr and Anisoft software to assess the distribution of Kmax values for the screened sample set of each outcrop. This approach was used to determine the dominant orientations. When the inclination is not considered, the centroid statistical diagram only magnifies variations in Kmax declinations. The centroid D-Kmax values of the Lower Cambrian samples were 116° at LJ, 119° at FD, 117° at YK, 115° at YS and 113° at YJ. The centroid D-Kmax values of the Middle Cambrian samples were 141° at LJ, 146° at FD, 143° at YK, 149° at YS and 146° at YJ. The centroid D-Kmax values of the Upper Cambrian samples were 158° at LJ, 159° at FD, 160° at YK, 161° at YS and 157° at YJ (modern coordinates; Table 3; Fig. 6, Figure S9).

Equal-area projections (modern coordinates) of AMS principal axes of selected samples (according to criteria for which F12 > 4, ϵ12 < 22.5°, and I-Kmin > 70°) for each Cambrian series from the five outcrops. (a) Lower Cambrian at the LJ outcrop (n = 26). (b) Lower Cambrian at the FD outcrop (n = 21). (c) Lower Cambrian at the YK outcrop (n = 27). (d) Lower Cambrian at the YS outcrop (n = 37). (e) Lower Cambrian at the YJ outcrop (n = 31). (f) Middle Cambrian at the LJ outcrop (n = 26). (g) Middle Cambrian at the FD outcrop (n = 29). (h) Middle Cambrian at the YK outcrop (n = 31). (i) Middle Cambrian at the YS outcrop (n = 30). (j) Middle Cambrian at the YJ outcrop (n = 31). (k) Upper Cambrian at the LJ outcrop (n = 35). (l) Upper Cambrian at the FD outcrop (n = 23). (m) Upper Cambrian at the YK outcrop (n = 29). (n) Upper Cambrian at the YS outcrop (n = 24). (o) Upper Cambrian at the YJ outcrop (n = 20). Kmax = maximum principal axes of the 3D AMS ellipsoid; Kmin = minimum principal axes of the 3D AMS ellipsoid; and D-Kmax = declination of the maximum principal axes of the 3D AMS ellipsoid.

Maximum AMS axis (Kmax) with different preferred orientations and centroid D-Kmax values for each of the five study outcrops for each Cambrian series. Detailed information is provided in Fig. 6

4.b.2. AMS for each Ordovician series
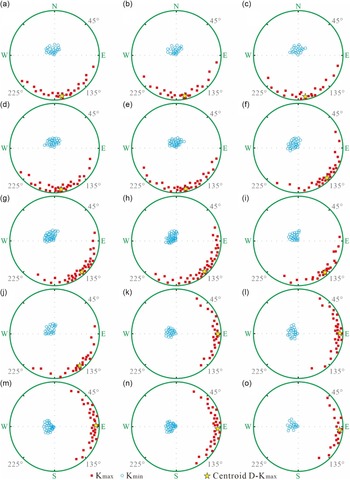
Statistical robustness was ensured in the present study by limiting calculations to samples of the Ordovician, for which F12 > 4, ϵ12 < 22.5° and I-Kmin > 70° (Table 4; Fig. 7, Figure S10). The screened sample sets of each Ordovician series yielded Kmax values with different preferred orientations for each of the five target outcrops (Table 5; Fig. 7, Figure S10). The centroid D-Kmax values of the Lower Ordovician samples were 169° at LJ, 168° at HH, 170° at JF, 171° at NS and 167° at YH. The centroid D-Kmax values of the Middle Ordovician samples were 136° at LJ, 139° at HH, 138° at JF, 140° at NS and 142° at YH. The centroid D-Kmax values of the Upper Ordovician samples were 90° at LJ, 89° at HH, 88° at JF, 93° at NS and 95° at YH (modern coordinates; Table 5; Fig. 7, Figure S10).

Equal-area projections (modern coordinates) of AMS principal axes of selected samples (according to criteria for which F12 > 4, ϵ12 < 22.5° and I-Kmin > 70°) for each Ordovician series from the five outcrops. (a) Lower Ordovician at the LJ outcrop (n = 24). (b) Lower Ordovician at the HH outcrop (n = 23). (c) Lower Ordovician at the JF outcrop (n = 22). (d) Lower Ordovician at the NS outcrop (n = 30). (e) Lower Ordovician at the YH outcrop (n = 32). (f) Middle Ordovician at the LJ outcrop (n = 30). (g) Middle Ordovician at the HH outcrop (n = 36). (h) Middle Ordovician at the JF outcrop (n = 40). (i) Middle Ordovician at the NS outcrop (n = 24). (j) Middle Ordovician at the YH outcrop (n = 23). (k) Upper Ordovician at the LJ outcrop (n = 24). (l) Upper Ordovician at the HH outcrop (n = 28). (m) Upper Ordovician at the JF outcrop (n = 30). (n) Upper Ordovician at the NS outcrop (n = 31). (o) Upper Ordovician at the YH outcrop (n = 18). Kmax = maximum principal axes of the 3D AMS ellipsoid; Kmin = minimum principal axes of the 3D AMS ellipsoid; and D-Kmax = declination of maximum principal axes of the 3D AMS ellipsoid.
Maximum AMS axis (Kmax) with different preferred orientations and centroid D-Kmax values for each of the five study outcrops for each Ordovician series. Detailed information is provided in Fig. 7

5. Discussion
5.a. Qualitative reconstruction of paleowind directions
Carbonate platform sediments undergo sedimentary differentiation under the action of long-term prevailing winds. Patterns of wind-related facies have been studied in several modern marine systems, among which the best-studied are the those in the Bahamas and Florida Keys (Kindler & Strasser, Reference Kindler and Strasser2000; Rankey et al. Reference Rankey, Riegl and Steffen2006; Rankey & Reeder, Reference Rankey and Reeder2011). The dominant winds in the Bahamas are the northeasterly trade winds, and coral reefs form on the margins of the northeast-facing windward platform (e.g. eastern side of Andros Island). In contrast, oolitic shoals accumulate on the southwest-facing leeward margins (Principaud et al. Reference Principaud, Mulder, Gillet and Borgomano2015; Dravis & Wanless, Reference Dravis and Wanless2017). Patterns of wind-related facies have also been studied in ancient carbonate platforms. For example, paleowind analysis was conducted on the Cambrian–Ordovician Shanganning Carbonate Platform of the North China Craton (Hu et al. Reference Hu, Zhang, Jiang, Wang, Han and Algeo2020a, Reference Hu, Zhang, Tian, Wang, Han, Wang, Li, Feng, Han and Algeo2020b). The study utilized a combination of microfacies analysis and AMS data to evaluate wind-related controls and documented metazoan reefs consisting of corals, stromatoporoids and sponges on the windward platform margin and oolitic grainstones and microbial reefs on the leeward margin (Hu et al. Reference Hu, Zhang, Jiang, Wang, Han and Algeo2020a, Reference Hu, Zhang, Tian, Wang, Han, Wang, Li, Feng, Han and Algeo2020b).
The sedimentary differentiation of oolitic and intraclastic grainstones described above qualitatively indicates the general wind direction in the present study (Table 1; Figs. 3, 4). The spatial distribution of specific microfacies and sediment types shows a polarity across the YCP, which helps distinguish between the windward and leeward margins of the platform. Oolitic sands dominate the leeward margins of platforms, and water in these areas originates from the platform interior and is relatively warm and partially degassed (Principaud et al. Reference Principaud, Mulder, Gillet and Borgomano2015; Dravis & Wanless, Reference Dravis and Wanless2017; Zhang-YY et al. Reference Zhang, Li, Wang and Munnecke2017; Hu et al. Reference Hu, Zhang, Jiang, Wang, Han and Algeo2020a, Reference Hu, Zhang, Tian, Wang, Han, Wang, Li, Feng, Han and Algeo2020b; Hu et al. Reference Hu, Han, Ma, Wang, Zhao and Sun2023a). Therefore, the observed polarity of facies across the YCP is consistent with strong paleowinds, presumably the trade winds, which originate from the northwest (modern coordinates).
5.b. Quantitative reconstruction of paleowind directions
AMS can be used to determine the prevailing paleowind directions (Zhang et al. Reference Zhang, Kravchinsky, Zhu and Yue2010; Nawrocki et al. Reference Nawrocki, Gozhik, Lanczont, Panczyk, Komar, Bogucki, Williams and Czupyt2018; Hu et al. Reference Hu, Zhang, Jiang, Wang, Han and Algeo2020a, Reference Hu, Zhang, Tian, Wang, Han, Wang, Li, Feng, Han and Algeo2020b; Hu et al. Reference Hu, Han, Ma, Deng and Zhao2022; Hu et al. Reference Hu, Han, Ma, Wang, Zhao and Sun2023a). Examples in previous studies include the reconstruction of the route of the paleomonsoon along a west-to-east transect in the Chinese Loess Plateau using AMS (Zhang et al. Reference Zhang, Kravchinsky, Zhu and Yue2010), and reconstruction of paleowind directions and sources of detrital material archived in the Roxolany loess section, southern Ukraine (Nawrocki et al. Reference Nawrocki, Gozhik, Lanczont, Panczyk, Komar, Bogucki, Williams and Czupyt2018). The AMS orientations of the study samples could be explained based on a model of strong unidirectional flow (Fig. S1B; Tarling & Hrouda, Reference Tarling and Hrouda1993; Hu et al. Reference Hu, Zhang, Jiang, Wang, Han and Algeo2020a, Reference Hu, Zhang, Tian, Wang, Han, Wang, Li, Feng, Han and Algeo2020b), which demonstrated the greatest agreement with the distribution of data in the current study (Figs. 6, 7). Most grains in this model were oriented parallel to the unidirectional flow (Fig. S1B; Tarling & Hrouda, Reference Tarling and Hrouda1993; Hu et al. Reference Hu, Zhang, Jiang, Wang, Han and Algeo2020a, Reference Hu, Zhang, Tian, Wang, Han, Wang, Li, Feng, Han and Algeo2020b). However, paleocurrent directions antipodal to (i.e. 180° away from) the estimated current vectors cannot be excluded given the shallowness of the observed AMS Kmax inclinations (< 20°; Figs. 6, 7; Hu et al. Reference Hu, Zhang, Jiang, Wang, Han and Algeo2020a, Reference Hu, Zhang, Tian, Wang, Han, Wang, Li, Feng, Han and Algeo2020b; Hu et al. Reference Hu, Han, Ma, Wang, Zhao and Sun2023a).
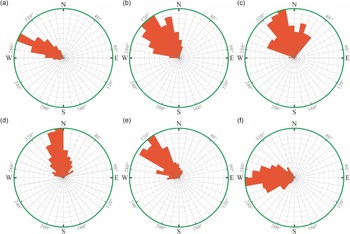
Two opposite paleowind directions can be roughly determined based on the AMS results obtained herein. The paleomagnetic results of the Early, Middle and Late Cambrian were 116° ± 52°, 145° ± 57° and 159° ± 62°, respectively (Table 3; Fig. 6), with paleowind directions of 116° ± 52°, 145° ± 57° and 159° ± 62°, respectively, or 296° ± 52°, 325° ± 57° and 339° ± 62°, respectively (modern coordinates; Fig. 8a–c). The paleomagnetic results of the Early, Middle and Late Ordovician were 169° ± 70°, 139° ± 73° and 91° ± 68°, respectively (Table 5; Fig. 7), with paleowind directions of 169° ± 70°, 139° ± 73° and 91° ± 68°, respectively, or 349° ± 70°, 319° ± 73° and 271° ± 68°, respectively (modern coordinates; Fig. 8d–f). The final quantitative prevailing paleowind directions can be determined by combining information on the sedimentary differentiation (see section 5.a). The paleowind directions of the Early, Middle and Late Cambrian were 296° ± 52°, 325° ± 57° and 339° ± 62°, respectively (modern coordinates; Fig .8a–c). The paleowind directions of the Early, Middle and Late Ordovician were 349° ± 70°, 319° ± 73° and 271° ± 68°, respectively (modern coordinates; Fig. 8d–f).
Comprehensively interpretative rose diagram showing the prevailing paleowind directions for each epoch of the Cambrian–Ordovician. (a) Early Cambrian. (b) Middle Cambrian. (c) Late Cambrian. (d) Early Ordovician. (e) Middle Ordovician. (f) Late Ordovician.

Marine carbonate platforms are generally located within the trade winds belt at low latitudes (such as The Bahamas, Great Barrier Reef and Shanganning Carbonate Platform). These areas were affected by the prevailing paleowind direction throughout the year, with sedimentary differentiation following a specific trend (Orpin & Ridd, Reference Orpin and Ridd2012; Puga-Bernabéu et al. Reference Puga-Bernabéu, Webster, Beaman and Guilbaud2013; Principaud et al. Reference Principaud, Mulder, Gillet and Borgomano2015; Dravis & Wanless, Reference Dravis and Wanless2017; Hu et al. Reference Hu, Zhang, Jiang, Wang, Han and Algeo2020a, Reference Hu, Zhang, Tian, Wang, Han, Wang, Li, Feng, Han and Algeo2020b). Although sedimentary differentiation cannot be used to quantitatively reconstruct the paleowind directions, it can be used to determine the approximate orientation. Although AMS cannot be used to determine the general orientation of paleowind direction, its quantitative ability can compensate for the non-quantification of sedimentary differentiation. The complementarity of sedimentary differentiation and AMS allows for the quantitative determination of the prevailing paleowind directions, thereby providing a theoretical basis for the study of Cambrian–Ordovician paleoclimate in this area.
5.c. Significance of paleowind directions for paleogeography
The prevailing paleowind direction acted to regulate sedimentary differentiation in the three zones of the YCP, which had important paleogeographic implications. The YCP was located in the low latitudes during the Cambrian–Ordovician (Huang et al. Reference Huang, Zhu, Otofuji and Yang2000; Popov et al. Reference Popov, Bassett, Zhemchuzhnikov, Holmer and Klishevich2009; Nardin et al. Reference Nardin, Goddéris, Donnadieu, Hir, Blakey, Pucéat and Aretz2011; Torsvik & Cocks, Reference Torsvik, Cocks, Harper and Servais2013; Cocks & Torsvik, Reference Cocks and Torsvik2021; Harper et al. Reference Harper, Cascales-Miñana, Kroeck and Servais2021). However, its exact position remains a matter of debate due to the lack of sufficient palaeomagnetic data. The determination of the position of the YCP would refine the current knowledge of the prevailing wind direction by as much as 90°, since trade winds in the Northern Hemisphere blow from northeast to southwest, whereas those in the Southern Hemisphere blow from southeast to northwest (Kajtar et al. Reference Kajtar, Santoso, McGregor, England and Baillie2018; Helfer et al. Reference Helfer, Nuijens, De Roode and Siebesma2020, Reference Helfer, Nuijens and Dixit2021). The present geographic orientation of the Yangtze Block indicates that the prevailing paleowind directions were from the northwest, north and west (Tables 3, 5; Fig. 8). Therefore, the Yangtze Block has rotated after the Ordovician.
The prevailing wind directions of the trade winds belt change slightly for different positions. The prevailing wind direction is nearly south (155°–180°) when positioned far from the Equator in the Southern Hemisphere and nearly east (90°–115°) when near the Equator in the Southern Hemisphere (Kajtar et al. Reference Kajtar, Santoso, McGregor, England and Baillie2018; Helfer et al. Reference Helfer, Nuijens, De Roode and Siebesma2020, Reference Helfer, Nuijens and Dixit2021). The YCP was located at latitudes of ∼24°S, ∼28°S, ∼21°S during the Late Cambrian, Early Ordovician and Middle Ordovician, respectively (Torsvik & Cocks, Reference Torsvik, Cocks, Harper and Servais2013; Cocks & Torsvik, Reference Cocks and Torsvik2021). The relevant paleowind directions are ∼170°, ∼177° and ∼165°; all directions are approximate values, but all are slightly less than 180° (paleo-coordinates). This study provides evidence for the paleogeography of the YCP during the Cambrian–Ordovician in terms of the prevailing paleowind directions over the YCP and the trade winds in the Northern and Southern hemispheres (southeast wind in the Southern Hemisphere and northeast wind in the Northern Hemisphere). For the Early Cambrian, the samples collected for this study were concentrated in the upper part of the Lower Cambrian, so the measurement results only correspond to the late stage of the Early Cambrian. For the Late Ordovician, the samples collected for this study were concentrated in the lower part of the Upper Ordovician, so the measurement results only correspond to the early stage of the Late Ordovician.
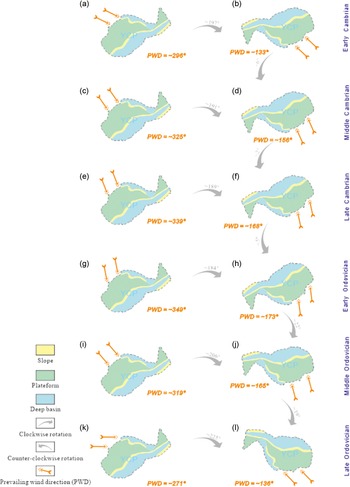
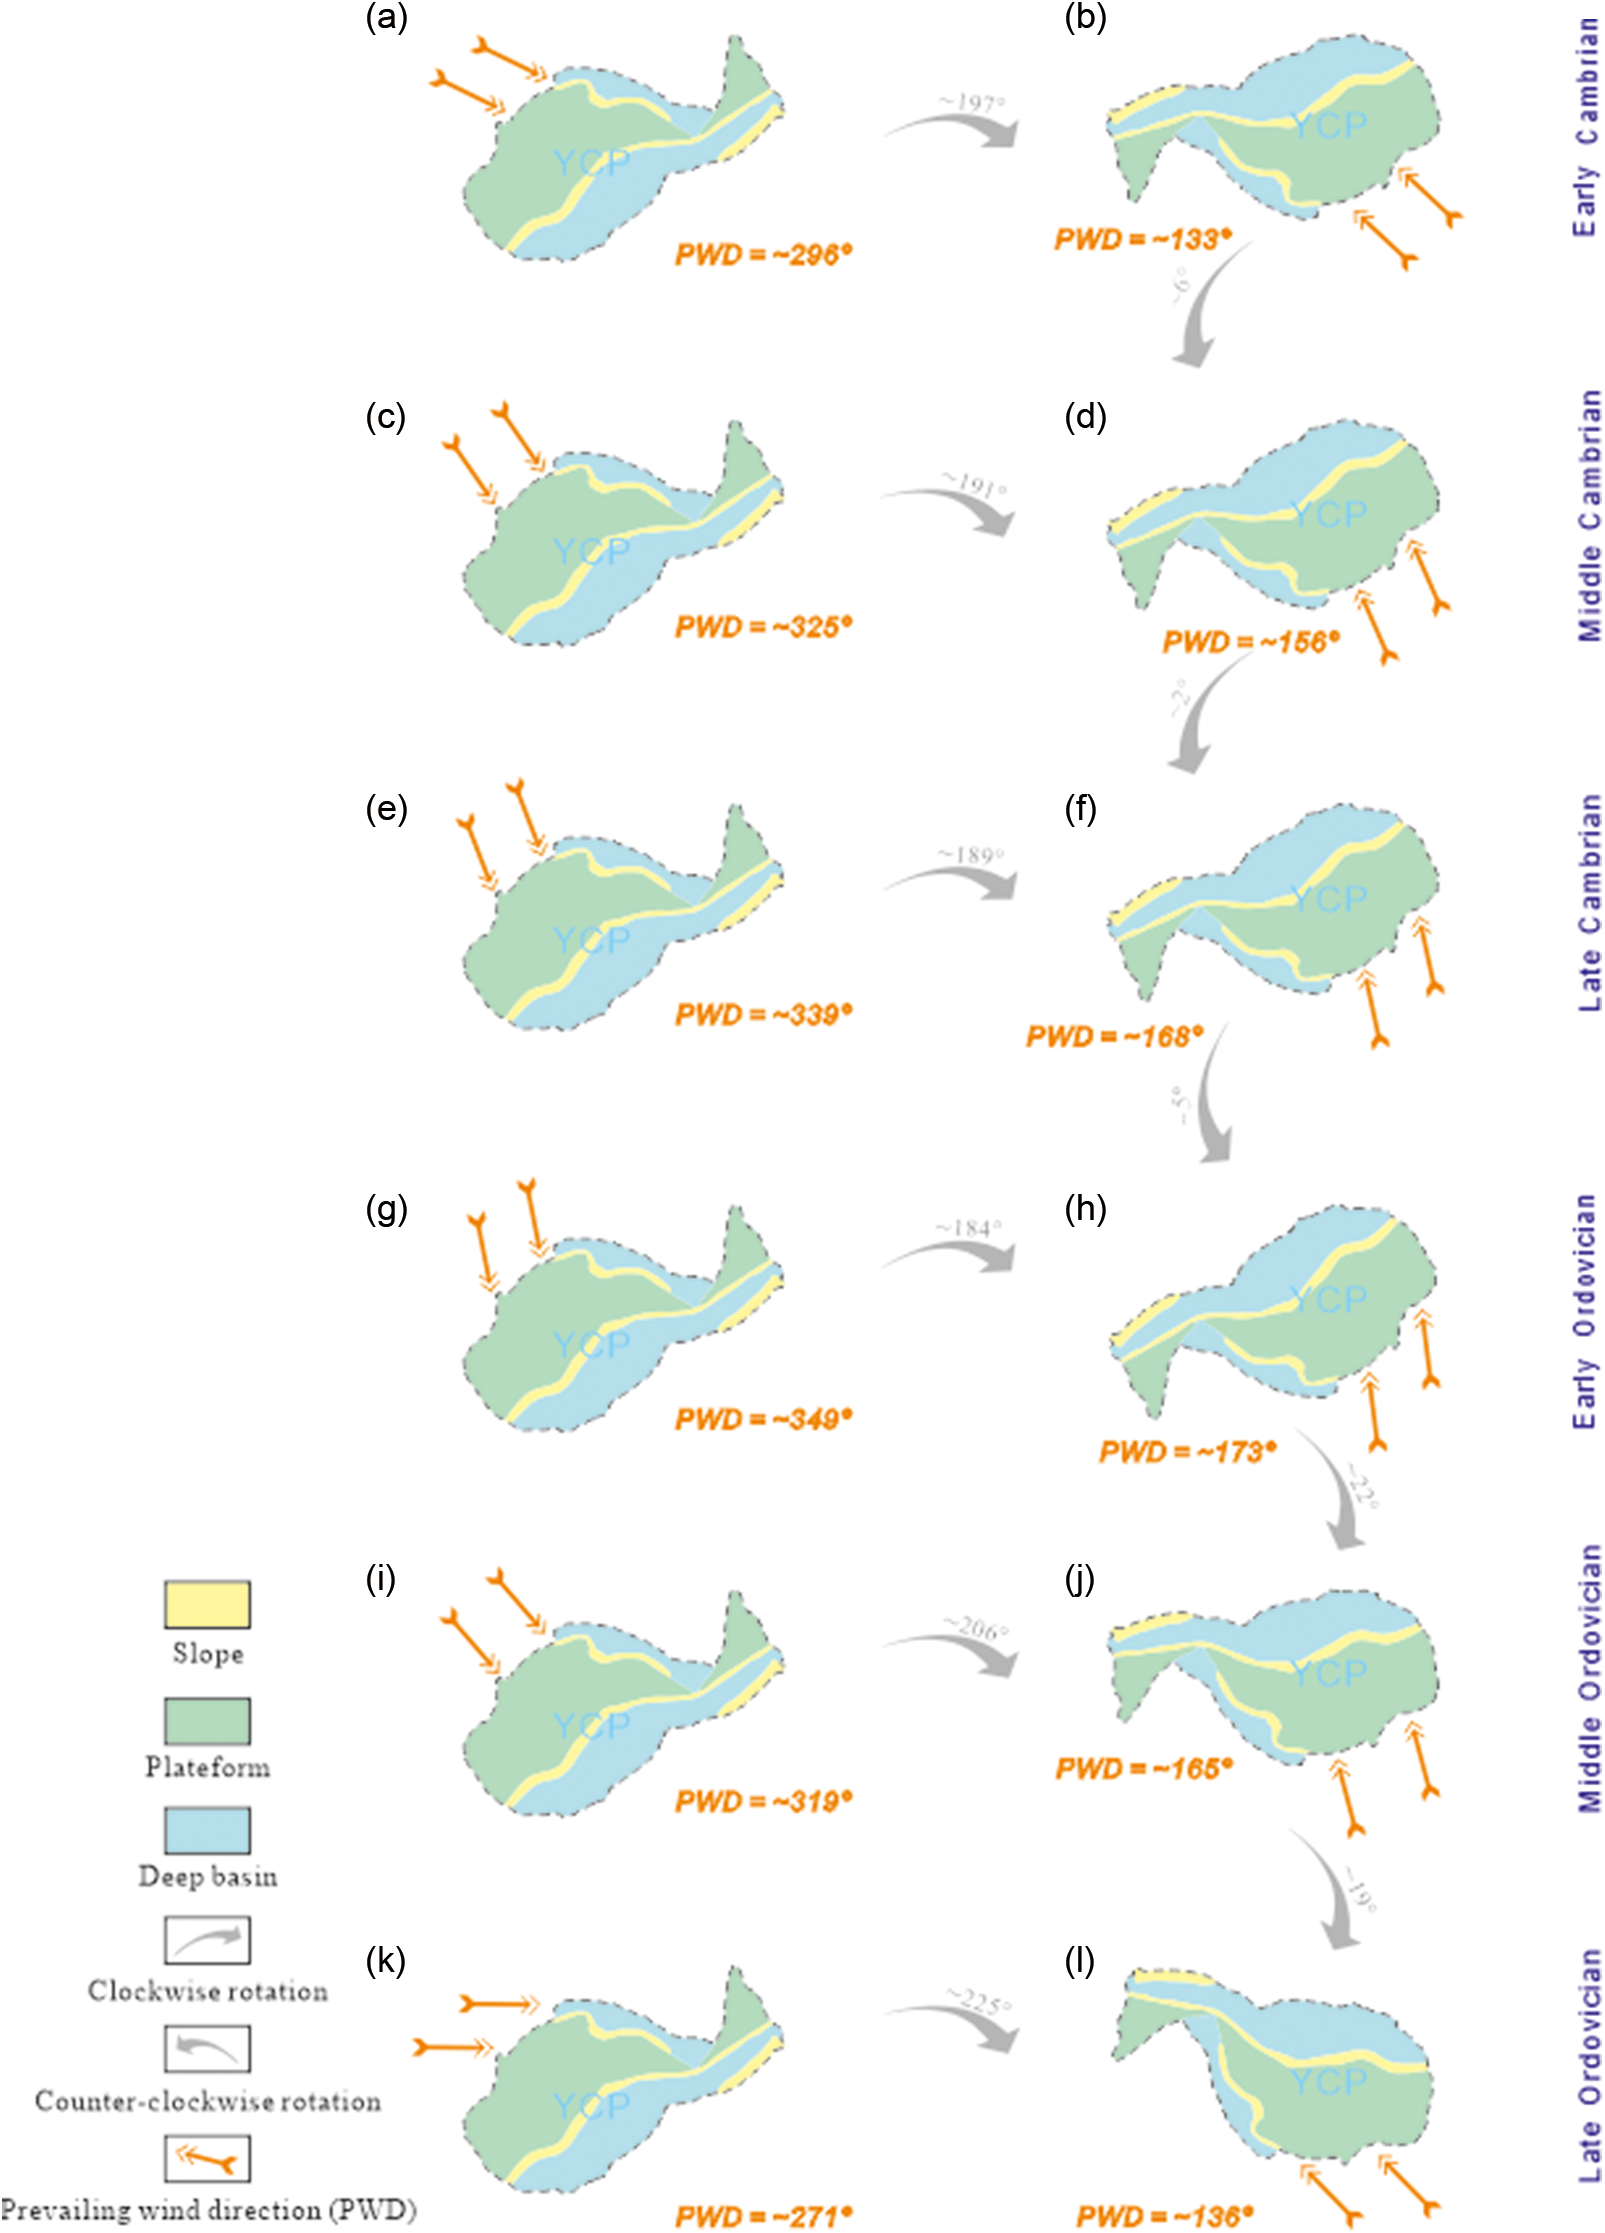
The current position of the YCP would indicate that its paleowind directions were 296° ± 52° during the Early Cambrian, 325° ± 57° during the Middle Cambrian, 339° ± 62° during the Late Cambrian, 349° ± 70° during the Early Ordovician, 319° ± 73° during the Middle Ordovician and 271° ± 68° during the Late Ordovician (Tables 3, 5; Fig. 8). This conclusion is consistent with the most recent knowledge of paleogeography (e.g. Torsvik & Cocks, Reference Torsvik, Cocks, Harper and Servais2013; Cocks & Torsvik, Reference Cocks and Torsvik2021): (1) the YCP was located in the Southern Hemisphere (∼14°S), and the prevailing paleowind direction was ∼133° (paleo-coordinates) during the Early Cambrian. The plate has rotated ∼197° counterclockwise since the Early Cambrian, so the paleowind direction was ∼296° in modern coordinates; (2) the YCP was located at ∼18°S, and the prevailing paleowind direction was ∼156° (paleo-coordinates) during the Middle Cambrian. The plate has rotated ∼191° counterclockwise since the Middle Cambrian, so the paleowind direction was ∼325° in modern coordinates; (3) the YCP was located at ∼24°S and the prevailing paleowind direction was ∼168° (paleo-coordinates) during the Late Cambrian. The plate has rotated ∼189° counterclockwise since the Late Cambrian, so the paleowind direction was ∼339° in modern coordinates; (4) the YCP was located at ∼28°S and the prevailing paleowind direction was ∼173° (paleo-coordinates) during the Early Ordovician. The plate has rotated ∼184° counterclockwise since the Early Ordovician, so the paleowind direction was ∼349° in modern coordinates; (5) the YCP was located at ∼21°S, and the prevailing paleowind direction was ∼165° (paleo-coordinates) during the Middle Ordovician. The plate has rotated ∼206° counterclockwise since the Middle Ordovician, so the paleowind direction was ∼319° in modern coordinates; and (6) the YCP was located at ∼16°S and the prevailing paleowind direction was ∼136° (paleo-coordinates) during the Late Ordovician. The plate has rotated ∼225° counterclockwise since the Late Ordovician, so the paleowind direction was ∼271° in modern coordinates (Torsvik & Cocks, Reference Torsvik, Cocks, Harper and Servais2013; Cocks & Torsvik, Reference Cocks and Torsvik2021; Fig. 9).
Relationship between present and Cambrian-Ordovician geographic orientations of the YCP. Paleowind orientations of the YCP are shown in modern coordinate (left) and paleo-coordinate (right) frameworks. Data are for Early Cambrian (a, b), Middle Cambrian (c, d), Late Cambrian (e, f), Early Ordovician (g, h), Middle Ordovician (i, j) and Late Ordovician (k, l). The prevailing wind directions for each Cambrian-Ordovician series are based on the AMS results from Tables 3 and 5 as well as Figs. 6, 7. Syn-and post-Cambrian and Ordovician tectonic rotations are shown by tapered grey arrows.
The determination of paleowind directions can be of geological significance for ancient carbonate platforms or basins. For example, as shown in the present study, the paleogeography of a plate can be constrained using wind directions.
6. Conclusions
The YCP was located in the low-latitude trade winds belt during the Cambrian–Ordovician and was affected by the prevailing wind directions. Analysis of the sedimentary differentiation of carbonate microfacies and AMS on the platform indicated that the paleowind directions over the YCP during the Early, Middle and Late Cambrian were 296° ± 52°, 325° ± 57° and 339° ± 62° respectively, whereas those during the Early, Middle and Late Ordovician were 349° ± 70°, 319° ± 73° and 271° ± 68°, respectively (modern coordinates). The present study quantitatively reconstructed the prevailing paleowind directions over the YCP through an analysis of sedimentary differentiation and AMS. The results of the present study can provide a reference for the study of the paleoclimate of the YCP.
The present study provided evidence for the location of the YCP during the Cambrian–Ordovician through the corresponding relationship between the prevailing paleowind directions over the YCP and the trade winds in the Northern and Southern hemispheres. The YCP was located at ∼14°S, ∼18°S and ∼24°S during the Early, Middle and Late Cambrian, respectively; corresponding values for the Early, Middle and Late Ordovician were ∼28°S, ∼21°S and ∼16°S, respectively. The results of the present study can provide a reference for the study of the paleogeography of the YCP.
Supplementary material
To view supplementary material for this article, please visit https://doi.org/10.1017/S0016756823000286
Data availability
All relevant data used for the research described in this article are included in the article and/or its supplementary files. Upon the request to the corresponding author (majinghui10@163.com) or first author (huchenlin@tom.com), the data are available.
Acknowledgements
We thank Wenxuan Sun, Zhiqiang Fu and Lingfeng Zhao for their help in data analysis. This study was supported by Natural Science Foundation of Xinjiang Uygur Autonomous Region (2020D01C064; 2020D01C037) and Natural Science Foundation of China (42062010). The authors would like to thank MJEditor (www.mjeditor.com) for its linguistic assistance during the preparation of this manuscript. Thanks are also extended to Geological Magazine Editor Emese Bordy and two anonymous reviewers for their constructive comments.
Conflicts of interest
The authors declare that they have no known competing financial interests or personal relationships that could have appeared to influence the work reported in this paper.