Researchers and teachers have long been interested in measuring vocabulary size. Knowing students' receptive vocabulary size provides teachers with a gauge as to whether those students will be able to comprehend a text or a listening task, whereas knowing their productive vocabulary size provides some indication as to the degree to which students will be able to speak or write. Research suggests that there are certain vocabulary thresholds that determine whether learners will be able to successfully use or understand language. For example, Nation (2001) reported that receptive knowledge of the 2,000 most frequent word families allows participants to understand 90% of the words in spoken discourse. Laufer (1992) suggested that, at a minimum, having receptive knowledge of the most frequent 3,000 word families is necessary to understand unsimplified text, and Hirsh and Nation (1992) suggested that knowing at least 5,000 word families is required for reading to be enjoyable. Research has also been able to show the effects of instruction through measuring gains in receptive and productive vocabularies (Laufer, 1998; Laufer & Paribakht, 1998). A number of studies have compared receptive and productive vocabulary sizes (Fan, 2000; Laufer; Laufer & Paribakht; Morgan & Oberdeck, 1930; Waring, 1997a). Although these studies have produced useful findings, the test formats may have been biased toward receptive vocabulary size, which brings the results into question. The present study was designed to provide a more accurate assessment of the relationship between receptive and productive vocabularies.
Background
Morgan and Oberdeck (1930) measured the second language (L2) receptive and productive vocabulary sizes of five classes of university students learning German. They found that the size of receptive vocabulary exceeded that of productive vocabulary at five levels of word frequency. The results suggest that at lower levels, receptive knowledge increases faster than productive knowledge, and at later levels, production develops faster than reception but never to the point that it equals reception. Although the study is important because it was the first to examine the gap between receptive and productive vocabularies, one problem reduces the validity of the findings. The receptive test provided the possibility of scoring correctly through guessing, whereas the productive test did not. The receptive measure was a five-item multiple-choice test, and the productive test was a translation test. Therefore, if subjects had no receptive knowledge of a target item, they still had a 20% chance of scoring correctly on the multiple-choice test, whereas the translation test offered virtually no chance of guessing correctly.
Four recent studies (Fan, 2000; Laufer, 1998; Laufer & Paribakht, 1998; Waring, 1997a) also found that receptive vocabulary was larger than productive vocabulary, supporting the earlier findings of Morgan and Oberdeck (1930). All four studies measured receptive and productive vocabulary sizes using the same tests and similar procedures. Receptive knowledge was measured using the Vocabulary Levels Test (Nation, 1990), whereas productive knowledge was measured using the Productive Vocabulary Levels Test (Laufer & Nation, 1999). Once again, however, the test formats were biased in favor of receptive knowledge, bringing the results into question.
The Vocabulary Levels Test is a matching test in which subjects must select the correct definition or synonym for three words from one of six options, as illustrated in (1).

The Productive Vocabulary Levels Test is a cued recall test that involves subjects completing a word in a sentence. To limit the answers to the target vocabulary, the first letters of the words are provided. An example is given in (2).

Scoring a correct response depends on whether the subject is able to recall the target word and then spell it correctly. However, this is not as simple as it sounds. Waring (1997a) and Laufer (1998) scored responses differently with respect to the grammatical form of the word (tense) and the orthographic form. Both tests measure vocabulary knowledge at four different word frequency levels (2,000, 3,000, 5,000, and 10,000) as well as the university word list (Xue & Nation, 1984), which allows for a direct comparison between receptive and productive knowledge at each level.
At first glance, the tests appear ideally suited to assessing the relationship between receptive and productive knowledge. However, there are four reasons why such a comparison might prove to be misleading. First, the matching test allows the learner a chance to score correctly without any knowledge. There is a 17% chance that a subject will guess correctly on one response with no knowledge of any of the six choices, and the possibility of guessing correctly increases with knowledge of some of the words. The Productive Vocabulary Levels Test offers little or no chance to guess correctly. If a subject does not know the correct response based on the context, the only possibility of guessing correctly is by producing a response based on the spelling of the first letters of the word, which is very unlikely. Therefore, it is likely that participants will both score higher and demonstrate greater receptive knowledge on the matching test than on the productive test of cued recall. Second, the Vocabulary Levels Test involves knowledge of form and meaning, whereas the productive version might also depend on knowledge of grammatical functions (depending on the method of scoring). Thus, the productive version is more demanding because it requires subjects to demonstrate more aspects of knowledge than the receptive version. Third, the receptive version uses a recognition format, whereas the productive version uses a recall format. The difference in format—recalling an answer and recognizing which choice is correct—is unlikely to provide an accurate comparison. Finally, some research suggests that tests that provide the first letters of the target item, such as the Productive Vocabulary Levels Test, might actually test receptive knowledge. Morton (1979) found that participants were able to recognize words when one phoneme is inaudible. Moreover, when a partially pronounced word was produced in context, participants were often unaware that it was not produced completely. This led Melka (1997) to state that “it is, then, clear that the presence of partial information is often sufficient to recognize a word” (p. 87). Morton's findings suggest that a test of cued recall in which the target word is partially presented could actually be a recognition test in which only productive knowledge of orthography is demonstrated. Because the receptive test provides a greater possibility of answering correctly without knowledge, and productive knowledge of orthography is not tested, the productive test could thus be considered a stricter test of receptive knowledge.
The present study was carefully designed to investigate the relationship between receptive and productive vocabulary sizes. Receptive and productive vocabulary sizes were measured with translation tests at three word frequency levels. Translation tests might provide a more accurate measurement of receptive and productive vocabularies because they have an equivalent test format. Two versions of each test were created to ensure that there could not be a learning effect from seeing the same target words in both the receptive and productive tests, and responses were scored at two levels of sensitivity.
RESEARCH QUESTIONS
The following specific research questions guided the current study:
- Is receptive vocabulary size larger than productive vocabulary size?
- How does the relationship between receptive and productive vocabulary sizes change as the frequency of the target items changes?
- Does the relationship between receptive and productive vocabulary sizes differ for participants with different receptive vocabulary scores?
METHOD
Participants
The participants in this study were 83 native speakers of Japanese from three second-year English as a foreign language (EFL) classes at a university in Japan. All of the participants had studied English for a minimum of 7 years. Forty-eight of the students were English literature majors whose general EFL proficiency level varied from intermediate to advanced. The other 37 participants were majoring in commerce, and their general proficiency level was considered to range from beginner to intermediate.
Target Words
One hundred eighty target words were selected for this study (see the Appendix). The target words, selected from the COBUILD dictionary, were chosen in relation to two factors: frequency and overlap between first language (L1) and L2 meanings. The COBUILD dictionary provides frequency information based on the Bank of English corpus, which contains over 200 million words. Sixty tokens were taken from three frequency bands: The target words in word band 1 were taken from among the 701st to 1,900th most frequent words, word band 2 tokens fell within the 1,901st to 3,400th most frequent word range, and tokens in word band 3 came from among the 3,401st to 6,600th most frequent words in English.
The second factor given consideration when selecting the target words was the degree of overlap in L1 and L2 meanings. Perhaps the greatest weakness with translation tests is that it is very difficult to ensure that even if the participants know the target words, they will write the target words. Because most words are polysemous and different L1 meanings might link with different L2 forms, it was important to choose target words that had a high degree of overlap with one L1 meaning and vice versa. If words that are semantically related with the target word, such as synonyms, are written as responses, it is difficult to ascertain whether the testee had knowledge of the target word. Because of this, words with a large degree of overlap in meaning were selected as target words. Potential target words were tested in a pilot study with 16 Japanese EFL students who were at a similar level as the participants in this study. Target words that consistently elicited the L2 form or its matching L1 meaning were used in the study, whereas items that elicited varied responses were eliminated.
Research Instruments
Two instruments—receptive and productive translation tests—were used to measure the participants' vocabulary size at three word frequency levels. At each level, the receptive and productive tests were presented together on one page. Each page had 60 questions (30 receptive and 30 productive), for a total of 180 items (90 receptive and 90 productive) on the test.
In the receptive test, the L2 forms of the target words cued responses of the L1 form. For example, the participants were required to write the Japanese translations of bubble, gasoline, and bruise on a blank line next to each printed word. All of the responses on the receptive tests were scored by a Japanese native speaker. A second Japanese native speaker checked all of the responses in which the target word was incorrect or misspelled. Responses were scored at two levels of sensitivity: sensitive and strict. In the strict scoring system, a learner's response was marked as correct if it demonstrated that the learner was able to recall the L1 meaning and it was spelled correctly. In the sensitive scoring system, responses that demonstrated L1 knowledge of meaning were marked as correct even if they were misspelled. When the L1 word was misspelled, both graders had to agree that the response demonstrated L1 knowledge of meaning for the target word. Responses that demonstrated L1 knowledge of meaning but were in the wrong grammatical form were marked as correct in both scoring systems.
For some items on the receptive tests (1.2%), participants responded with another sense of a target word's meaning; such responses were scored as correct. For example, the target meaning for the cue spring was

, which refers to its most common meaning—spring, the season. However, in several cases, participants responded with

, which refers to a spring or spa. Because all of the target words in the study were matched with their most common meanings, less common meanings for L2 target words were marked as correct because such responses suggested that participants had a greater strength of knowledge than was being measured.
In the productive test, the participants were given L1 meanings and asked to write their L2 forms. For example, participants were required to write the translations (shown in parentheses) of

(“bubble”),

(“gasoline”), and

(“bruise”) on a blank line that appeared next to the L1 cue. All of the responses on this test were scored at two levels of sensitivity. In the sensitive scoring system, words with spelling errors were marked as correct if the overall shape of the response was a close approximation of the target word. For example, for the target response bubble, misspellings such as bubbl, buble, bubel, and bubl were acceptable responses. However, similar spellings that were real words such as babble and bobble would have been marked as incorrect because it could not be certain that the participants had intended to write the target word. In the strict scoring system, responses were only marked as correct if the target words were spelled correctly. Responses in the wrong grammatical form were marked as correct for both scoring methods. There were two reasons for this. First, it seemed unlikely that participants who responded with leaves and burning instead of the target words leaf and burn did not know those target words. Second, the translation tests were essentially tests of meaning and form. Although it might be possible to score responses for grammatical form, such scoring might not give an accurate assessment of grammatical knowledge.
Despite pilot testing to attempt to eliminate L1 meanings that elicited multiple semantically correct responses, a small number of target meanings elicited varied responses, all of which were correct L2 translations. Forty-nine responses on the productive tests (0.66%) were scored as correct but were not the intended target words. Typically, these responses were less frequent synonyms. In such cases, the responses were marked as correct because learners are more likely to know more frequent synonyms than less frequent synonyms. Therefore, if a less frequent synonym was written as a response, it was likely that the testee also knew the more frequent synonym. Examples of semantically similar responses marked as correct were embrace instead of the target word hug, mature for ripe, steps for stairs, conceal for hide, and dislike for hate. One response, horn, which was not semantically related to the intended target response, corner, was also marked as correct because the target word

was polysemous, and horn was a less frequent meaning. Because the number of semantically similar responses was extremely small (0.66%), it was unlikely to have affected the results.
Procedure
The tests were administered in a 90-min class session. Participants received a three-page test booklet and were given as much time as they needed to complete the tests. The receptive and productive tests for each frequency level were presented on one page. Participants received the most frequent L2 words and L1 meanings on the first page and the least frequent words and meanings on the third page.
Two versions of the test booklet were prepared to ensure that there would not be a learning effect from seeing the same words in both the receptive and productive tests. The 90 L2 target words in version A of the receptive test appeared as the 90 L1 meanings in version B of the productive test. Similarly, the 90 L1 meanings in version A of the productive test appeared as the 90 L2 target words presented in version B of the receptive test. Half of the participants were randomly chosen to do version A, and the other half of the participants completed version B. The research design allowed all of the words to be tested receptively and productively and ensured that there was not a learning effect from one test to the other.
Two scores were calculated for each test at each level of frequency for all of the participants. One score was for partial knowledge of written form and one score was for full knowledge of written form. Using scores for partial and full knowledge of written form might provide a better indication of the learners' vocabulary size.
RESULTS
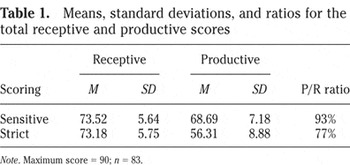
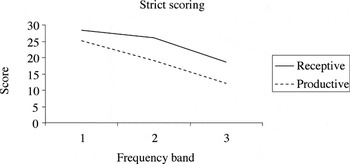
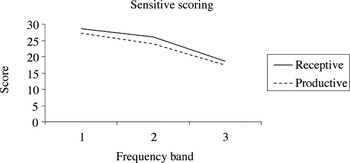
The descriptive statistics (means and standard deviations) and the ratio of productive to receptive vocabulary on the receptive and productive translation tests are reported in Table 1. Receptive scores were higher than productive scores using both the sensitive and strict scoring methods. The ratio of productive to receptive knowledge was much greater using sensitive scoring (93%) than strict scoring (77%), which indicates that the participants might have partial productive knowledge of L2 forms for almost all of the words known receptively, but that they did not possess full knowledge of meaning and form for nearly as many words productively as they did receptively. Figures 1 and 2 illustrate the differences between receptive and productive sizes when scoring for partial knowledge (sensitive scoring) and fuller knowledge (strict scoring). To determine whether there were any overall differences between the receptive and productive vocabulary scores, repeated measures ANOVAs were performed using the total scores on the receptive and productive measures. The independent variable was the type of knowledge: receptive and productive.
Means, standard deviations, and ratios for the total receptive and productive scores


Receptive and productive scores at each frequency band using the strict scoring method.

Receptive and productive scores at each frequency band using the sensitive scoring method.
In response to the first research question, the results indicate that receptive vocabulary size is larger than productive vocabulary size. Receptive scores were found to be significantly higher than productive scores using sensitive scoring, F(1, 82) = 42.14, p < .001, and strict scoring, F(1, 82) = 194.67, p < .001. A repeated measures ANOVA also revealed that the version of the test (A or B) had a significant effect on scoring, F(1, 81) = 64.71, p < .001. Participants had greater knowledge of meaning and form for the target words presented on the productive test of version A and the receptive test of version B than for the target words presented on the productive test of version B and the receptive test of version A. This would not, however, affect the results, because the study used a within-subjects design rather than a between-subjects design.
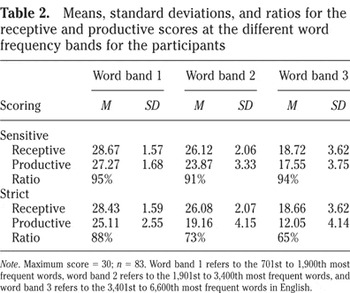
The second research question focused on the relationship between receptive and productive vocabulary sizes at different word frequencies. The scores on the receptive and productive translation tests at each word frequency band are presented in Table 2. Table 2 shows that receptive scores were higher at each frequency band. Repeated measures ANOVAs revealed that receptive scores were higher than productive scores when scoring for partial knowledge at word band 1, F(1, 82) = 30.59, p < .001, word band 2, F(1, 82) = 38.92, p < .001, and word band 3, F(1, 82) = 7.32, p < .01. Receptive scores were also significantly higher at word band 1, F(1, 82) = 105.97, p < .001, word band 2, F(1, 82) = 244.21, p < .001, and word band 3, F(1, 82) = 206.26, p < .001, using strict scoring. Additionally, Table 2 shows that the productive-receptive ratio remained fairly consistent at each frequency band when scoring for partial knowledge. However, with strict scoring, the ratio of productive to receptive scores decreased as the word frequency decreased.
Means, standard deviations, and ratios for the receptive and productive scores at the different word frequency bands for the participants

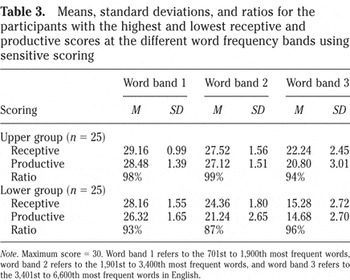
The third research question focused on the relationship between receptive and productive vocabulary sizes for learners with different receptive vocabulary scores. Table 3 presents the data for the receptive and productive translation tests at each word frequency band for the participants with the highest and lowest scores when scoring for partial knowledge. Repeated measures ANOVAs did not find any effects for the type of knowledge at word band 1, F(1, 24) = 2.79, p = .108, word band 2, F(1, 24) = 0.92, p = .346, or word band 3, F(1, 24) = 3.24, p = .085, for the upper level participants. Receptive scores were significantly higher for the lower level group at word band 1, F(1, 24) = 15.70, p < .001, and word band 2, F(1, 24) = 22.23, p < .001. There was no difference between scores at word band 3, F(1, 24) = 0.61, p = .444.
Means, standard deviations, and ratios for the participants with the highest and lowest receptive and productive scores at the different word frequency bands using sensitive scoring

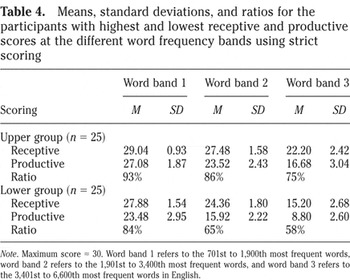
Table 4 shows the scores on the receptive and productive tests at each word frequency band for the participants with the highest and lowest scores using strict scoring. Repeated measures ANOVAs revealed significant differences for the upper level group at word band 1, F(1, 24) = 16.59, p < .001, word band 2, F(1, 24) = 38.41, p < .001, and word band 3, F(1, 24) = 38.55, p < .001. Receptive scores were significantly higher for the lower level group at word band 1, F(1, 24) = 46.46, p < .001, word band 2, F(1, 24) = 217.88, p < .001, and word band 3, F(1, 24) = 55.35, p < .001.
Means, standard deviations, and ratios for the participants with highest and lowest receptive and productive scores at the different word frequency bands using strict scoring

DISCUSSION
The first question investigated total receptive and productive vocabulary sizes. The results support previous findings (Fan, 2000; Laufer, 1998; Laufer & Paribakht, 1998; Morgan & Oberdeck, 1930; Waring, 1997a) as well as the common perception among researchers (Aitchison, 1994; Channell, 1988; Crow, 1986) that a learner's receptive vocabulary is larger than his or her productive vocabulary. The experimental design expanded upon earlier methodologies by using equivalent receptive and productive test formats with different target words to provide a more accurate measurement of the relationship between receptive and productive vocabulary knowledge. When responses were scored for partial knowledge, the difference between receptive and productive vocabulary sizes was quite small; the ratio of productive to receptive knowledge was 93%. When using strict scoring, the difference between vocabulary sizes was greater; the ratio was 77%. Although the results of the present study indicate that the ratio of productive to receptive knowledge was almost equal when scoring for partial knowledge, this was probably slightly misleading because the tests only measured knowledge of meaning and form. The gap between receptive and productive knowledge might have been higher if other aspects of word knowledge, such as collocation or syntax, had also been measured. However, it might also be possible that the receptive and productive vocabulary sizes of EFL and English as a second language (ESL) learners are different. The results of this study indicate that there might only be a small difference between the receptive and productive vocabulary sizes of EFL learners. However, the difference might be larger for ESL learners. EFL learners are likely to learn more words through explicit instruction than are ESL learners (Laufer & Paribakht). Explicit vocabulary learning might lead to deeper knowledge of meaning and greater gains in productive knowledge than might typically occur with incidental vocabulary learning. Because most L1 words are learned receptively through reading or listening (Jenkins, Stein, & Wysocki, 1984; Nagy, Anderson, & Herman, 1987; Nagy & Herman, 1987; Nagy, Herman, & Anderson, 1985) and receptive learning leads to greater gains in receptive knowledge than productive knowledge (Griffin & Harley, 1996; Mondria & Wiersma, 2004; Stoddard, 1929; Waring, 1997b), the difference between productive and receptive vocabulary sizes is also likely to be much larger for L1 learners. Another reason that the difference between receptive and productive vocabularies might be relatively small for the EFL learners in this study is that Japanese learners often use rote learning strategies to learn new words (Schmitt, 1997; Tinkham, 1989). The similarity between the method of learning and testing might have a positive effect on scores (Griffin, 1992). Because research suggests that receptive learning is more likely to lead to larger gains in receptive knowledge than productive knowledge, whereas productive learning is more effective in increasing productive knowledge (Griffin & Harley; Mondria & Wiersma; Stoddard; Waring), the results suggest that vocabulary instruction in Japan might offer a more balanced approach to learning vocabulary.
The second question investigated the relationship between receptive and productive vocabulary sizes at different levels of frequency. The results showed that both receptive and productive scores decreased as word frequency decreased regardless of the method used to score the responses (strict or sensitive), and the difference between productive and receptive vocabulary size increased as frequency decreased when the responses were scored strictly. The ratio was 88% at the most frequent word band (word band 1), 73% at the next frequency band (word band 2), and 65% at the lowest frequency band (word band 3). This result gives support to the common assumption that receptive knowledge precedes productive knowledge (Aitchison, 1994; Channell, 1988; Melka, 1997). Although this assumption seems logical, it might not be entirely correct. Learners might often gain productive knowledge of some aspects of vocabulary knowledge before they gain some aspects of receptive knowledge. Advanced learners are likely to gain productive knowledge of form and partial productive knowledge of grammatical functions from seeing or hearing the form of an unknown word. This might occur before they gain receptive knowledge of its meaning. Research that has examined incidental vocabulary learning has shown that learners gain very little receptive knowledge of meaning from one encounter with a word in context (Horst, Cobb, & Meara, 1998; Hulstijn, Hollander, & Greidanus, 1996; Webb, 2007), and Beck, McKeown, and McCaslin (1983) suggested that learners are unlikely to gain any knowledge of meaning from one presentation of a word in an uninformative context. For example, from the sentence Their request for extradition was denied, learners who have never encountered the word extradition are likely to gain little receptive knowledge of meaning but might be able write or pronounce extradition correctly based on their knowledge of the rules of spelling. They are also likely to learn that extradition is a noun, because of its suffix, and that it is something that can be asked for because of the context in which it appeared. Another example would be when a person has attempted to use a word without fully understanding it. Although the outcome might have been funny or embarrassing, that person might still have been able to demonstrate types of productive knowledge such as form, collocation, and grammatical functions. Many L2 teachers will be able to give examples of learners demonstrating productive knowledge of meaning before they have gained receptive knowledge of grammatical functions. These arguments suggest that some aspects of productive knowledge might be gained before some aspects of receptive knowledge. However, because knowing a word has traditionally been defined as knowing its meaning, it might be more accurate to restate the above assumption as follows: Receptive knowledge of meaning precedes productive knowledge of meaning. However, in terms of overall vocabulary size, there can be little doubt from the results of this study and earlier studies that learners are likely to have receptive knowledge of more words than they have productive knowledge of.
When responses were scored for partial knowledge, there was little difference between vocabulary sizes at each frequency band. At word band 1, the ratio was 95%; at word band 2, the ratio was 91%; at word band 3, the ratio was 94%. This suggests that although it might have been easier for the participants to demonstrate receptive knowledge than productive knowledge, they did have partial productive knowledge of almost the same number of words that they had partial receptive knowledge of. The reason for this was that there was almost no change between the strict and sensitive scores for receptive knowledge, because the participants made very few orthographic errors in their L1. However, the scores increased at all frequency bands on the productive test when the responses were scored for partial knowledge because there were more L2 spelling mistakes.
The third research question investigated the relationship between receptive and productive vocabulary sizes for learners with different receptive vocabulary scores. To determine whether the relationship between receptive and productive vocabularies varied for learners, the 25 participants with the highest receptive vocabulary scores and the 25 participants with the lowest receptive vocabulary scores were divided into two levels: upper and lower. The results showed that scores on the tests at each frequency band decreased as word frequency decreased with both methods of scoring. When responses were scored to allow for partial knowledge, the results were similar for both groups. The difference between productive and receptive vocabulary sizes was very small at all frequency bands, ranging from a ratio of productive to receptive knowledge of 94–99% for the upper level group and 87–96% for the lower level group. However, when responses were scored strictly, results showed that the difference between vocabulary sizes increased at each word band for both groups, with the difference being greater for the lower level participants at each level. The upper level group had a ratio of 93% for word band 1, 86% for word band 2, and 75% for word band 3. The lower level group had a ratio of 84% for word band 1, 65% for word band 2, and 58% for word band 3. The findings indicate that receptive vocabulary size might give some indication of productive vocabulary size. Learners who have a larger receptive vocabulary are likely to know more of those words productively than learners who have a smaller receptive vocabulary. Although the result is not surprising, it would be useful to determine if there is a point at which scores on a receptive vocabulary test such as the Vocabulary Levels Test (Nation, 1983, 1990; Schmitt, Schmitt, & Clapham, 2001) or the Eurocentres Vocabulary Size Test (Meara & Jones, 1990) could indicate a learner's productive vocabulary.
The results also indicate that regardless of receptive vocabulary size, the participants had partial productive knowledge of almost all of the words that they knew receptively, but as word frequency decreased, they were unable to demonstrate productive knowledge to the same degree as receptive knowledge. Participants with higher receptive vocabulary scores had greater ability at demonstrating productive knowledge of L2 forms than those with lower receptive scores.
It is interesting to note that scores were occasionally higher on a learner's productive test than on his or her receptive test at the same frequency band. This contrasts with Waring's (1997a) study, in which he found that all of the participants had higher scores on the receptive tests at every word frequency level. This might have occurred because the learners were tested for different receptive and productive words. However, there are two other reasons why Japanese learners might score highly on a productive test of meaning and form. First, Japanese has a large number of loan words. Learners might gain productive knowledge of orthography from the L1 form of those words. Whereas it might be assumed that the reverse would also be true—learners gaining receptive knowledge of meaning from the L2 form—this is not necessarily the case. For example, learners consistently demonstrated at least partial knowledge of the target word massage on the productive test when prompted with its L1 form

. However, none of the learners was able to demonstrate receptive knowledge of massage because they were either unsure of its meaning or because they mistook it for message. Due to the fact that the L1 form of loan words provides information about their L2 form, it might be relatively easy to demonstrate productive knowledge of form. It might be more difficult to translate those words in the opposite direction because learners need to demonstrate a greater amount of knowledge—meaning as well as form. Similarly, participants sometimes mistook the form of L2 words for which they were likely to have had receptive knowledge, such as week for weak, send for sand, and baton for button. This did not occur in the opposite direction (L1 to L2).
The test format in this study—receptive and productive translations tests—differed from most recent studies that investigated the relationship between receptive and productive vocabulary sizes using the Vocabulary Levels Test and the Productive Vocabulary Levels Test. Because translation tests use an identical format to test receptive and productive knowledge, they might provide a more accurate measurement of vocabulary size. However, there are two problems with using translation tests. First, grading tests might be virtually impossible in an ESL situation because learners are likely to have different L1s. Second, the target words on translation tests need to be chosen very carefully and then extensively pilot-tested to ensure that the testees are likely to respond to the target word. These two weaknesses make the use of tests such as the Vocabulary Levels Test and the Eurocentres Vocabulary Size Test better suited to determining receptive vocabulary size and the Productive Vocabulary Levels Test more effective for measuring productive vocabulary size. However, researchers who need to make more accurate comparisons should explore further options and use tests with equivalent formats, such as translation tests.
Although the results of the present study might confirm that learners' receptive vocabulary size is larger than their productive vocabulary size, it is likely that this relationship varies from group to group. Laufer and Paribakht (1998) found that the gap between receptive and productive vocabularies was smaller for EFL students than ESL students and suggested that this is because of learning differences. EFL learners are more likely to learn words through direct methods, making more of an effort to learn a new word and, as a result, gaining more productive knowledge than ESL learners, who might learn more words indirectly. Vocabulary instruction and the proficiency level of students are two factors that are likely to have a substantial effect on vocabulary size. Further research to investigate the relationship between receptive and productive vocabularies for different types of learners would be a useful follow-up to this study. In particular, examining how different methods of instruction affect vocabulary size would be of benefit to teachers and students.
APPENDIX