

I. INTRODUCTION
There is public concern regarding the potential health risks of technologies using electromagnetic fields (EMFs). Research into possible relationships between exposure to EMFs and human health is very important. The World Health Organization (WHO) has assessed the health risks produced by EMFs in the frequency range 0–300 GHz, and has published Environmental Health Criteria monographs to provide critical reviews on the effects of EMFs on human health [1]. The International Commission on Non-ionizing Radiation Protection (ICNIRP) established guidelines for limiting exposure to EMFs that will provide protection against all established adverse health effects. The restrictions in these guidelines are based on established evidence regarding acute effects. Current knowledge indicates that adherence to these restrictions protects workers and the public from adverse health effects from exposure to low-frequency EMFs [2, 3].
Wireless power transfer (WPT) can be utilized to supply power to equipment, and eliminates the need for a direct connection to a power source. Many experiments on WPT technology, such as laser, microwave, and magnetic induction, have been carried out [Reference Shinohara4]. Kurs et al. [Reference Kurs, Karalis, Moffatt, Joannpoilos, Fisher and Soljacic5] and Karalis et al. [Reference Karalis, Joannopoulos and Soljacic6] described a new EMF-related WPT technology using the resonant coupling phenomenon. This type of WPT is carried out between two pairs of coils, similar to electromagnetic induction, but can extend the transmission distance dramatically at the resonant frequency of the coils. This new WPT technology has many potential applications, such as wireless powering of residential and industrial equipment and wireless charging for electric vehicles, and has attracted the attention of many researchers who have started investigating related technologies [Reference Shinohara4, Reference Shinohara7]. Some studies have already discussed the possible relationship between EMFs from WPT using the resonant coupling phenomenon and human health based on the ICNIRP guidelines [Reference Park, Wake and Watanabe8–Reference Chun10]. However, this possible relationship has not been experimentally evaluated.
In the experimental evaluation of human health risks related to EMF, in vitro studies provide support and are used mainly to supply experimental evidence missing from human studies [11]. In vitro studies require strict conditions, including temperature, humidity, and CO2 concentration, to culture cells. Thus, many in vitro exposure systems have been built using CO2 incubators, which are made using a metal box, to evaluate the biological effects of various frequencies of EMFs [Reference Miyakoshi, Ohtsu, Miyajima and Takebe12–Reference Fujita, Kawahara, Inoue and Omori15]. The size of the CO2 incubator is generally limited to maintain the proper cell culture conditions. Moreover, it is known that the power transfer characteristics of magnetic resonant coupling WPT are influenced by neighboring metal and that the transfer of power into a closed metal box is difficult [Reference Mizuno, Koizumi, Komurasaki and Arakawa16, Reference Yamakawa, Mizuno, Ishida, Koizumi and Komurasaki17].
In this study, we developed a new in vitro exposure system to evaluate the biological effects of resonant coupling WPT. This system includes a cell culture space, transmitting coil, and receiving coil within a CO2 incubator, and can culture cells under the magnetic resonant coupling WPT. This paper focuses on the coil design for a magnetic resonant coupling in vitro exposure system and on characteristics, such as power transfer efficiency, electric field and magnetic field distributions, and specific absorption rate (SAR) of the system.
II. COIL DESIGN FOR RESONANT COUPLING WIRELESS POWER TRANSFER
A) Coil type
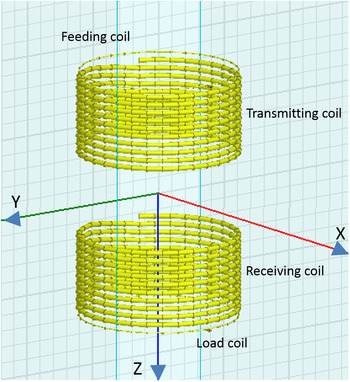
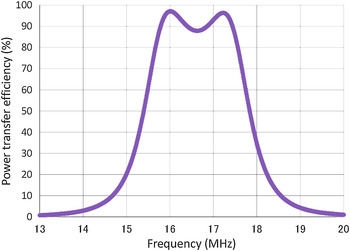
Self-resonant helical coil type is generally used for WPT and transfers power mainly by magnetic resonant coupling, and resonant frequency of 10–20 MHz has been selected [Reference Karalis, Joannopoulos and Soljacic6, Reference Imura, Okabe, Uchida and Hori18, Reference Hirayama, Amano, Kikuma and Sakakibara19]. To preliminarily evaluate the coil design for magnetic resonant coupling WPT, we used the finite element method (FEM) in a commercially available simulation platform (HFSS version 13.0.2, ANSOFT, Canonsburg, PA, USA). The coils comprised a transmitting coil, receiving coil, feeding coil, and load coil. The transmitting and receiving coils were formed using copper pipe with a 6.0-mm outer diameter and a 4.4-mm inner diameter. The coils were designed to fit inside our CO2 incubator. The CO2 incubator (Model BNA-111, ESPEC, Osaka, Japan) had a length (L) of 480 mm, a width (W) of 480 mm, and a height (H) of 585 mm. Each coil had ten turns and a 10-mm pitch. The transmitting and receiving coils were opposite each other, at a distance of 100 mm. The feeding and load coils, which were formed using a 1-mm diameter copper wire, were 10 mm from both the transmitting and receiving coils. The diameter of these four coils varied from 125 to 400 mm. The HFSS–FEM model of the coils for WPT and its power transfer efficiency are shown in Figs. 1 and 2, respectively. The power transfer efficiency shows two resonant peaks at 16.0 and 17.2 MHz. It is well known that strong resonant coupling is achieved when the transmitting and receiving coils are close [Reference Imura, Okabe, Uchida and Hori18, Reference Imura, Okabe, Uchida and Hori20].
HFSS–FEM model of basic coil design for exposure system. The coils in this model have a diameter of 200 mm. X and Y axes are the centers of the transmitting and receiving coils. Z-axis coincides with center line of coils.

Simulated power transfer efficiency, calculated by |S21|2.

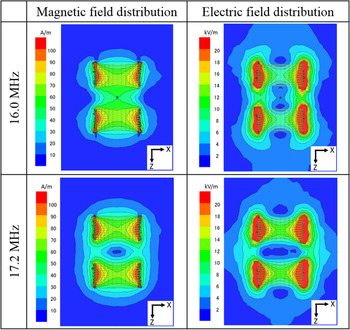
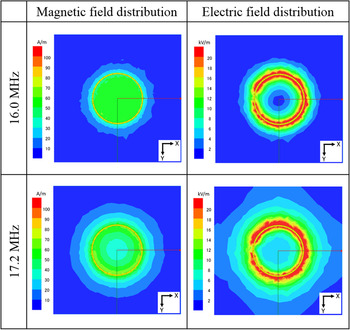
The simulated results of the magnetic and electric field distributions on the X–Z plane and the X–Y plane at Z = 40 mm are shown in Figs. 3 and 4, respectively. In the magnetic field distribution on the X–Z plane at 16.0 MHz, the field is focused between the transmitting and receiving coils. In the magnetic field distribution on an X–Y plane at Z = 40 mm at 16.0 MHz, the field is focused at the center of the coils. The vector of the magnetic field is perpendicular to the X–Y plane at 16.0 MHz. And also, the vector of the magnetic field is horizontal to the X–Y plane at 17.2 MHz [Reference Imura, Okabe, Uchida and Hori18].
Simulated results of magnetic and electric field distributions on the X–Z plane at 16.0 and 17.2 MHz. 200 W high-frequency power is applied.

Simulated results of magnetic and electric field distributions on the X–Y plane at Z = 40 mm at 16.0 and 17.2 MHz. 200 W high-frequency power is applied.

B) Power transfer efficiency in metal box
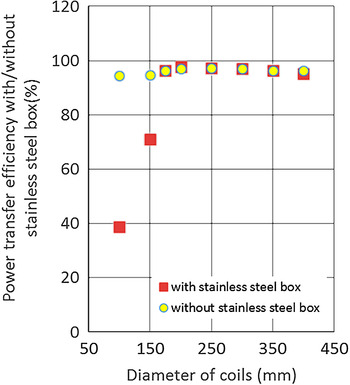
Mizuno et al. [Reference Mizuno, Koizumi, Komurasaki and Arakawa16] reported that a concentric metal cylinder pipe with the coils for resonant coupling WPT interferes with the power transfer efficiency. To build coils for magnetic resonant coupling WPT inside a CO2 incubator, we conducted a preliminary evaluation of the effect on the power transfer efficiency of a CO2 incubator. For the HFSS–FEM model, the CO2 incubator is modeled as a stainless steel box (480 mm (L) × 480 mm (W) × 585 mm (H)). Figure 5 shows the power transfer efficiency with and without the stainless steel box when the coil size varied from 100 to 400 mm. The metal box hardly affected the power transfer efficiency at coil of diameters > 200 mm, but greatly reduced it at coil of diameters < 150 mm.
Simulated power transfer efficiency with or without stainless steel box.

C) Uniformity of magnetic field distribution
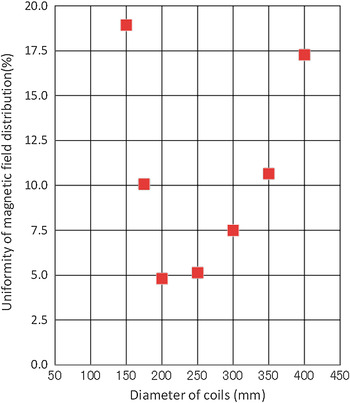
In an in vitro exposure system for evaluating biological effects of EMFs, ±3 to ±5% uniformity of the horizontal magnetic field distribution is used [Reference Miyakoshi, Horiuchi, Nakahara and Sakurai21–Reference Sakurai, Narita, Shinohara and Miyakoshi23]. Figure 6 shows the trend in the standard deviation of the magnetic field distribution on the X–Y plane at Z = 40 mm versus the size of the coils. The standard deviation was the smallest at a coil diameter of 200 mm in the HFSS–FEM model.
Uniformity of magnetic field distribution on the X–Y plane at Z = 40 mm in metal box.

D) Matching
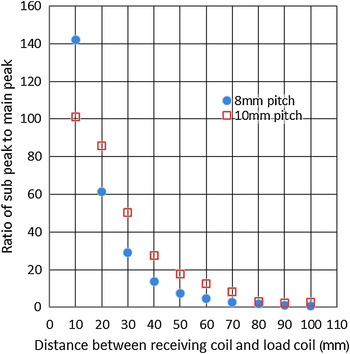
According to the above results, a coil diameter of 200 mm is appropriate for our in vitro exposure system. However, the power transfer characteristics with two resonant frequencies, as shown in Fig. 2, can be improved. It is well known that increasing the distance between the transmitting and receiving coils will improve the power transfer characteristics; however, the magnetic field strength will decrease. Awai et al. [Reference Awai24] reported that adjusting the distance between the receiving and load coils improves the power transfer characteristics. This technique barely changes the magnetic field strength because the distance between the transmitting and receiving coils does not change. Figure 7 shows the simulated results of the ratio of the higher-frequency peak (subpeak) to the lower-frequency peak (main peak) versus the distance between the receiving and load coils in the HFSS–FEM model. The ratio of the subpeak to the main peak becomes small, and the two resonant peaks shift to a single peak by increasing the distance between the receiving and the load coils. Moreover, the power transfer efficiency further improved by changing the pitch of the receiving coil to 8 mm.
Ratio of subpeak to main peak of power transfer efficiency.

III. EXPOSURE SYSTEM
A) Experimental setup
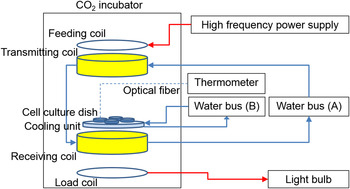
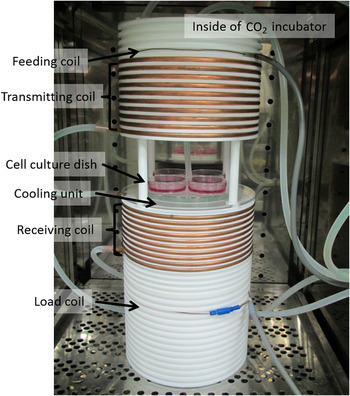
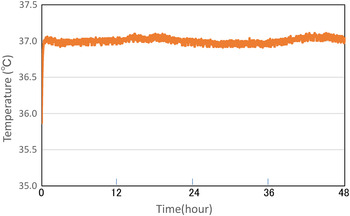
A diagram of the in vitro exposure system, comprising the coils designed for magnetic resonant coupling WPT built into a CO2 incubator, a high-frequency power supply, a thermometer to measure the temperature of the cell culture medium, water bath (A) to cool the transmitting and receiving coils, water bath (B) to maintain the cooling unit, and light bulb, is shown in Fig. 8. The WPT coils within the CO2 incubator are shown in Fig. 9. The single-phase, high-frequency power supply (Model T161-5356AEM, THAMWAY, Shizuoka, Japan) works at AC 100 V, 50/60 Hz, and 1.3 kVA. The rated output power is up to 200 W, and the output frequency varies from 8.0 to 15.0 MHz. The CO2 incubator (Model BNA-111, ESPEC, Osaka, Japan) maintains conditions of 5% CO2, 95% air, and 100% humidity for the cell culture. The coils were made using copper pipe with a 6.0-mm outer diameter and a 4.4-mm inner diameter. The coil diameter was 200 mm, and the number of turns was 10. The transmitting and receiving coils had 10 and 8 mm pitches, respectively. The transmitting and receiving coils were opposite each other, at a distance of 100 mm. The power supply and 200 W light bulb were connected to the feeding and load coils, respectively. The feeding and load coils were made using 1.4-mm diameter copper line. The feeding and load coils were separated from the transmitting and receiving coils by 10 and 64 mm, respectively. A Teflon cylinder of 20-mm thickness was chosen as a coil carrier. The cylinder grooves were precision machined with reference to the bottom and top plates. The copper pipe was fixed tightly in these grooves to prevent vibration. The cooling unit, which is made of an outer diameter of 150 mm, 10 mm thick, an acrylic hollow cylinder, is in between the transmitting and receiving coils. Four cell culture dishes with 60-mm diameter are placed on the cooling unit. Distance between the dishes and top of receiving coil is 18 mm. Water bath (B) (Model SA-100, SANSYO, Tokyo, Japan) supplies cool water to the cooling unit to maintain the temperature of the cell culture medium. Water bath (A) supplies water to the transmitting coil. The water then passes through the receiving coil to cool the coils. The temperature of the medium was monitored using an optical fiber thermometer (PalmSENSE, Photon Control, Burnaby, Canada). Figure 10 shows the temperature dynamics within the cell culture medium. The cell culture medium was maintained within 37 °C ± 0.2 °C.
Diagram of the experimental in vitro exposure system.

Photograph of coils for magnetic resonant coupling WPT within the CO2 incubator.

Temperature dynamics within the cell culture medium.

B) Numerical model
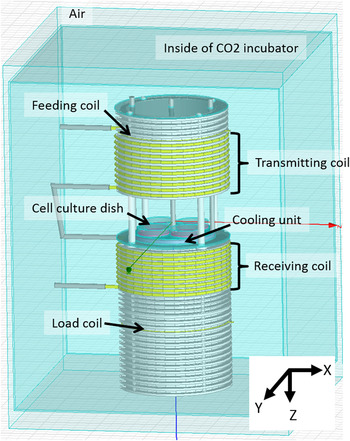
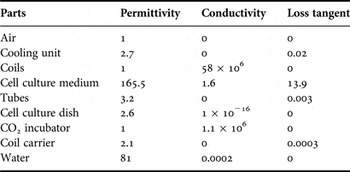
The HFSS–FEM model of the coils for WPT built into the CO2 incubator is shown in Fig. 11. The size and shape of the HFSS–FEM model are the same as those of the actual system, but the coils are simplified using 32 polygons for a smoother simulation. The dielectric properties of the materials used in the simulations are summarized in Table 1. For most of the materials, their properties were extracted from the HFSS materials database. The dielectric properties of the culture medium were measured using a coaxial dielectric probe method at 37 °C. The mass density of the culture medium equals 1.02 g/cm3. The lumped port of impedance 50 Ω is connected to the feeding and load coils. Surfaces of the air are assigned radiation boundary. The simulation was performed on frequency range from 5 to 20 MHz, with an interval of 0.01 MHz. Delta S parameter, which is the criterion used to determine mesh convergence, is 0.02. Refinement per pass, which is the mesh growth for each adaptive pass, is 8%. Basis function of zero order and 0.1 of Lambda refinement is used. The total computational volume contains 1,695,857 tetrahedra. The simulation was carried out on DELL PRECISION T5500 workstation with Intel Xeon processor with 3.07 GHz and 24 GB memory and took approximately 4 h.
HFSS–FEM model of the magnetic resonant coupling in vitro exposure system.

Dielectric properties of materials used for numerical analysis.

C) Effect of CO2 incubator on power transfer efficiency
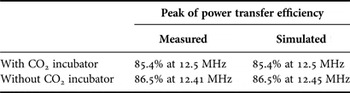
We evaluated the power transfer efficiency using both experimental and numerical methods, as shown in Table 2. The power transfer efficiency was measured experimentally with a power sensor (Model N8481B, Agilent Technologies Japan, Tokyo, Japan) from 11.0 to 15.0 MHz and was estimated by |S21| 2 from the simulated S parameter. Comparing the result of preliminarily evaluation, the resonant frequency is shifted from about 16.0 to 12.5 MHz. This is because stray capacitance of the transmitting and receiving coils are influenced by the Teflon coil carrier. The power transfer efficiency with the CO2 incubator is slightly decreased compared with the power transfer efficiency without the CO2 incubator. A similar result was observed with the numerical model.
Measured and simulated power transfer efficiencies in the in vitro exposure system.

D) Matching
Figure 12 shows the measured power transfer efficiency versus the distance between the receiving and load coils for the in vitro exposure system. The power transfer efficiency was estimated by |S21| 2 , which was measured experimentally with a network analyzer (Model 8753E, Agilent Technologies Japan, Tokyo, Japan) from 10.0 to 16.0 MHz. Figure 13 shows the measured and simulated results of the ratio of the higher-frequency peak (sub peak) to the lower-frequency peak (main peak) versus the distance between the receiving and load coils for the in vitro exposure system. These results show that the two resonant peaks shift to a single peak by increasing the distance between the receiving and load coils. Good agreement was found between the measured and simulated results at a distance of 64 mm between the receiving and load coils.
Measured power transfer efficiency versus distance between receiving and load coils in the in vitro exposure system.

Ratio of subpeak-to-main peak of measured and simulated power transfer efficiencies in the in vitro exposure system.

E) Electric and magnetic fields
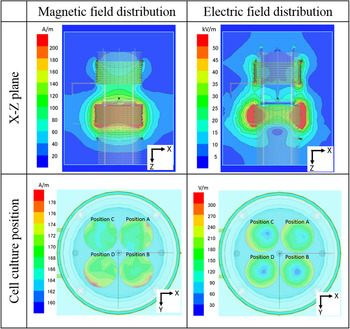
Figure 14 shows the simulated magnetic and electric field distributions on the X–Z plane and at each cell culture position with the 200-W high-frequency power supply at a 12.5-MHz resonant frequency. Table 3 shows the average, standard deviation, and maximum and minimum of the magnetic and electric field distributions at the bottom of each cell culture dish, with a mesh size of 0.1 × 0.1 mm2. The restrictions for workers, as stated in the ICNIRP guidelines [3], are a magnetic field of 80 A/m and an electric field of 170 V/m at 10 MHz. The magnetic field at each position of the cell culture dishes is approximately twice the guidelines, and the electric field is nearly level as the guidelines. The uniformity of the magnetic field distribution at each position of the cell culture dish is within plus or minus a few percent.
Simulated magnetic and electric field distributions on the X–Z plane and at each cell culture position in the in vitro exposure system.

Magnetic and electric fields at each cell culture position.

F) Specific absorption rate
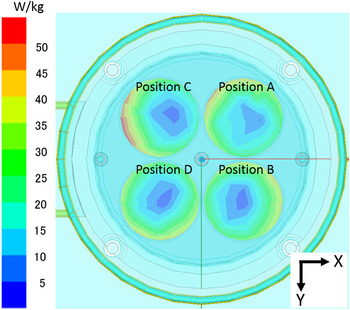
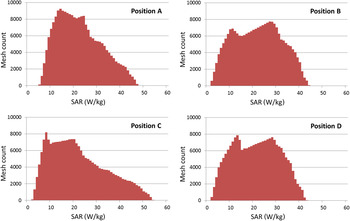
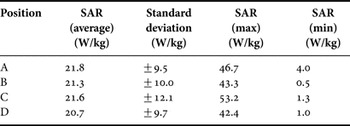
Figures 15 and 16 show the simulated SAR distribution inside the culture medium and histogram with the 200 W high-frequency power supply at a 12.5 MHz resonant frequency. Table 4 shows the average, standard deviation, and maximum and minimum of the SAR distribution at the bottom of each cell culture dish, with a mesh size of 0.1 × 0.1 mm2. The restrictions for workers, as stated in the ICNIRP guidelines [2], are a localized SAR (limbs) of 20 W/kg at 10 MHz–10 GHz. The SAR at each position of the cell culture dish is at the same level as the guidelines.
Simulated SAR distribution inside the culture medium in a 60-mm diameter dish.

Histograms of SAR distribution at each cell culture position. Vertical axis is the number of mesh count. Horizontal axis is SAR with 1 W/kg bin width.

SAR at each cell culture position.

IV. CONCLUSION
In this study, we developed a new in vitro exposure system with WPT using magnetic resonant coupling. The exposure system has a resonant frequency of 12.5 MHz, and the power transfer efficiency at the resonant frequency is 85.4%. To evaluate the biological effects of resonant coupling WPT experimentally using an in vitro study, we referred to the ICNIRP guidelines. The magnetic field at the positions of the cell culture dishes is approximately twice the reference level for occupational exposure as stated in the ICNIRP guidelines [3]. The electric field at the positions of the cell culture dishes is nearly the reference level for occupational exposure. The SAR at the positions of the cell culture dishes match the respective reference levels for occupational exposure as stated in the ICNIRP guidelines [2].
Before evaluating the biological effects of resonant coupling WPT using the in vitro exposure system, we analyzed the cell growth rate and cell cycle distribution of long-term (up to 144 h) cell culture in the exposure system without the 200 W high-frequency power supply to judge whether the exposure system maintains the appropriate conditions for cell culture. The cell growth rate and cell cycle distribution of WI38VA13 subcloned 2RA cells was not affected (data not shown).
Studies to evaluate the biological effects of resonant coupling WPT using our in vitro exposure system are ongoing.
ACKNOWLEDGEMENT
This work was supported in part by a Grant-in-Aid for Scientific Research (B) (grant no. 23310022) from the Japan Society for the Promotion of Science (JSPS) and a Development of New Research Area in Sustainable Humanosphere.
 Kohei Mizuno received his B.S. and M.S. degrees in Electrical Engineering from Osaka University, Osaka Japan, in 2000 and 2002, respectively. He is now with Kansai Electric Power Co., Inc. In addition, he is a Ph.D. candidate in Electrical Engineering at Kyoto University, Kyoto, Japan. His research interests include power transmission line, wireless power transfer technology, and bioelectromagnetics of ELF and RF.
 Junji Miyakoshi received the Ph.D. degree in Anatomy from Osaka City University, Osaka, Japan, in 1982. During 1985–2002, he stayed in Graduate School of Medicine, Kyoto University, Kyoto, Japan. During 2002–2010, he was a Professor at the Faculty of Medicine, Hirosaki University, Hirosaki, Japan. Since 2010, he has been the Professor of the Research Institute for Sustainable Humanosphere, Kyoto University. His main interest is the molecular and cellular effects of electromagnetic fields and ionizing radiation. He was a Working Group Member of IARC for the risk assessment of ELF in 2002 and RF in 2011. He was also a Task Group Member of WHO for the ELF Environmental Health Criteria (EHC) in 2005. He has been serving ICNIRP Standing Committee II since November 2006. He received the Charles Polk Memorial Award in 2004 at Washington DC, USA from the Bioelectromagnetic Society.
 Naoki Shinohara received the B.E. degree in Electronic Engineering, the M.E. and Ph.D. (Eng.) degrees in Electrical Engineering from Kyoto University, Japan, in 1991, 1993, and 1996, respectively. He was a Research Associate in the Radio Atmospheric Science Center, Kyoto University from 1998. He was a Research Associate of the Radio Science Center for Space and Atmosphere, Kyoto University by recognizing the Radio Atmospheric Science Center from 2000, and there he had been an Associate Professor since 2001. He was an Associate Professor in the Research Institute for Sustainable Humanosphere, Kyoto University by recognizing the Radio Science Center for Space and Atmosphere since 2004. Since 2010, he has been a Professor in Research Institute for Sustainable Humanosphere, Kyoto University. He has been engaged in research on Solar Power Station/Satellite and Microwave Power Transmission system.