
Introduction
Tungsten trioxide (WO3) is one of the most widely studied electrochromic materials[Reference Mortimer1]; it has been used in smart windows, driving mirrors, displays, automobile glazing, and as a photocatalyst.[Reference Mortimer1, Reference Ng2] The introduction of dopants to the system (typically monovalent dopants such as H, Li, or Na[Reference Ingham, Hendy, Chong and Tallon3, Reference Xue, Zhang and Zhang4]) leads to a strong decrease in transmittance at infrared and visible wavelengths, and typically blue coloration.
Surprisingly, the mechanism of electrochromism is still poorly understood. A number of mechanisms have been proposed to explain electrochromism in WO3, including absorption by deep defect levels[Reference Wang, Di Valentin and Pacchioni5] or by small polarons.[Reference Schirmer, Wittwer, Baur and Brandt6, Reference Granqvist7] Here we propose an alternative explanation, which is consistent with all the experimental observations: the absorption of light in momentum-conserving (i.e., direct) transitions of electrons filling conduction-band states. Indeed, the intercalation of dopants leads to the introduction of carriers in the conduction band,[Reference Goldner, Norton, Wong, Foley, Goldner, Seward and Chapman8, Reference Mendelsohn and Goldner9] as evidenced by the observation of higher electrical conductivities.[Reference Deneuville and Gerard10, Reference Berggren, Ederth and Niklasson11] It was noted[Reference Xue, Zhang and Zhang4, Reference Goldner, Norton, Wong, Foley, Goldner, Seward and Chapman8, Reference Goldner, Mendelsohn, Alexander, Henderson, Fitzpatrick, Haas, Sample, Rauh, Parker and Rose12] that these carriers can lead to an increase in IR reflectivity; however, to our knowledge, the impact of carrier absorption on absorption at visible wavelengths has not been explored to date. Carriers introduced by doping can absorb photons and be excited to higher lying conduction-band states. In this paper, we demonstrate that carrier-induced absorption significantly contributes to the optical absorption not only at infrared but also at visible wavelengths. We analyze how this absorption depends on doping level and demonstrate the correlation between the absorption coefficient and the structure of the material.
Our proposal for the role of carrier-induced absorption is also consistent with the observation that oxygen vacancies lead to electrochromic behavior.[Reference Berak and Sienko13] In prior work,[Reference Wang, Janotti and Van de Walle14] we established that oxygen vacancies act as shallow donors and introduce electrons in the conduction band (as opposed to forming deep levels or giving rise to polarons). By invoking carrier-induced absorption, the enhancement of electrochromism due to oxygen deficiency can then be explained at the same level as the effects caused by dopant intercalation of alkali metals.
First-principles investigations on the optical properties of WO3 have focused on undoped phases.[Reference Ping, Rocca and Galli15] Other experimental and computational studies invoked the phenomenologic Drude model to analyze the optical spectra of intercalated WO3.[Reference Xue, Zhang and Zhang4, Reference Goldner, Norton, Wong, Foley, Goldner, Seward and Chapman8, Reference Mendelsohn and Goldner9, Reference Goldner, Mendelsohn, Alexander, Henderson, Fitzpatrick, Haas, Sample, Rauh, Parker and Rose12] The Drude model involves fitting parameters to experiment and is not suitable for describing optical behavior in the visible. Our objective is thus to use first-principles calculations to quantify carrier-induced absorption across the IR and visible spectrum and build an understanding of the dependence on doping level and structural distortions.
We focus on direct optical transitions in which the crystal momentum is conserved, and the initial states are occupied with doping-induced carriers, which we shall refer to as carrier-induced absorption. Indirect transitions, usually assisted by phonons, can also cause absorption, but are typically smaller in magnitude than direct transitions; indirect transitions tend to dominate in materials in which direct transitions are suppressed due to the lack of final states.[Reference Peelaers, Kioupakis and Van de Walle16] We will see that the conduction-band structure of WO3 offers many opportunities for final states of such direct transitions, and these will dominate the absorption.
We apply our formalism to the cubic, monoclinic, and disordered phases of WO3 in order to understand the influence of structural distortions. Our results demonstrate that carrier-induced optical transitions lead to significant absorption in the infrared in the crystalline phases of WO3. Structural distortions lead to enhanced absorption at visible wavelengths; such distortions occur in the monoclinic phase and are particularly large in the disordered phase. We relate the changes in the optical transition matrix elements to changes in bonding caused by structural distortions. Our results allow us to conclude that carrier-induced absorption plays a significant role in the optical absorption and coloration of WO3, and we quantify these effects.
Background and methodology
Theoretical background
The absorption coefficient as a function of photon frequency ω can be expressed as
 $${\bar \alpha} = \displaystyle{\omega \over {n_{\rm r}c}}{\bar \varepsilon} _2,$$
where n r(ω) is the index of refraction, c the speed of light, and  $\bar \varepsilon _2$ the imaginary part of the dielectric function. The latter is given by [Reference Peelaers and Van de Walle17]
 $$\eqalign{{\bar \varepsilon} _2(\omega ) &= 2\displaystyle{{4\pi ^2e^2} \over {\omega ^2}}\displaystyle{1 \over {V_{{\rm cell}}}}\displaystyle{1 \over {N_{\bf k}}}\sum\limits_{ij{\bf k}} { \vert {\hat {\bf e}} \cdot {\bf p}_{ij}({\bf k}) \vert ^2} \cr & \times \Delta f\delta (\varepsilon _{\,j,{\bf k}} - \varepsilon _{i,{\bf k}} - \hbar\!\omega ),} $$
where ħω and ê are the photon energy and polarization, p ij(k) is the dipole transition matrix element between bands i and j, Δf = (f i,k−f j, k) contains occupation statistics for electrons, and ε i, k is the electron energy of band i at state k. The δ function ensures energy conservation for the pair of electronic states separated by the photon energy ħω. The factor of two accounts for the spin degeneracy. In general,  $\bar \varepsilon _2$ is a tensor. In the cubic and disordered phase, the response is isotropic. Using the Kramers–Kronig relations, the real part of the dielectric function can be computed, and in combination with the imaginary part, the absorption is determined via Eq. (1).
The dipole transition (or optical) matrix elements are calculated using the matrix elements of the velocity operator.[Reference Peelaers, Steiauf, Varley, Janotti and Van de Walle18, Reference Yates, Wang, Vanderbilt and Souza19] We use Wannier functions[Reference Marzari, Mostofi, Yates, Souza and Vanderbilt20] in order to efficiently sample the Brillouin zone to calculate band structures and dielectric functions.[Reference Peelaers and Van de Walle17]
Computational details
We use density functional theory in the generalized Kohn–Sham approach and projector-augmented wave potentials, as implemented in the Vienna Ab-initio Simulation Package (VASP).[Reference Kresse and Furthmüller21, Reference Kresse and Furthmüller22] For W, the 5d and 6s states are treated in the valence; for O, the valence states are 2s and 2p. In all calculations, we use the screened hybrid functional of Heyd, Scuseria, and Ernzerhof (HSE),[Reference Heyd, Scuseria and Ernzerhof23] which mixes exchange from the generalized gradient approximation[Reference Perdew, Burke and Ernzerhof24] with screened Hartree–Fock exchange at the standard 25% mixing. A plane-wave cutoff of 500 eV is used. For equilibrium crystalline structures, a k-point mesh of 6 × 6 × 6 for the four-atom cubic phase and 4 × 4 × 4 for the 32-atom monoclinic phase are used.
To generate disordered structures, we use molecular dynamics simulations, following the procedure outlined in Ref. [Reference de Wijs and de Groot25]. Details of our procedure are described in online Supplementary Material.
Optical properties are calculated using a 100 × 100 × 100 k-point mesh for the cubic phase, 30 × 30 × 30 for the monoclinic phase, and 10 × 10 × 10 for the amorphous phase. Our methodology for determining the Fermi level is provided in online Supplementary Material.
Results
We report the results for doping up to 1021 cm−3. In order to elucidate the contribution of induced carriers to absorption, we distinguish between transitions from valence to conduction states (VB → CB) and transitions between initial states filled with induced carriers and higher lying conduction bands; we refer to these as CB → CB transitions.
Crystalline WO3
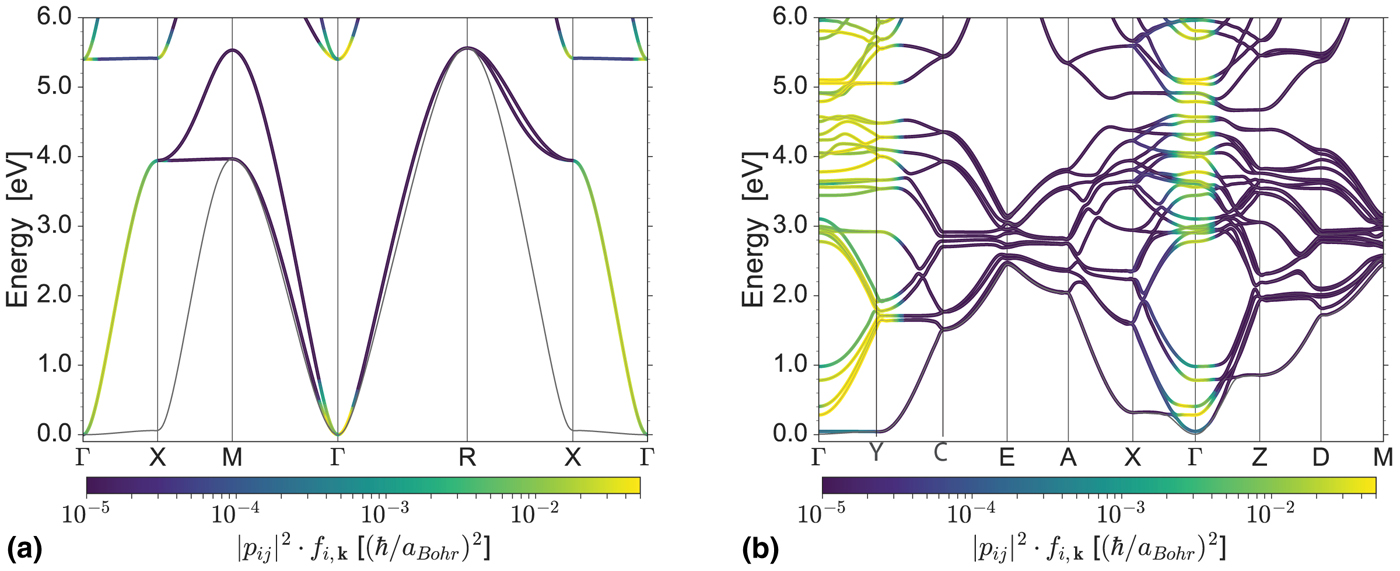
First, we consider the cubic and monoclinic phases. While the cubic phase has no structural distortion, the monoclinic phase contains rotations of the octahedra and displacement of the W atom from the center of the octahedra. Our calculated lattice parameters and band gaps for the crystalline phases are in good agreement with the experimental results and with the previous computational investigations based on HSE (see Ref. [Reference Wang, Janotti and Van de Walle26]). The band structures, along with information about optical transition matrix elements, are presented in Fig. 1. The calculated band gap is 1.53 eV in the cubic phase and 2.56 eV in the monoclinic phase. The valence bands have predominantly O 2p character, and the conduction bands are comprised primarily of W 5d states, separated into t 2g and e g states due to crystal-field splitting in an octahedral environment.
Electronic band structure of conduction bands in (a) cubic and (b) monoclinic phases of WO3 calculated with HSE. The zero of energy is set at the CB minimum. Conduction bands are colored according to the strength of optical transitions to higher lying bands weighted by the occupation factor, i.e., according to the sum of |pij|2 for CB → CB transitions weighted by the occupation factor f i,k. i is the initial occupied state, and j is the band in question. Occupations are at room temperature based on 1021 cm−3 doping.

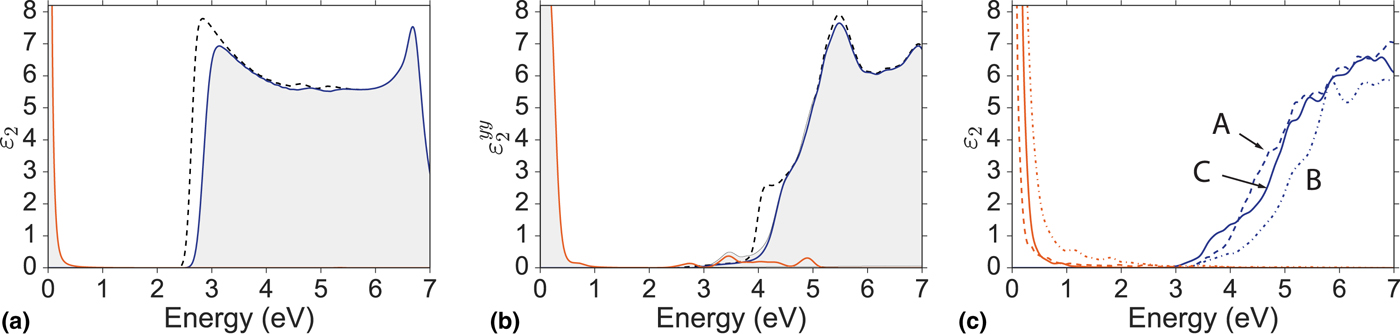
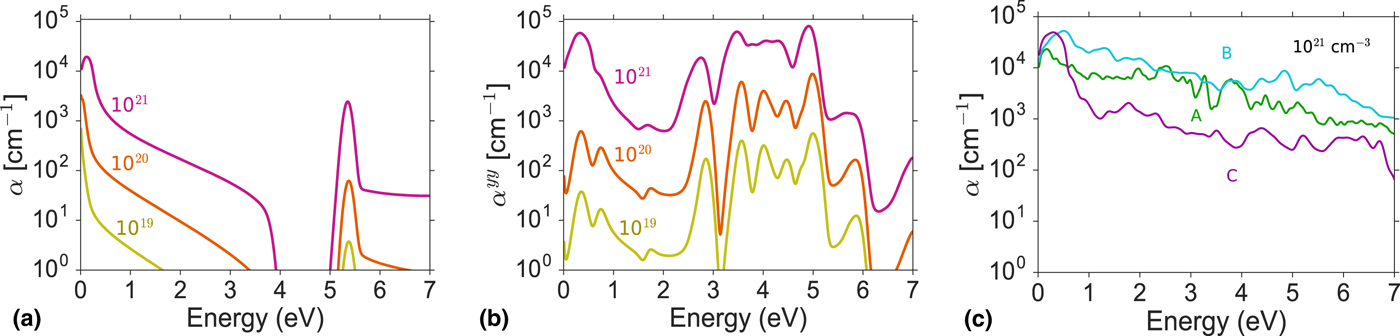
The calculated imaginary part of the dielectric function ε 2 for both phases is shown in Figs. 2(a) and 2(b). The corresponding absorption spectra are shown in Fig. 3. Our ε 2 spectra for the undoped case compare well with the spectra based on the G0W0 and Bethe–Salpeter approximation,[Reference Ping, Rocca and Galli15] as well as those derived from experimental reflectivity spectra.[Reference Lynch, Rosei, Weaver and Olson27] The onset of VB → CB absorption occurs at much higher energy in monoclinic compared with cubic; this is due to a suppression of optical transitions from the highest VBs to the lowest CBs. Our calculations show that each order of magnitude increase in doping leads to roughly an order of magnitude increase in absorption for CB → CB transitions, as shown in Figs. 3(a) and 3(b).
Imaginary part of the dielectric function ε 2 for (a) the cubic phase, (b) the monoclinic phase (yy-component only), and (c) three disordered structures of WO3 at 1021 cm−3 doping. VB → CB contributions are shown in blue, CB → CB in orange. The respective undoped spectrum (dotted black line) is shown for the crystalline phases.

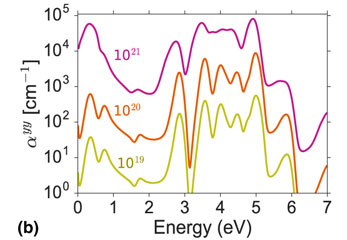
Absorption coefficient (on a logarithmic scale) for CB → CB transitions for (a) the cubic, (b) the monoclinic phase, and (c) for three disordered structures of WO3. For the cubic and monoclinic phases, results are shown for three doping levels (1019, 1020, and 1021 cm−3); for the disordered phase, the doping level is 1021 cm−3.

We first focus on the cubic phase [Figs. 2(a) and 3(a)]. A notable feature is the Burstein–Moss shift, which is the increase in optical band gap due to electrons occupying the lower CB states. This shift is minimal for doping up to 1019 cm−3. At 1020 cm−3 the Burstein–Moss shift is 0.01 eV, and it increases to 0.16 eV for 1021 cm−3. These shifts are modest, even at the highest doping levels, due to the presence of the low-dispersion conduction band along the Γ → X direction, which sustains a high density of states. The peak in ε 2 at 2.75 eV coincides with VB → CB energies from the flat valence bands to the flat portions of the lower lying t 2g conduction-band states along the Γ → X direction [Fig. 1(a)].
Figures 2(a) and 3(a) show that the introduction of excess carriers leads to strong absorption in the infrared. At a doping level of 1021 cm−3, α reaches 104 cm−1, and then tails off to 102 cm−1 in the visible range before another peak emerges above 5.0 eV. The peak above 5.0 eV corresponds to transitions to e g states.
In the monoclinic structure, the structural distortions break the degeneracies in electronic states of the cubic phase, leading to additional allowed transitions. The Burstein–Moss shift is small for doping up to 1020 cm−3 and amounts to 0.07 eV for 1021 cm−3. Similar to the cubic phase, these shifts are small due to the flat bands along the Γ → Y direction [Fig. 1(b)]. Absorption is strongest corresponding to ε yy; ε xx is comparable to ε yy, but ε zz is an order of magnitude smaller. Absorption of light polarized along the Cartesian x and y directions is about an order of magnitude stronger than along the z direction.
Figure 3(b) shows the absorption spectra as a function of doping in the monoclinic phase. At 1020 cm−3, carrier-induced absorption reaches almost 103 cm−1 in the infrared; in the visible, absorption exceeding 103 cm−1 occurs in the blue region of the spectrum. These features are enhanced at the higher doping level of 1021 cm−3: absorption in the infrared exceeds 104 cm−1, and in the visible it is higher than 103 cm−1, rising to above 104 cm−1 in the blue.
Focusing on the visible regime, we see that absorption in the cubic phase tapers off at higher energies, while in the monoclinic phase, it is more constant and shows a peak just below 3 eV. This blue peak originates from strong transitions to a set of t 2g bands around 2.8 eV above the CB minimum, as can be seen in Fig. 1. No such transitions occur in the cubic phase; they become allowed due to the structural distortions present in the monoclinic phase.
Disordered WO3
Since the enhancement of CB → CB absorption in the monoclinic phase is due to the presence of distortions, we expect even stronger absorption in amorphous structures. The disorder introduces defects that lead to localized states in the band gap; as explained in the Supplementary Material, for the purposes of calculating absorption, we neglect these states and take the band edge to be the first electronic state not associated with a defect or localized state of the structure. We verified that our results for optical absorption are not sensitive to the exact choice of the band edges. We generate three disordered structures, referring to them as structures A, B, and C, with band gaps 3.01, 3.20, and 2.90 eV.
Figure 2(c) shows ε 2 and Fig. 3(c) the carrier-induced absorption spectra for the three disordered structures. We focus on a carrier concentration of 1021 cm−3, which is a typical doping level.[Reference Wen, Granqvist and Niklasson28] Relative to the crystalline phases, the spectra are broadened, with strong absorption across all photon energies. This broadening reflects the wider distribution of atomic bond lengths and angles in the disordered structures (see online Supplementary Material).
Microscopic origins of enhanced optical absorption
We now discuss how the electronic structure and optical matrix elements contribute to carrier-induced optical transitions. Transitions in the infrared occur due to the presence of multiple conduction-band states with small energy differences. The 1∕ω 2 factor in ε 2 [Eq. (2)] leads to a large peak as the photon energy approaches zero (Fig. 2). This enhancement is not present in the absorption coefficient α, which is proportional to 1∕ω.
To correlate the enhancement of absorption in the visible with structure distortion, we examine the dipole matrix elements, which measure the strength of the optical transitions. Information about these matrix elements is included in Fig. 1. Transitions can only take place if initial states are occupied, and therefore the strength of optical transitions is weighted by the Fermi occupation (for a doping level of 1021 cm−3) of the conduction-band states. As multiple bands can be occupied at 1021 cm−3 doping, we sum the occupation-weighted square of the matrix elements associated with transitions originating from these occupied states. If the conduction bands had purely W 5d character, all optical transitions would be forbidden because of the selection rule that requires |Δl| = 1. Hybridization between the W 5d and O 2p states relaxes this restriction and leads to transitions between conduction bands that are remarkably strong.
This can be seen when comparing cubic and monoclinic WO3. The transition strength relates to the nature of the initial and final states. In cubic WO3, strong transitions occur along Γ → X, Γ → R, and Γ → M (in Fig. 1, the transition strength is weighted by the occupation of the initial states). Such transitions are still present in the monoclinic phase, but they are supplemented by transitions in the visible that become allowed due to symmetry lowering. The distortions of the monoclinic structure cause increased mixing of W d and O p states, in particular allowing transitions to states around 2.8 eV above the CB minimum.
In the disordered structures, the extent of hybridization further increases due to larger structural distortions, leading to even larger absorption. The trends in Fig. 3 clearly indicate that larger structural distortions, through enhanced hybridizations, lead to a strong increase in the strength of the optical transitions.
A mechanism for coloration
As an electrochromic material, WO3 has been reported to change color upon intercalation of alkali dopants[Reference Mortimer1, Reference Xue, Zhang and Zhang4] and in the presence of oxygen deficiencies.[Reference Berak and Sienko13, Reference Lee, Deshpande, Parilla, Jones, To, Mahan and Dillon29] Several mechanisms for the coloration have been proposed. In the first mechanism,[Reference Schirmer, Wittwer, Baur and Brandt6, Reference Bondarenko, Eriksson and Skorodumova30] excess carriers are proposed to form polarons, reducing the formal oxidation state of W6+ to W5+ or W4+. Absorption would occur when polarons hop between sites. This is a valid mechanism, but the energy absorbed in polaron hopping is relatively small, typically below 0.5 eV.[Reference Bondarenko, Eriksson and Skorodumova30] So, while this could explain the observed absorption in the infrared, it cannot be responsible for coloration at visible wavelengths. In addition, we have previously shown that small polarons are not stable in crystalline WO3.[Reference Wang, Janotti and Van de Walle26]
In the second proposed mechanism, sub-band-gap defect states lead to absorption.[Reference Wang, Di Valentin and Pacchioni5] Transitions from a defect level to the band edge would occur at energies well below the band-gap energy and again cannot explain absorption in the visible. We have also shown that oxygen vacancies, which have been commonly suggested as the source of deep defect levels,[Reference Wang, Di Valentin and Pacchioni5] are actually shallow donors in crystalline WO3, with defect states resonant with the conduction band.[Reference Wang, Janotti and Van de Walle14] These mechanisms therefore do not explain the strong absorption in the visible that is necessary to explain coloration.
In the present work, we focus on a third mechanism, namely the absorption of photons by carriers that are induced by doping. Free-carrier absorption has been suggested before,[Reference Xue, Zhang and Zhang4, Reference Goldner, Norton, Wong, Foley, Goldner, Seward and Chapman8, Reference Mendelsohn and Goldner9] but only in the context of the phenomenologic Drude model, which cannot be expected to produce reliable results at visible wavelengths. The carrier-induced absorption mechanism studied here leads to significant absorption not just in the infrared but also at visible wavelengths.
We note that direct absorption by excess carriers is not limited to electrons that are in extended states; even if localization occurs (which is more likely in disordered structures), excitation of electrons out of such states into higher lying conduction-band states will give rise to similar absorption spectra as described above (see online Supplementary Material for spectra calculated with localized states included).
For practical applications, the transmittance is the quantity of interest, which can be correlated with the calculated carrier-induced absorption. The expected fraction of incident light transmitted can be calculated with T = e −αd, where α is the absorption coefficient and d is the thickness of the material; we neglect any reflection and assume normal incident light. Typical sample thicknesses range from 100 nm to a few micrometers; for such thicknesses, absorption coefficients need to be significantly larger than 102 cm−1 to result in perceptible darkening. We calculated that at a doping level of 1021 cm−1, α in amorphous samples can be 104 cm−1 or higher in the visible range, with higher values in the red region of the spectrum. Even for a relatively thin film, with a thickness of 100 nm, this leads to a 10% drop in transmittance and perceptible darkening. This confirms that carrier-induced direct absorption is the likely mechanism for coloration.
Conclusion
We perform state-of-the-art first-principles calculations on the optical properties of WO3 and investigate the influence of structural distortions in cubic, monoclinic, and disordered WO3. Our calculations show that strong carrier-induced direct absorption occurs at infrared and visible wavelengths, scaling with the level of doping. We find that structural distortions lead to enhanced absorption due to an increase of hybridization between the W and O states, explaining the increase in absorption strength in going from cubic to monoclinic to disordered structures. Our results demonstrate that carrier-induced absorption provides a consistent explanation for electrochromism.
Supplementary material
The supplementary material for this article can be found at https://doi.org/10.1557/mrc.2018.115.
Acknowledgments
The authors thank A. Janotti, K. Krishnaswamy, S. J. Allen, and M. McCluskey for fruitful discussions. This work was supported by the US Department of Energy, Office of Science, Basic Energy Sciences, under Award No. DE-FG02-07ER46434. W. W. acknowledges this material is based upon the work supported by the National Science Foundation (NSF) Graduate Research Fellowship under Grant No. DGE 1144085. Computational resources were provided by the Center for Scientific Computing at the CNSI and MRL: an NSF MRSEC (DMR-1720256) and NSF CNS-0960316; the Extreme Science and Engineering Discovery Environment (XSEDE), which is supported by NSF Grant No. ACI-1548562; and in part by an ONR grant and computer time from the DOD High Performance Computing Modernization Program at the AFRL DSRC and ERDC DSRC under Project No. ONRDC36953418.