I. INTRODUCTION
Poly(vinylidene fluoride) (PVDF) is a semi crystalline polymer that has drawn both scientific and technological attentions because of the useful pyroelectricReference Takahashi and Tadakoro1 and piezoelectricReference Takahashi, Matsubara and Tadakoro2 properties. It is also one of the rare polymers that exhibit diverse crystalline forms, having five different phases known as α, β, γ, δ and ε.Reference Gao and Scheinbeim3–Reference Maiti, Chatterjee, Rana and Nandi5 The polar phases e.g., β and γ are technologically most interesting because of its better pyroelectric and piezoelectric properties. Other notable properties of PVDF are its typical fluoropolymer characteristics like hydrophilicity and high mechanical strength. Because of these properties PVDF has been considered as a good candidate for the following sensing applications: pressure,Reference Johnson, Blyler, Crane and Gieniewski6 temperature,Reference Jassa and Arshak7 gas,Reference Takse and Odajima8 and electromagnetic wave sensors. It is also used in nonlinear opticsReference Naoto, Yashiaki and Tsuyoshi9 and microwave transducers.Reference Tawansi, Abdelkader, Balachandran and Abdelrazek10PVDF is water-resistive material; therefore, it is suitable for outdoor and indoor paint.Reference Hughes and Piery11 Moreover, it has important medical applicationsReference Valentini, Vargo, Gardella and Aebischer12 because of its nonrejectability in human tissues.
Various studies on PVDF have been previously conducted to analyze the effect of addition of different fillers on physical properties of the composites. Blending with poly(methyl methacrylate) (PMMA) was described as an original way to force PVDF to crystallize into the piezoelectric phase, which is thermodynamically unstable in pure material.Reference Leonard, Halary and Monnerie13 Abdelaziz et al. investigated the physical properties of PVDF films filled with CuCl2Reference Tawansi, Ayad and Abdelrazek14 and MnCl2.Reference Tawansi, Oraby, Abdelrazek, Ayad and Abdelaziz15 These investigations revealed that these fillers modified the structural, electrical, and/or magnetic properties of the matrix PVDF. However, a nonlinear (even nonmonotonic) filling level (FL)-dependence on the contents of the active structural forms was found. Piezoelectric β-form can usually be crystallized by applying suitable conditions like poling at high voltage,Reference Scheinbeim, Nakafuku, Newman and Pae16 recrystallization of carbon- coated highly oriented ultra thin filmReference Wang, Li, Liu, Duan, Jiang and Yan17 and molecular epitaxy on the surface of potassium bromide.Reference Lovinger18 Addition of nanofillers like nanoclayReference Priya and Jog19 and carbon nanotube (CNT)Reference Yu, Zheng, Yu, Zhang, Jiang and Zhao20 shows the growth of β-form in PVDF. Shah et al. added nanoclay to PVDF to form nanocomposites and reported a remarkable enhancement in the toughness.Reference Shah, Maiti, Gunn, Schmidt, Jiang, Butt and Giannelis21 The addition of calcium sulfate whiskers to PA66/PVDF blends improves the tensile and flexural performances.Reference Wang, Mu, Ren, Jian, Zhang and Yang22 Addition of ceramic material to a high strength polymer is an interesting and inexpensive method to modify various properties of a polymer. Silicon carbide (SiC) ceramic offers excellent strength, chemical resistance at high temperature, semi-conductivity, high thermal stability and thermal conductivity for uses as high-temperature structural materials as well as in electric devices that function at elevated temperatures.Reference Fissel, Schroter and Richter23, Reference Krstic24
In this work, we study the effect of addition of silicon carbide (SiC) to various properties of PVDF. The α to β phase transition has been characterized by x-ray diffraction (XRD) and Fourier transform infrared (FTIR) spectroscopic analyses. The thermal analysis is performed by using differential scanning calorimetry (DSC) to show the structural change. Optical micrographs and scanning electron micrographs show deformation of spherulite structure of PVDF due to incorporation of SiC particle. We also report the mechanical properties, contact angle measurement, dielectric relaxation and resistivity after the incorporation of SiC for evaluating cause of alteration in presence of SiC.
II. EXPERIMENT
A. Materials
A commercial PVDF, (SOLEF 6008; Ausimont, Milano, Italy), was used in this work and was prepared into films of 0.2 mm thickness by compression molding. The laboratory-grade SiC was purchased from Carborundum Universal Ltd. (Chennai, India) in powder form.
1. Composite preparation
The composite was prepared by solution casting method. The PVDF was dissolved in dimethyl formamide (DMF) solvent at 60 °C. Measured quantity of SiC powder was added to the solution and was stirred to ensure homogeneous mixing. After good dispersion at suitable viscosity, the composite film was prepared by casting onto a glass Petri dish and left to evaporate the solvent slowly by heating it and thereafter, it was kept in vacuum oven at 60 °C for 48 h for complete removal of solvent from composites. The SiC concentration was varied in composite film. Four films of composition PVDFCx were prepared where x is the weight percent of SiC added and x = 0, 2, 5, 10.
B. Characterization
1. XRD Analysis
XRD experiments were performed using a Bruker AXS D8 Advance wide-angle x-ray diffractometer (Madison, WI) with Cu Kα radiation and a graphite monochromator (wavelength, λ = 0.154 nm). The generator was operated at 40 kV and 40 mA. Thin films of pure PVDF, its composites and a pallet of SiC were placed on a quartz sample holder at room temperature and were scanned at diffraction angle 2θ from 1° to 40° at a scan rate of 1°/min to explore the nanostructure and crystalline structure of pure PVDF and its composites.
2. FTIR analysis
FTIR analysis of pure PVDF and its composites was done from 1000 to 500 cm−1 using very thin films of the composites and pure PVDF.
3. DSC analysis
The melting temperature, crystallization temperature and heat of fusion of pure PVDF and its composites were measured in a Mettler 832 DSC instrument (Greifense, Switzerland). The samples were heated at a scan rate of 10 °C/min. The peak temperature and enthalpy of fusion were measured from the endotherm using standard software. After the first melting, the samples were cooled down at a constant rate of 10 °C/min to find the crystallization temperature and heat of crystallization in a similar fashion. Further, a second heating was taken to ensure the amount of crystallinity and melting temperature after removing all the thermal history in the first run. The DSC was calibrated with indium and zinc before use.
4. Polarized optical microscope image
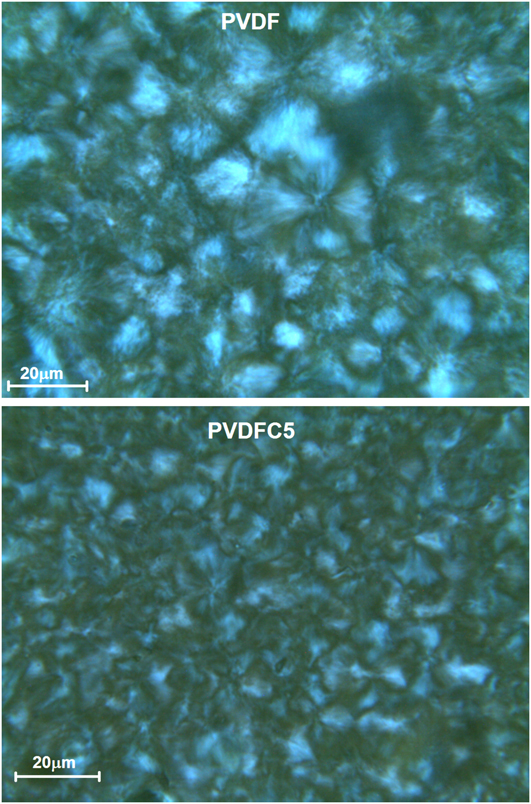
Spherulitic growth was observed using an Olympus optical microscope (Tokyo, Japan). The photographs were captured with the help of a camera attached to the microscope at a magnification of 500×.
5. Mechanical strength
Tensile tests were performed on the microinjected dog bone shaped samples at room temperature using a universal testing machine (Instron, Norwood, MA) at a strain rate of 5 mm/min. Two samples were tested for each specimen.
6. Contact angle
Contact angle measurement of pure PVDF and its composites was carried out by using Kruss F-100 tensiometer (Hamburg, Germany). The strip was immersed in water at room temperature and the contact angle was measured in advance mode.
7. Two-probe conductivity
The DC electrical resistivity was measured of pure PVDF and its composites at room temperature. The films of the specimens were coated with a homogeneous layer of silver paste. This paste was allowed to dry before carrying out the measurements.
8. Dielectric measurements
Dielectric measurements were performed on disc-shaped films of 11.1 mm diameter. The samples were silver-coated on opposite faces and the measurements were carried out between frequencies 10−3 to 107 Hz in a high-resolution dielectric analyzer (Novocontrol Alpha A high performance frequency analyzer, Hundsangen, Germany). The accuracy of dielectric analyzer is 0.2%.
III. RESULTS AND DISCUSSION
A. Structural change
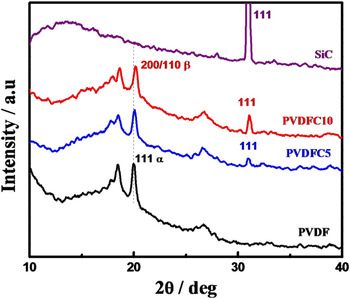
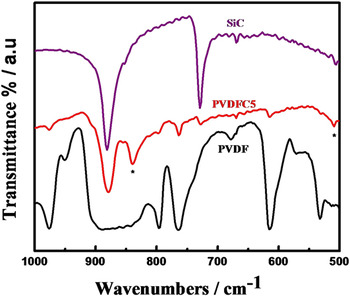
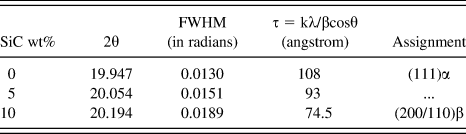
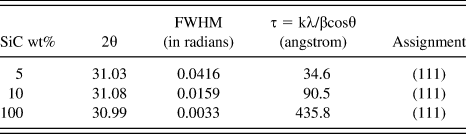
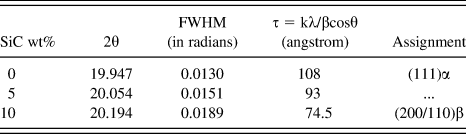
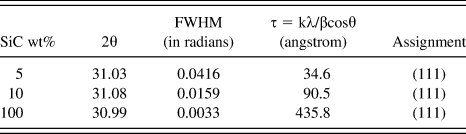
The x-ray diffraction patterns of pure PVDF, pure SiC and their composites with 5 and 10 wt% of SiC in PVDF matrix have been shown in Fig. 1. Pure PVDF crystallizes in stable α phase with characteristic peaks at 17.6°, 18.3° and 19.9°, corresponding to (110), (020) and (111) crystal planes, respectively. In case of pure SiC, the diffraction peak at 2θ = 30.9°, corresponding to the plane (111). The diffraction peak for PVDFC5 at 2θ = 20.1° is due to formation of β phase corresponding to the plane (200/110) together with predominant α phase diffraction peaks. A shifting toward higher angle is also observed with increase in SiC content. The diffraction peak for (200/110) plane of PVDFC10 is observed at 2θ = 20.2° showing more β content. Thus, it is observed that the β content increases with increase in SiC content affecting the nature of crystallization in presence of SiC particles.Reference Tiwari, Kulriya, Avasthi and Maiti25, Reference Tiwari, Kulriya, Avasthi and Maiti26 The crystalline peak position, crystallite size and peak assignments of all the major peaks are listed in Tables I(a) and I(b). The crystallite size of PVDF, as measured using Scherrer equation, decreases with increasing SiC content due to favorable interaction between polymer and SiC particle. The crystallite size of SiC increases with increase of the percentage of SiC in composite due to agglomeration. Figure 2 shows the FTIR spectrum of PVDF and its composites in the range of 500–1000 cm−1. The α crystalline peaks of pure PVDF are clearly observed at 763 and 796 cm−1 but the peak intensity gradually diminishes with increasing SiC content. Simultaneously, strong β-peaks at 840 and 510 cm−1 are observed in composites, corresponding to CH2 rocking and CF2 asymmetric stretching indicating a change in the crystal structure of the polymer in presence of SiC. The absorption band at 763 cm−1 is related to in-plane bending vibration. The FTIR analyses,therefore, support the formation of piezoelectric β-phase in presence of SiC. It is worth mentioning here that the peaks from x-ray and FTIR assigned for β phase are quite broad, indicating the presence of some mixed α-phase as well. Therefore, it can be concluded that the polymer chains, away from the surface of SiC particles crystallize in α-phase and those chains which are in close proximity of SiC crystallizes in β-phase. The assignment of the peaks is in agreement to the result reported in the literature.Reference Tiwari, Kulriya, Avasthi and Maiti26, Reference Manna, Batabyal and Nandi27
XRD patterns showing development of β phase in PVDF- SiC composites.

FTIR curves showing appearance of β peak marked with (*) in PVDFC5 composite.

The values of 2θ and respective d spacing for PVDF peaks as observed in the x-ray diffraction scans.
The values of 2θ and respective d spacing for SiC peaks as observed in the x-ray diffraction scans.
B. Thermal behavior
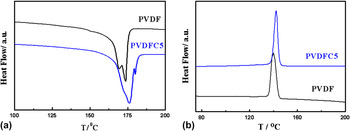
DSC thermograms of PVDF and PVDFC5 are presented in Figs. 3(a) and 3(b) for the heating and cooling processes. PVDF shows double melting peaks primarily due to melt recrystallization indicative of α-phase. But, incorporation of SiC in polymer matrix show much higher melting temperature than that of pure PVDF. The melting points are 169.7° and 175.9 °C for pure PVDF and PVDFC5, respectively. Higher melting peak for composite also suggests the formation of β-phase.Reference Tiwari, Kulriya, Avasthi and Maiti26 Heat of fusion (∆H) of pure PVDF and PVDFC5 are 61 and 27 J.gm, respectively. Reduction of ∆H in composites is due to induced β-phase of PVDF in presence of SiC. Figure 3(b) compares the cooling isotherms of PVDF and PVDFC5 showing higher crystallization temperature for composite (142 °C) than that of pure PVDF (140 °C). Hence, SiC particles act as nucleating agents and, thereby, the polymer chains nucleate easily on the heterogeneous surface of SiC particle.
DSC thermograms of pure PVDF and PVDFC5: (a) melting endotherm, and (b) cooling curves at a heating/cooling rate of 10 °C/min.

C. Surface morphology and modification
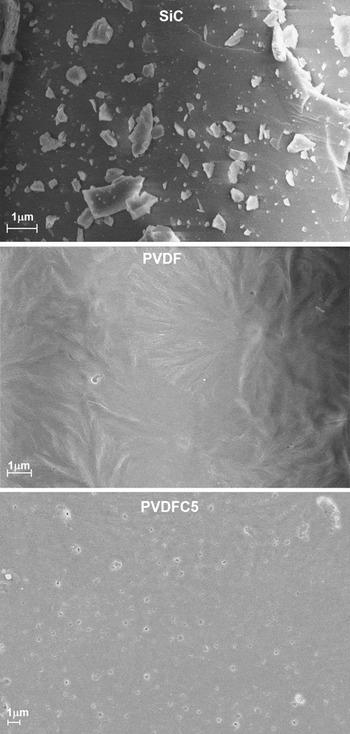
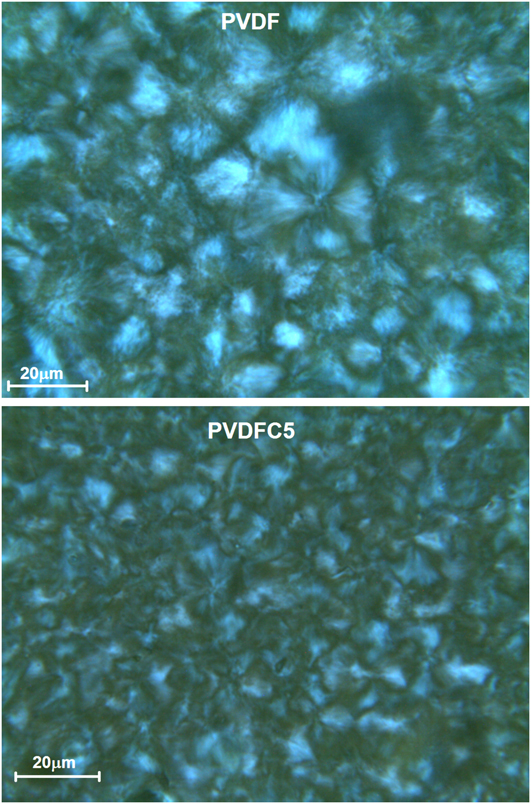
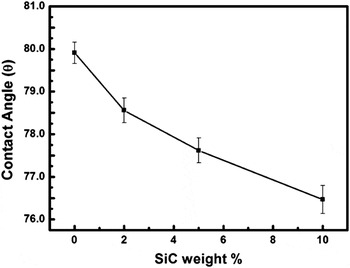
Figure 4 shows the scanning electron micrographs (SEM) of pure SiC, PVDF and PVDFC5. SiC particles are clearly visible with a wide range of flake from nanometer to micrometer size. Pure PVDF exhibits spherulite structure indicating α-phase in melt cast sample. On the contrary, tiny particles of SiC are uniformly distributed in the composite and spherulitic nature of these PVDF particles is also evident. We can conclude that even though there is signature of β-phase in the composite as evident from XRD, FTIR and DSC studies, significant amount of α-phase is also present in the composite. It is believed that PVDF crystallizes on the surface of the SiC particles in β−crystalline form and the polymer chains away from SiC particle crystallize in usual α-form. As the size of SiC particle is not small enough the overall surface area is quite small limiting the amount of β-phase in composite. In case of nanoparticles like layered silicate, the surface area is significantly high causing formation of greater quantity of β-phaseReference Shah, Maiti, Gunn, Schmidt, Jiang, Butt and Giannelis21 and there is a complete loss of birefringence in optical images as well. The appearance of spherulite with less contrast in this composite clearly indicates the presence of α-phase in addition to some β-phase primarily on top of the SiC flakes. The optical images also show the compact spherulite of pure PVDF while it becomes coarse in composite (Fig. 5). SiC particles create a barrier in the crystal growth front causing coarse spherulite in the composite as compared with compact and ordered spherulite in pure PVDF. It is also observed that the spherulites become coarser and smaller in size with increasing amount of SiC in the composite. Figure 6 compares the contact angle of PVDF in presence of SiC filler to investigate the hydrophilic nature of the surface. Pure SiC is hydrophilic and thus it is expected that the water absorption of PVDF increases on addition of SiC to PVDF. It is clear that the contact angle of the film decreases (∼4°) with increase in SiC concentration (Fig. 6). Thus, the composite films become hydrophilic on increasing the concentration of SiC in the composite.
SEM images of SiC, PVDF and PVDFC5.

Polarizing Optical images of PVDF and PVDFC5.
Variation in contact angle with increasing SiC weight percentage.

D. Mechanical property
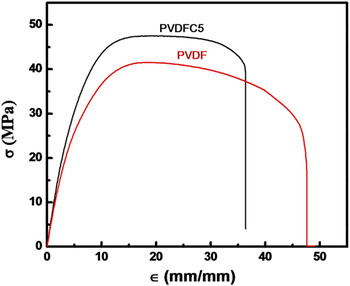
The tests for mechanical properties under uniaxial elongation have been performed using universal testing machine. Figure 7 shows the stress-strain curves of pristine PVDF and a representative PVDFC5 composite. The Young’s modulus, as calculated from the slope of the linear region, of composite (PVDFC5) increases to 838 MPa from 745 MPa of that of pure PVDF while the toughness, as measured from the area under the stress-strain curve of the composite decreases to 1504 J/m3 from 1654 J/m3 of that of pure PVDF. It is obvious that the stiffness increases in composite while the toughness decreases a bit in presence of SiC particle, which is a typical case of filled system.Reference Priya and Jog19 On the other hand, the tensile strength increases but the elongation at break decreases in composite as compared with pure PVDF.
Stress-strain curves for pure PVDF and PVDFC5 composite.

E. Electric and dielectric properties
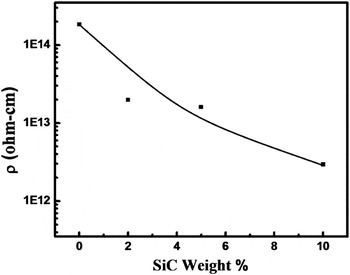
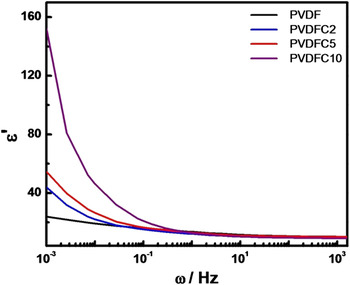
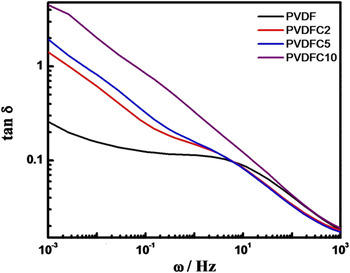
PVDF is an insulator and pure SiC usually acts as a semiconductor. The result of the resistivity measurement showed systematic decrease from 1014 Ω-cm of pure PVDF to 1012 Ω-cm in PVDFC10 in presence of 10 wt% SiC (Fig. 8). The decrement in resistivity in composite is gradual and two orders lower in magnitude than that of pure PVDF observed at room temperature. Figure 9 shows the typical dielectric permittivity (ε′) of PVDF and its composites with varying frequency for different SiC concentration at room temperature. The dielectric constant increases with increase in SiC content. Maximum increment is observed in lower frequency range and the values are 22, 42, 57 and 150 for pure PVDF, PVDFC2, PVDFC5 and PVDFC10, respectively, at 10−3 Hz frequency. Thus, the frequency dependence dielectric study indicates that the dielectric constant increases with the addition of SiC in polymer matrix especially in the low frequency region. The tan δ curves at room temperature show one relaxation peak at 7 Hz for pure PVDF attributed to the relaxation of molecules associated in the crystalline region (Fig. 10). The peak position has been shifted to 3 Hz (toward lower frequency side) for PVDFC2 and interestingly, the peak has been further shifted to much lower frequency to 0.3 Hz for PVDFC10 presumably due to change in conformation with internal rotation that occur in crystalline β phase in presence of SiC filler that commensurate in XRD and FTIR studies.Reference Miyamoto, Miyaji and Asai28 There is a tendency for a probable peak at ∼107 Hz but that is beyond the capacity of our instrument and the peak is related to the cooperative motion of the main chain, so called glass transition temperature.Reference Bello, Laredo and Grimau29 BaTiO3 and other high dielectric constant materials increase the overall dielectric constant when they are dispersed in polymer matrix but the crystalline relaxation peak does not shift as there is no change of crystalline structure in presence of filler.Reference Chanmal and Jog30 In this case, SiC nucleates β-phase in PVDF, thereby, the relaxation pattern in the crystalline phase changes significantly causing reduction of relaxation frequency with increasing SiC concentration. SiC is a good semiconductor and high dielectric constant can be explained using percolation theory in PVDFC5. In PVDF, there are three relaxations in permittivity loss curve at different frequency regions.Reference Bello, Laredo and Grimau29, Reference Chanmal and Jog30 The αc relaxation associated with molecular motions in crystalline region of PVDF at about 0.3–7 Hz and has been discussed here in Fig. 10. The second relaxation αa comes around at 107 Hz related to the glass transition relaxation. The third relaxation attributed to Maxwell-Wagner-Sillars (MWS) polarization comes due to interfacial polarization at very low frequency (<10−4 Hz) in pure PVDF.
Effect of increasing SiC concentration on resistivity of PVDF- SiC composites.

Dielectric real part (ε′) as a function of frequency (ω) for the prepared composite films with different SiC concentration.

Dielectric loss as a function of frequency for the prepared composite films with different SiC concentration.

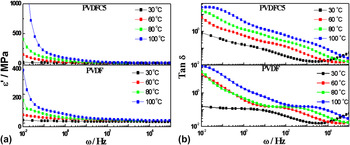
The temperature-dependent dielectric properties have been analyzed for both pure PVDF and PVDFC5 to compare dielectric constant and relaxations due to permittivity loss of pure PVDF in nonpolar phase and PVDFC5 composite with β-polar phase. The dielectric permittivity of the PVDF and PVDFC5 at different temperatures are given in Fig. 11(a). Dielectric permittivity has increased with increasing temperature both for pure PVDF and PVDFC5. PVDF have dielectric constants of 13, 28, 37 and 61 at temperature 30, 60, 80 and 100 °C, respectively, at 1 Hz frequency. PVDFC5 have dielectric permittivity of 14, 28, 52 and 62 at same temperatures mentioned above showing bit higher values for composite. Figure 11(b) exhibits tan δ curves of PVDF and PVDFC5 measured at different temperatures. It shows the shifting of crystalline relaxation peak position to higher frequency range with increase in temperature both for PVDF and PVDFC5. The temperature-dependent dielectric relaxation and its interactions in presence of semiconducting SiC is explained by Havriliak-Negami (H-N) functionReference Chanmal and Jog30, Reference Mijovic, Lee, Kenny and Mays31:

Dielectric loss as a function of frequency for the pure PVDF and PVDFC5 at various temperatures.

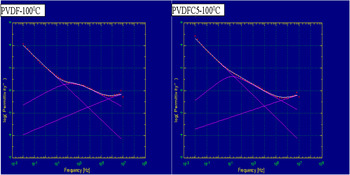
where, σdc is direct current conductivity, ω is the angular frequency, s is an exponent (0 < s ≤ 1), τj is the relaxation time of the jth process, ε0 is the vacuum permittivity, ∆ε is the dielectric strength of the jth process and α and β are the shape parameters of the H-N function that define the breadth and the symmetry of the spectrum. Width parameter α specifies the slope of the low frequency side of the relaxation behavior of ε″ curve and β is the asymmetry parameter and it is calculated using the slope of the relaxation behavior at the high frequency side of the same pattern as—αβ. The analyses through H-N function using WinFit software program of PVDF and PVDFC5 have been given in Table II using deconvoluted H-N fits (Fig. 12). In PVDF, β parameter has the value of 1 for the temperature range measured showing symmetry of spectrum, but PVDFC5 has different values (∼0.54–0.70) due to presence of mutliphase after interaction with SiC particles. Relaxation time (τ) calculated from H-N fit using WinFit software decreases with increase in temperature both for PVDF and PVDFC5, whereas the relaxation time for PVDFC5 shows lower value as compared with pure PVDF. However, we demonstrate the nucleation of piezoelectric β-phase in PVDF in presence of SiC filler. Subsequent improvement in mechanical, thermal, hydrophilicity, electric and dielectric properties have been revealed in association with the induced β-phase by the filler. The relaxation phenomenon in presence of filler has been explained.
Dielectric loss in the frequency domain and spectrum was deconvoluted from H-N fits.

Fitting parameters for αc relaxation as a function of temperature obtained from H-N fits.

IV. CONCLUSION
The composite of PVDF has been synthesized in presence of varying SiC content through solution route. The piezoelectric β-phase has been nucleated in presence of SiC particle. The existence of β-phase has been confirmed by using XRD, FTIR and DSC studies. The hydrophilicity of the composites increases with SiC content as the contact angle decreases with increasing SiC content in the composites. The tensile modulus improves in composite as compared with pristine PVDF while there is slight reduction in toughness. Change in structural conformation has been reported in composite (β-phase) in presence of SiC filler as evident from the shift of peak position to lower frequency in composite vis-à-vis pure PVDF. The relaxation behavior occurs at higher frequency with increasing temperature and the fitting of the curves provide the insight of the shape parameters of the relaxation phenomena indicating interaction between matrix PVDF and SiC particle causing nucleation of piezoelectric phase.