I. INTRODUCTION
Intense research efforts are devoted to the development of photovoltaic technologies. Organic photovoltaics (OPVs) offer a powerful alternative to the conventional technology relying on inorganic materials. To commercialize OPVs, three objectives must be achieved: a satisfying power conversion efficiency (PCE), a proven, cost-effective manufacturing setup, and a sufficiently long module lifetime under operating conditions. While the PCE threshold of 10% has been exceeded, the stability of devices is not yet ensured.Reference Green, Emery, Hishikawa, Warta and Dunlop1–Reference Cheng and Zhan3 The decay of photovoltaic performance under operating conditions is usually due to the combined action of sequential and interrelated mechanisms taking place at different locations in the device and with different kinetics. Light, temperature, atmospheric oxygen, and moisture are the main triggers for organic photovoltaic solar cell (OSC) degradation.Reference Grossiord, Kroon, Andriessen and Blom4 For all these reasons, the identification of the main sources of degradation is challenging, and unraveling these degradation pathways remains essential.
Despite notable counterexamples, organic materials are unstable under the combined action of light, temperature, and oxygen.Reference Rivaton, Tournebize, Gaume, Bussière, Gardette and Therias5 Even with the recent emergence of nonfullerene acceptors, the active layers of bulk heterojunction organic solar cells are mostly based on a blend of a donor semiconductors (polymers or small molecules) and fullerene derivatives, commonly PCBM (phenyl-C61-butyric acid methyl ester), as acceptors. Atmospheric oxygen can be trapped in the device during fabrication or can diffuse from the atmosphere through the flexible packaging. Under prolonged exposure, the ability of the plastic barrier encapsulation to protect devices from the atmosphere is often reduced.Reference Gardette, Colin, Trivis, German and Therias6 The active layer will be de facto in contact with the combined action of light and oxygen, at least at low concentrations. Hence, it is crucial to investigate the effect of low-level active layer oxidation on the performance of solar cells. Furthermore, it seems essential to focus on the oxidation of PCBM due to the ubiquity of fullerene derivatives in bulk heterojunctions. Additionally, the geometry of the fullerene cage renders it very sensitive to oxidation.Reference Silva, Cresson, Rivaton, Bégué and Hiorns7 Photovoltaic performance in OSCs based on fullerene derivatives have been proven to be affected by atmospheric oxygen through quenching or photooxidation of the fullerene singlet state when exposed to UV-visible light.Reference Bastos, Voroshazi, Fron, Brammertz, Vangerven, van der Auweraer, Poortmans and Cheyns8,Reference Matsuo, Ozu, Obata, Fukuda, Tanaka and Nakamura9
The photooxidation of an active layer is well known to decrease its UV-visible absorbanceReference Rivaton, Manceau, Chambon, Gardette, Guillerez and Lemaître10 and to provoke the oxidation of both of its components.Reference Tournebize, Bussière, Rivaton, Gardette, Medlej, Hiorns, Dagron-Lartigau, Krebs and Norrman11 Thanks to its simplicity, UV-visible spectroscopy is commonly used to infirm or confirm the involvement of the active layer degradation in aged devices.Reference Manceau, Rivaton, Gardette and Krebs12 However, this technique does not reveal the formation of defects within the active layer that could affect the elementary steps subsequent to light absorption (i.e., polaron diffusion, charge formation, and charge extraction) which fundamentally govern the performances of devices regardless of the other layer’s integrity. Transient absorption spectroscopy (TAS) revealed that, at a degradation level that was sufficiently low to cause a loss of only 0.5% in the UV-visible absorbance (from 1 to 4 h of light exposure in ambient air), the charge carrier recombination and extraction rates are considerably slowed in photooxidized P3HT:PCBM active layers.Reference Karuthedath, Sauermann, Egelhaaf, Wannemacher, Brabec and Lüer13 As powerful as TAS is to trace the global effect of photooxidation on the charge carrier dynamics, TAS does not provide information about the involvement of the active layer components nor the underlying mechanisms. Additionally, Seeman et al. submitted devices to short exposures (60 min) of AM1.5 sunlight in the presence of oxygen.Reference Seemann, Sauermann, Lungenschmied, Armbruster, Bauer, Egelhaaf and Hauch14 The irreversible degradation of the cells was assigned to photochemical oxidation reactions within the active layer leading to the formation of electron traps. However, the formation of oxidation products was not formally identified.
It appears necessary both to specifically study the effect of the degradation of each of the two active layer constituents and to implement a sensitive analytical technique to do so. Electron paramagnetic resonance (EPR) and light-induced EPR (L-EPR) spectroscopies are among the most appropriate and sensitive techniques to identify the formation of defects and the nature of the moieties involved in electron transfer by the direct observation of radical cations and anions (the so-called positive and negative polarons).Reference Susarova, Piven, Akkuratov, Frolova, Polinskaya, Ponomarenko, Babenko and Troshin15–Reference Tournebize, Rivaton, Gardette, Lombard, Pépin-Donat, Beaupré and Leclerc17 Focusing specifically on the degradation products of fullerene derivatives remains a challenge since they have not been extensively detected in polymer:fullerene blends with EPR methods.Reference Niklas and Poluektov18,Reference Salvador, Gasparini, Perea, Paleti, Distler, Inasaridze, Troshin, Lüer, Egelhaaf and Brabec19
In the present study, blends of P3HT and PCBM were used as an active layer since they are a model system commonly used in OPV.Reference Dang, Hirsch and Wantz20 A bottom-up approach was implemented that studied from the oxidation of PCBM to the electrical performances of devices based on pristine P3HT and oxidized PCBM. We first developed a method for submitting PCBM to controlled oxidation. PCBM thin films were exposed to artificial sunlight at ambient air for 0, 2, 10, 20, and 60 min on a glass substrate. Two minutes is approximately the shortest irradiation duration that can be performed in the aging device while minimizing artifacts related to the lightening of the source; 60 min corresponds to the shortest irradiation duration of the active layers or devices used by Karuthedath et al. and Seeman et al., respectively; thus, it was already known that this duration was sufficient to provoke a significant drop in photovoltaic performances.Reference Karuthedath, Sauermann, Egelhaaf, Wannemacher, Brabec and Lüer13,Reference Seemann, Sauermann, Lungenschmied, Armbruster, Bauer, Egelhaaf and Hauch14 The photooxidized PCBM, hereafter “PCBMox (X min)” (X is the irradiation duration from 0 to 60 min), was then collected, characterized by high-performance liquid chromatography (HPLC), UV-Visible, and IR spectroscopy, and finally incorporated into blends. Electron transfer at the molecular scale within the active layers was observed by L-EPR. Density functional theory (DFT) calculations were performed to determine the theoretical Landé g-factor of the photooxidized PCBM species.Reference Neese21–Reference Sandhoefer and Neese24 The g-factor corresponds to the signal position of the free radical species observed by EPR spectroscopy and is sensitive to the chemical structure on which the unpaired electron is trapped (more details in the Supplementary Material). Computing of the EPR spectra was performed to characterize the EPR signatures of the acceptor moieties. Finally, solar cells based on pristine P3HT and PCBMox active layers were fabricated. Their electrical performances were measured and compared to the reference system based on pristine materials.
II. RESULTS & DISCUSSION
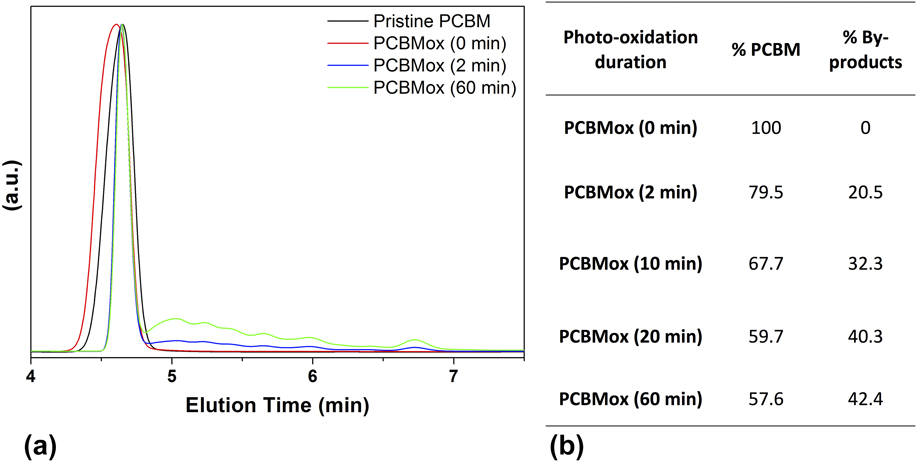
The impacts of the deposition/collection process and of a couple of minutes of exposure to light under ambient conditions on the chemical structure of PCBM were determined by HPLC. Figure 1 shows the normalized HPLC data of PCBM before and after exposure to light. The HPLC of the pristine material shows the main signal of PCBM at an elution time of 4.6 min. Photooxidized PCBM chromatograms comprise the signal of the “parent” PCBM accompanied with several additional peaks at higher retention times, indicating the formation of different photooxidation products.
Normalized HPLC chromatograms of PCBM before and after 0, 2, and 60 min of illumination in ambient atmosphere (detection at 320 nm) (a), and peak integrations of PCBM before and after 0, 2, 10, 20, and 60 min of illumination in ambient atmosphere (retention time at 4.6 min) compared to degradation products from retention times between 4.7 and 7.5 min (b).

The signals of pristine PCBM and its photoproducts were integrated and the data are reported in Fig. 1. The processing of PCBM (thin film deposition under ambient conditions, PCBM powder recollection) has no influence on its purity since the chromatograms reported for pristine PCBM and PCBMox (0 min) are the same. Blends made with PCBMox (0 min) are then taken as the reference hereafter. Figure 1 also shows that the concentration of photoproducts increases with the irradiation duration compared with the parent PCBM signal. Notably, the ratio of modified to pristine fullerene was reduced from almost 80% to less than 60% as the irradiation time increased from 2 to 60 min.
To more accurately characterize the modifications of PCBM resulting from the exposure to light in ambient atmosphere, spectroscopic analyses were performed. The UV-visible absorption spectrum of deposited PCBM shows the same subtle changes as those observed when PCBM was irradiated in nitrogen atmosphere, consisting of an increase in the absorbance at 320 nm (Fig. S1 in the Supplementary Material).Reference Distler, Sauermann, Egelhaaf, Rodman, Waller, Cheon, Lee and Guldi25 In the nitrogen case, this change was ascribed to PCBM dimerization,Reference Dzwilewski, Wågberg and Edman26,Reference Heumueller, Mateker, Distler, Fritze, Cheacharoen, Nguyen, Biele, Salvador, von Delius, Egelhaaf, McGehee and Brabec27 a photochemical process which is quenched by oxygen and therefore cannot occur under our irradiation conditions.Reference Zhou, Dong, Rao and Eklund28 PCBM films were also analyzed by IR spectroscopy to confirm that under our irradiation conditions, the features observed in the UV-visible spectra were related to photooxidation. Exposure to light (between 0 and 60 min) under ambient air leads to the progressive formation of oxidation products as revealed by infrared spectroscopy in the carbonyl region approximately 1680–1800 cm−1 (Fig. S2). This evolution is in good accordance with the new IR bands formed when C60 is submitted to photooxidation.Reference Eklund, Rao, Zhou, Wang and Holden29,Reference Chambon, Rivaton, Gardette and Firon30 In a study by Eklund et al., C60 photooxidation was also shown to result in the formation of C60On (n = 1–4) with atomic oxygen chemically attached to the fullerene shell. These results are consistent with the observations of O’Reese et al., who used MALDI-TOF to identify the formation of (PCBM)On isomers (with n = 0, 1, 2, 4, and 8) upon photooxidation of PCBM.Reference Reese, Nardes, Rupert, Larsen, Olson, Lloyd, Shaheen, Ginley, Rumbles and Kopidakis31 Our experimental results clearly show evidence of the high oxidizability of PCBM under exposure to light, confirming previous conclusions.Reference Taylor, Barrow and Drewello32,Reference Paul, Bolskar, Clark and Reed33 Despite this main conclusion, it remains unclear why the irradiation of PCBM deposits increases the absorbance at 320 nm in the UV-Vis spectra, and complementary data are needed to determine whether it is related to PCBM oxidation or possible dimerization (however, this issue is beyond the scope of this study).
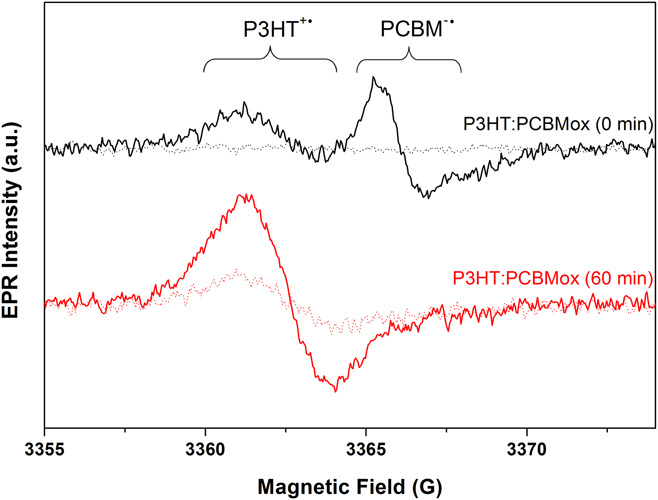
Active layers were then prepared with the different PCBMox samples and pristine P3HT. EPR and L-EPR spectra were recorded at 20 K first in the dark and then under in situ illumination at 473 nm. Figure 2 shows the evolution of P3HT:PCBMox (0 min) and P3HT:PCBMox (60 min) (spectra related to PCBMox (2, 10, and 20 min) are reported in the Supplementary Material in Fig. S3). The EPR spectra recorded in the dark show that the photooxidation of PCBM progressively leads to the formation of stable paramagnetic defects, although they have lower intensity signals than do those observed in the subsequent L-EPR experiments. L-EPR spectra obtained for P3HT:PCBM bulk heterojunctions generally exhibit two overlapping lines. The line located at low magnetic field (higher g-factor) can be attributed to the positively charged polaron P3HT+˙, which occupies approximately five monomer units and diffuses along polymer chains with an isotropic effective g iso-value of 2.0023. At a higher magnetic field (lower g-factor), the anion radical PCBM−˙ is generally observed with an effective g iso-value of 2.0001.Reference De Ceuster, Goovaerts, Bouwen, Hummelen and Dyakonov34–Reference Konkin, Ritter, Scharff, Mamin, Aganov, Orlinskii, Krinichnyi, Egbe, Ecke and Romanus38 In the spectrum of the P3HT blended with PCBMox (0 min) shown in Fig. 2, the classical polaron line, located at a lower magnetic field, and the PCBM−˙ anion radical, at a higher magnetic field (with its characteristic dissymmetry due to anisotropy), is observed. Moving from PCBM to PCBMox results in dramatic changes, as shown in Fig. 2 (and Fig. S3). The PCBM−˙ characteristic line progressively disappears with increased irradiation time, and the signal located at a lower magnetic field remains as the sole peak after 60 min of PCBM photooxidation. This observation suggests that a photooxidized PCBM structure catches the electrons coming from P3HT at the expense of PCBM and that its g-factor and linewidth are quite similar to that of the P3HT polaron. Relaxation of the EPR signals after shutting off the in situ illumination was also measured (not shown here). In each case, the EPR signal decreased over a few minutes until it reached the signal that was first recorded in the dark.
EPR spectra recorded first in the dark (dotted line) and L-EPR spectra recorded subsequently under in situ illumination at 473 nm (continuous line), at 9 GHz and 20 K, of P3HT blended with PCBMox (0 and 60 min).

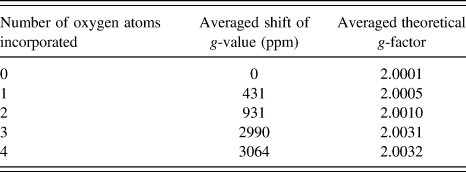
Since no EPR data concerning the oxidation products of PCBM are available in the literature,Reference Niklas and Poluektov18 DFT calculations were performed to determine the theoretical g-factors of oxidized PCBM isomers resulting from the attachment of oxygen atoms to different positions on the fullerene shell. Calculations which are extremely heavy (∼100,000 computing hours) were limited to the incorporation of 1–4 oxygen atoms and are presented in Table I. The theoretical g-values of these oxidized PCBM polarons were calculated on the basis of our experimental PCBM g-factor (g = 2.0001) and the theoretical shift provoked by the incorporation of oxygen atoms onto the fullerene cage. For each number of oxygen atoms incorporated, the g-factor values reported in Table I correspond to the average of the oxidized PCBM isomers’ g-factors. These isomers were chosen to have extra oxygen atom(s) on various possible positions on the fullerene cage. Furthermore, this choice was constrained to molecules in which no carbon atoms are bound to two or more oxygen atoms at the same time.
Averaged shifts and averaged absolute g-factors induced by the incorporation of oxygen atoms onto the fullerene cage of PCBM, as obtained from DFT calculations. These values were obtained by averaging the results of different isomers containing the same number of oxygen atoms incorporated into the fullerene shell.

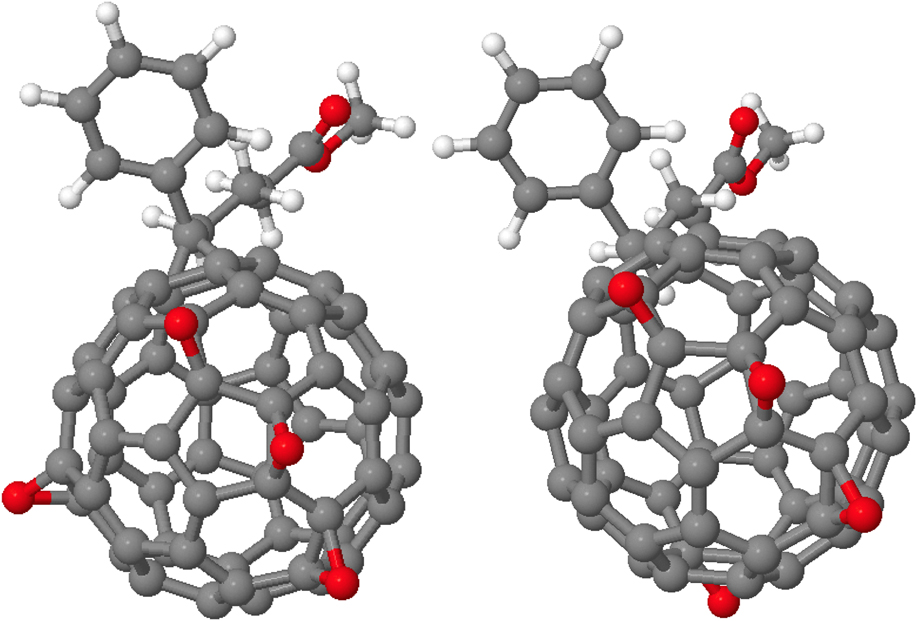
A full description of the DFT modeling is reported in the Supplementary Material. An example of the differences between two isomers (of the four considered for four-oxygen systems) is presented in Fig. 3.
Four oxygen atoms (red) attached to the PCBM shell. Here, we show two of the four isomers considered for this number of oxygen atoms. The reader should notice that each carbon atom is only linked to one oxygen at a time.

Data reported in Table I clearly show that the spins of the photooxidized PCBM species have a g-value significantly higher than that of pristine PCBM; the higher the number of incorporated oxygen atoms is, the higher the g-value becomes. This result agrees with our observation that a new EPR signal appears with longer PCBM photooxidation times that has a higher g-value than the one observed with pristine PCBM.
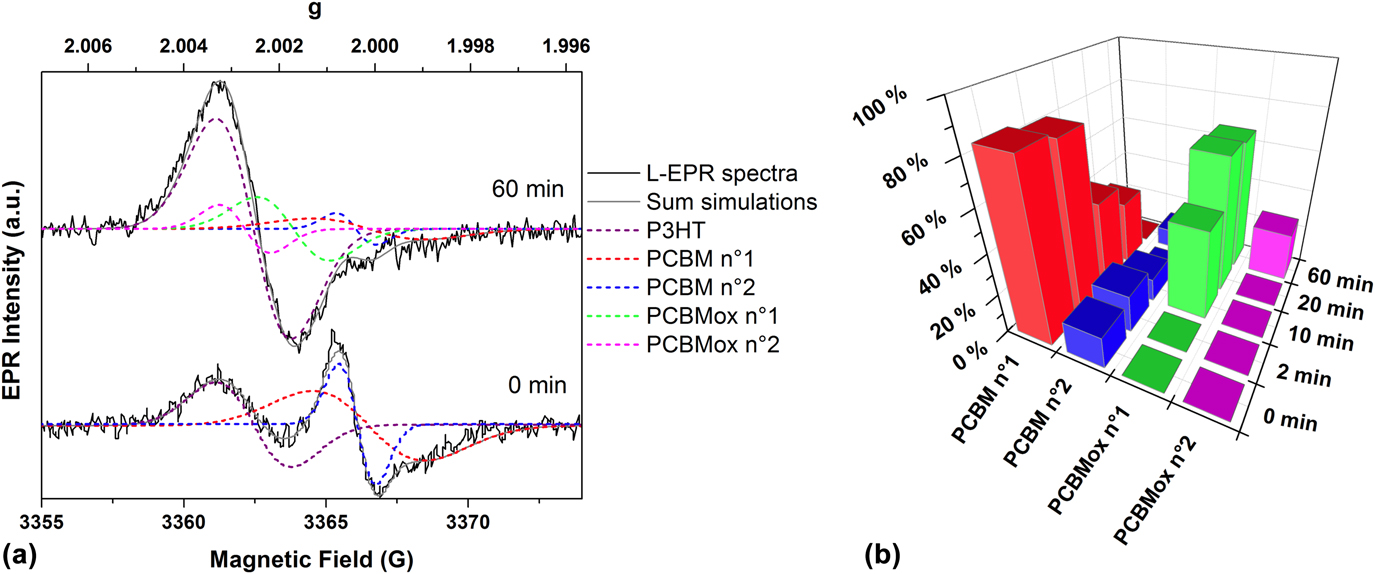
Multi-peak fitting was then performed to identify/extract the signals of the different acceptor species participating in the electron transfer, as shown in Fig. 4(a). We stress that the multi-peak fittings of all experimental EPR spectra were performed and then, EPR data obtained from these fittings were compared to the data obtained from theoretical calculations performed independently to try determining PCBM oxidation species present in the blend. Whatever the aging duration is, multi-peak fitting reveals two signals in the g-region characteristic of PCBM−˙ with the g-factors of 2.00011 (linewidth = 3.95 G) and 2.00038 (linewidth = 1.3 G). The first signal (called PCBM no. 1) matches the multi-peak fitting of the PCBM signal performed by De Ceuster et al.Reference Eklund, Rao, Zhou, Wang and Holden29; the second one (called PCBM no. 2) might be assigned to the “spike” that is occasionally reported in the signal of C60.Reference Reed and Bolskar39,Reference Rapta, Bartl, Gomorov, Stasko and Dunsch40 For P3HT:PCBMox (0 min), these two signals co-exist with another one located at a lower magnetic field that is ascribed to P3HT (g = 2.0025, linewidth = 2.65 G). After 10 min of PCBM photooxidation, fittings reveal the presence of a new signal (g = 2.0017, linewidth = 2.53 G) located in the same region as P3HT and arbitrarily ascribed to a structure related to photooxidized PCBM and called PCBMox no. 1. Although we cannot fully exclude the presence of the P3HT-O2 CT complex (the EPR signal of P3HT-O2 CT complex is only slightly different to the one of PCBMox no. 1 according to Ref. Reference Sperlich, Kraus, Deibel, Blok, Schmidt and Dyakonov41), its contribution should be very low since illumination occurs under inert atmosphere in the present experiments. Importantly, as only PCBM was irradiated, it could be assumed that the contribution of the P3HT-O2 CT complex is almost the same for all the studied blends, and that the modifications in the EPR spectra are only related to the changes in PCBM oxidation rates. Focusing on the results reported in Fig. 4(b), PCBMox no. 1 is not observed in P3HT:PCBMox (0 min) and in P3HT:PCBMox (2 min). Thus, the contribution of the P3HT-O2 CT complex signal, if it exists, is particularly low compared to PCBMox species signals. Consequently, the assignment of the signal to a structure related to photooxidized PCBM (called PCBMox no. 1) is thus supported. For aging durations higher than 20 min, another signal appears (g = 2.0027, linewidth = 1.83 G) that was arbitrarily ascribed to a structure called PCBMox no. 2. The relative amount of each PCBM-related species thus calculated is plotted in Fig. 4(b).
L-EPR spectra recorded at 9 GHz and 20 K of P3HT:PCBMox (0 and 60 min) (continuous black lines), fitted lines (dashed lines), and the fitted signal that is the sum of all the fitted lines (continuous gray line) (a). Relative intensity of the different radical PCBM species extracted from simulations (b).

The following can then be noted: (i) After two minutes of photooxidation, the ratio between the PCBM species (PCBM nos. 1 and 2) changes slightly; (ii) when the blend is made with PCBMox (10 min), the signals of the PCBM species (PCBM nos. 1 and 2) are halved, and the signature of PCBMox no. 1 appears; (iii) using PCBMox (20 min), the signal of PCBMox no. 1 increased, whereas that for pristine PCBM continues to decrease; (iv) finally, after 60 min of PCBM photooxidation, the main change is the appearance of a new species, PCBMox no. 2. Importantly, the electron transfer from P3HT to the initial PCBM signals (nos. 1 and 2) is dramatically reduced to 20% of the pristine sample. Thus, comparing data of DFT modeling and of EPR multi-peak fitting lead us to suggest that PCBMox no. 1 (g = 2.0017) fits with the incorporation of two O atoms onto the fullerene cage and that PCBMox no. 2 (g = 2.0027) to the incorporation of three O atoms.
The main conclusion obtained from these L-EPR measurements is that the photooxidation of PCBM results in the formation of new acceptor PCBM structures which are able to trap a large portion of the electrons coming from P3HT at the expense of pristine PCBM.
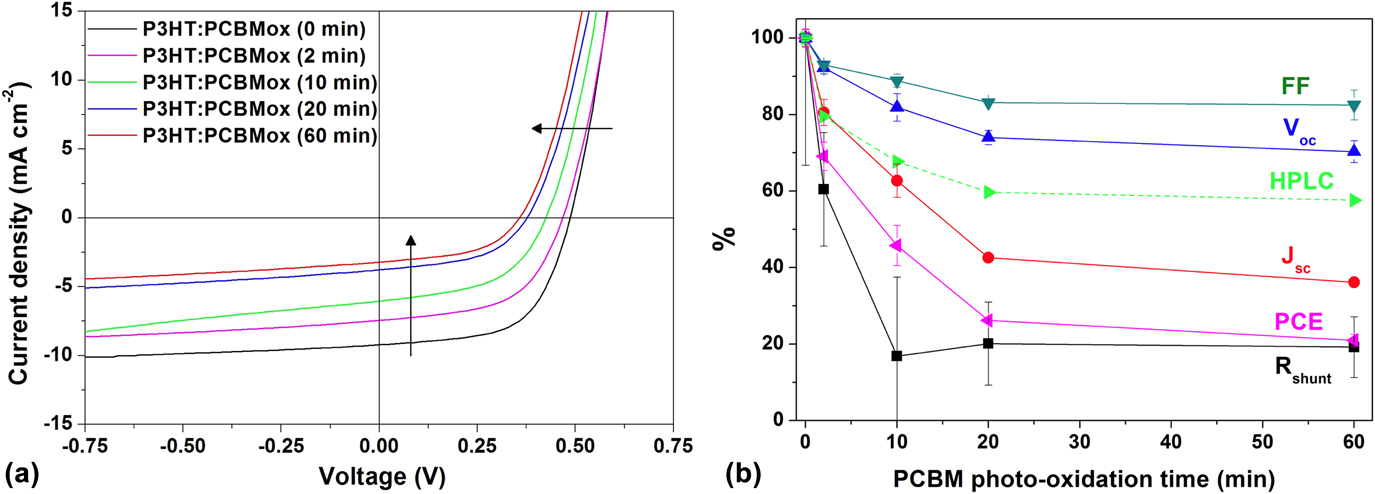
To complete this study, it is necessary both to correlate the oxidation of PCBM with the photovoltaic properties of P3HT:PCBMox-based solar cells and to characterize any relationship that might exist between the electron transfer and the electrical performances of the solar cells. To do so, PCBMox samples were used in inverted P3HT:PCBMox solar cells. While devices containing nonirradiated PCBM show an efficiency of 2.6%, the performances of PCBMox-based devices are significantly decreased as shown in Fig. 5. Interestingly, the extent of PCBM oxidation determined by HPLC, also reported in Fig. 5, reveals the same trend.
(a) J–V curves of solar cells based on P3HT blended with PCBMox samples; (b) normalized electrical parameters of solar cells based on PCBMox depending on the photooxidation duration of PCBM from 0 to 60 min (full line). The pristine PCBM concentration was extracted from the HPLC characterization (Table I) (dashed line).

The performance degradation of the cells containing PCBMox mainly consists of losses in the short-circuit current (J sc) and the shunt resistance (R shunt). For instance, after 60 min of photooxidation, the PCE undergoes a rapid decrease and reaches only 21% of that of the pristine cell. This drop is mainly due to a loss of J sc, which reaches just 36.2% of that of the pristine cell but also to a decrease in the V oc and fill-factor (FF) to a lesser extent (respectively, 70% and 83% of those of the pristine cell). Finally, the series resistance (R s) value remains quite stable (see Table S1 in the Supplementary Material), whereas the R shunt follows an overall significant loss down to 19% of that of the pristine cell. Interestingly, it was not previously known that the oxidation of PCBM only and not the full device could play such a significant role on the device performance. When aging full organic solar cells, the community commonly observes electrode degradation, bulk heterojunction morphology changes, or interface-related issues such as delamination or diffusion of atoms from interlayers. However, it is demonstrated here that PCBM oxidation, even at a low level, has an enormous effect on the electrical parameters of solar cells. Atomic force microscopy (AFM) analysis reveals no major change (Fig. S4 in the Supplementary Material), thus suggesting that morphological changes are excluded as the major cause of device degradation, at least at the surface where AFM is probing. In conclusion, these experimental results reveal the importance of PCBM oxidation in altering electron transport and limiting the efficiency of organic solar cells.
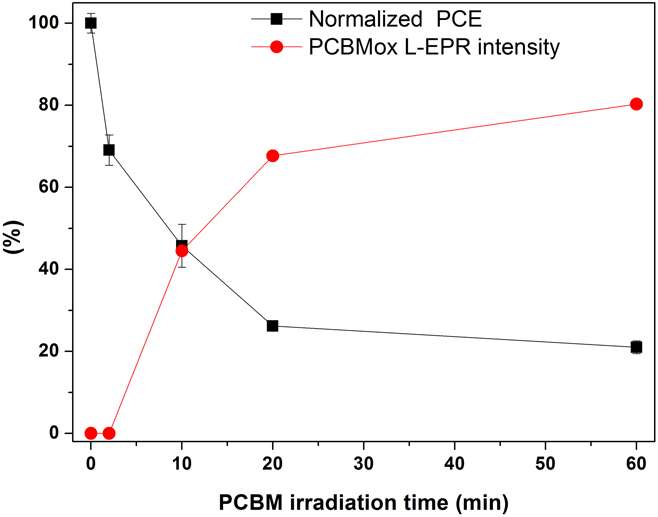
Finally, a crucial piece in the identification of the cause of this device degradation is the correlation between the electrical characteristics of the devices and the charge transfer at the nanoscale within the active layer. We plotted in Fig. 6 the efficiency of the solar cells (PCE) and the sum of the two signals corresponding to the electron transfer to oxidized PCBM shown in Fig. 4 (sum of PCBMOx no. 1 + PCBMox no. 2 radical anions involved in electron transfer) as a function of the photooxidation duration of PCBM (from 0 to 60 min). The electrical parameters and the electron transfer of the PCBMox acceptor species follow the same trend: a rapid evolution during the first minutes of PCBM exposure until reaching a plateau or a much slower evolution. The efficiency reaches a plateau of ∼20% which can be explained by the fact that at least one of the initial PCBM species (PCBM no. 2) still participates in electron transfer after 60 min of exposure, as observed in Fig. 4. It is possible to conclude unambiguously that the dramatic decrease in the device performance before the plateau is related to the presence of PCBMox species within the active layer acting as traps. The correlation observed between the two evolutions reported in Fig. 6 thus confirms that PCBMox species have a deeper LUMO,Reference Dzwilewski, Wågberg and Edman26 implying a lower V oc. Additionally, they may act in the blend as electron traps favoring exciton recombination and slowing down the overall charge transport, thus inducing the significant drop in J sc observed in Fig. 5. More interesting is a decrease in the shunt resistance, which is usually related to increased leakage current in the structure. This observation indicates that PCBMox species may create shunting conductive pathways through the layer. After 2 min of photooxidation, the solar cells are already substantially affected by the presence of PCBMox species, as shown in Fig. 6. The L-EPR measurements revealed no significant appearance of PCBMox species, whereas HPLC clearly showed that almost 20% of the PCBM was modified by the 2 min of photooxidation. More importantly, longer irradiation durations showed a clear correlation between the extent of PCBMox formation (identified by L-EPR) and the observed PCE loss. This study shows how sensitive organic solar cells are to the initial state of photooxidation of fullerene derivatives.
Evolution of the solar cell PCE (black) based on blends of P3HT with photooxidized PCBM (from 0 to 60 min) and the sum of the PCBMox species acting as acceptors [PCBMox no. 1 + PCBMox no. 2 extracted from Fig. 4(b)] (red) with the irradiation time of PCBM.

To open up new perspectives, we did record the L-EPR spectra of full devices. To record their L-EPR signals, cells were broken into small pieces and introduced into EPR tubes. The similarity of data obtained from blends and from solar cells (Fig. S5 in the Supplementary Material) prompts us to suggest that EPR could be used to study the degradation of the active layer in aged devices. Furthermore, we previously showed that combining EPR data with DFT calculations is an efficient technique for identifying the degradation pathways of a conjugated polymer in terms of its photochemical stability.Reference Santos Silva, Fraga Domínguez, Perthué, Topham, Bussière, Hiorns, Lombard, Rivaton, Bégué and Pépin-Donat42
III. CONCLUSION
We show that PCBM is rapidly oxidized when it is irradiated for a few minutes in ambient air. The presence of PCBMox species, even after very short exposures, in the active layer drastically degrades a solar cell’s performance. Thanks to the bottom-up approach implemented in this study, we have established a link between the rapid oxidation of PCBM at the molecular scale, the modification of the electron transfer at the nanoscale and the substantial drop in the performances of solar cells, thus revealing that the presence of oxidized PCBM in the active layer of organic solar cells seriously degrades devices performance. Given the dramatic effect of PCBM oxidation on the performance of solar cells, the use of ultra-barrier encapsulation appears to be a prerequisite toward fabricating long-term stable PCBM-based solar cells. More generally, considering that industrial fabrication is performed in open air, that the ultra-barrier encapsulation of devices is particularly challenging, and that PCBM is so rapidly oxidized due to the geometry of the fullerene cage, developing robust nonfullerene acceptors for organic solar cells appears to be the most promising strategy to meet future stability goals.
IV. EXPERIMENTAL
A. Materials
P3HT was purchased from Sigma-Aldrich (St. Louis, Missouri). PCBM was kindly provided by our collaborators. The ITO-coated PET used for EPR measurements was obtained from Sigma-Aldrich (St. Louis, Missouri), and the ITO-coated glass used for devices was obtained from VisionTek (East Dundee, Illinois). Chlorobenzene (CB), ortho-dichlorobenzene (ODCB), chloroform, absolute ethanol, diiodooctane, and zinc acetate dihydrate were purchased from Sigma-Aldrich (St. Louis, Missouri). MoO3 and Ag were purchased from Neyco (Vanves, France).
B. Sample preparation
PCBM films were prepared from chloroform solutions on a large-surface area glass plate via doctor blade casting. The deposit was then exposed for some time to artificial sunlight in a Suntest apparatus. The layers were then collected back with a few millilitres of chloroform to concentrate the PCBM, and a very sharp blade was used to remove it from the glass substrate.
The collected material was redissolved to make blends and to fabricate devices.
1. Blend preparation for EPR measurements
The PET/ITO was used as received. The blends were prepared the day before spin coating by mixing the oxidized material with the corresponding fresh material to obtain a blend of P3HT:PC61BM at a concentration of 20:20 mg/mL in ODCB. The blends were first stirred at 85 °C for 15 min, and then kept overnight at 50 °C to fully dissolve the materials. The blends were spun coated at 1000 rpm for 40 s. The sample was then immediately transferred to a glass Petri-dish where it can slowly dry to obtain a better morphology.Reference Chambon, Derue, Lahaye, Pavageau, Hirsch and Wantz43
2. Photooxidation experiments
Photooxidative experiments were performed on a Suntest CPS/XLS Atlas device (Atlas Material Testing Technology, Mount Prospect, Illinois) designed to simulate the AM 1.5 spectrum, especially in the UV domain. UV light below 300 nm and IR light were cut off thanks to the so-called daylight filter from Atlas (Atlas Material Testing Technology, Mount Prospect, Illinois). The black standard temperature was set at 60 °C which corresponds to a chamber temperature of around 35 °C. Irradiation provided by a xenon lamp from Atlas (NXE1700; Atlas Material Testing Technology, Mount Prospect, Illinois) was set at 750 W/m2 in the UV-visible domain.
3. Device processing
ITO-coated glass was washed through ultrasonic treatment with soap/deionized water solution, in pure deionized water and in isopropanol (15 min each) and subjected to UV-ozone for 10 min to complete the cleaning procedure. The electron transfer layer consists of a 40-nm-thick ZnO sol–gel layer: zinc acetate dihydrate, dissolved with monoethanolamine (both at 0.15 mol/L) in absolute ethanol, was spun coated at 2000 rpm for 60 s on the ITO substrate and annealed at 180 °C for 1 h. The samples were then transferred into a water- and oxygen-free environment (glove-box). The blends were prepared following the same procedure as described above. After the blend deposition, the substrates were transferred to a thermal evaporator, where the top electrode, 7 nm of MoO3 and 70 nm of Ag, was deposited at 3 × 10⁻⁶ mbar. The final device area was 10 mm2, as defined by a shadow mask.
C. HPLC
The samples of PCBM were analyzed by high pressure liquid chromatography (HPLC) using a SHIMADZU LC-20AD apparatus (Shimadzu, Kyoto, Japan) equipped with a Buckyprep 4.6 mm ID × 250 mm column (Nacalai USA, Inc., San Diego, California). A solution of 0.35 mg of solid in 1 mL o-dichlorobenzene (HPLC grade) was prepared for each sample.
The oven containing the column was heated to 40 °C at 42 mbar using toluene (HPLC grade) as the unique solvent, with a flow of 1 mL/min and detection at 320 nm.
D. UV-visible spectroscopy
UV-visible spectra were obtained with a UV2600 spectrophotometer equipped with an integrating sphere from Shimadzu (Kyoto, Japan).
E. Infrared spectroscopy
Infrared transmission spectra were obtained using a Thermo Scientific Nicolet 6700 spectrophotometer (Thermo Fisher Scientific, Waltham, Massachusetts) purged with dry air at a resolution of 4 cm−1 by summing 32 scans.
F. Density functional theory calculations
The geometries of the ground states of the pristine and oxidized PCBM molecules were determined with the B3LYP/def2-TZVP level of theory,Reference Becke44–Reference Vosko, Wilk and Nusair46 using the RIJCOSX approximation and D3BJ van der Waals corrections.Reference Grimme, Ehrlich and Goerigk47 The auxiliary basis set needed when using this approximation was automatically generated by the code and has a triple-zeta or higher quality. For charged systems (systems to which a single electron has been added), the geometry of the molecule was re-optimized, meaning that we worked within an adiabatic framework. No diffuse basis functions were used because (i) they make computing the convergence of the energy much harder (or even impossible) for fullerene systems and (ii) it has been shown that highly conjugated systems seldom need such basis because the additional negative charge can be delocalized all over the system. Once the geometries were determined, they were used as input calculations to determine the system’s paramagnetic properties, namely, the g factor. To do so, we used the same exchange-correlation functional but with an IGLO-III basis set, freezing all of the core electrons and considering only the valence electrons in the coupled-perturbation equations. All calculations were performed in Orca 3.0.3 software using tight convergence criteria on both energies and gradients.
G. L-EPR
1. Acquisition
EPR spectra were obtained using an X-band (3 cm, 9.7 GHz) ER 200D SRC spectrometer from Bruker (Karlsruhe, Germany) with 100 kHz field ac modulation for phase-lock detection. The sample was located in a Bruker ER 41040R optical transmission resonator (Bruker Corp., Karlsruhe, Germany) with an unloaded quality factor Q of 7000. The in situ illumination was provided by using a Oxxius 473L-20-COL-PP-LAS-01186 laser module (Oxxius, Lannion, France) with a CW output power of 22.1 mW at 473.3 nm. An ESR 900 cryostat (Oxford Instruments, Abingdon, United Kingdom) was used for the low-temperature experiments. Accurate g values (±0.0002) were obtained by measuring the magnetic field intensities and frequencies separately. Significant power saturation and modulation broadening were avoided by choosing the operating conditions. The recording conditions were kept the same to compare different EPR spectra (accumulation number, gain, accumulation times, modulation, and microwave power); the magnetic field used to compare various spectra (Href) corresponds to an arbitrary frequency of 9.426060 GHz.
2. EPR spectra multi-peak fitting
Software was developed to simulate the spectra obtained during L-EPR experiments (derivative of the absorption signal). The full method is described in detail in the Supplementary Material of Ref. Reference Pépin-Donat, Ottone, Lombard, Lefrançois, Morell, Reiss and Sadki16.
H. Solar cells
1. Photovoltaic performances
Current density versus voltage [J(V)] curves were measured for each device using a Keithley 4200 analyser (Keithley Instruments, Solon, Ohio) under an AM1.5 solar simulator with an xenon lamp calibrated with a radiometer (IM1400) at 100 mW/cm2. The PCE, FF, short-circuit density current (J sc), and open circuit voltage (V oc) were extracted from these curves. For each condition, 2 substrates, each with four cells with 10 mm2 of surface area, were fabricated. Because a few devices malfunctioned, the average and standard deviations were calculated with between 6 and 8 values. The external quantum efficiency was performed on a homemade setup consisting of a xenon lamp connected to a Horiba monochromator. Because this measurement is performed outside the glove-box, the devices were first encapsulated using a glass slide adhered with a UV-curable glue (NOA61 glue, Epotecny, Levallois-Perret, France).
2. AFM measurements
AFM was used to image the surface of the active layer with a Bruker Innova AFM large area scanner (Bruker Corp., Karlsruhe, Germany) in the tapping mode. We used a silicon cantilever purchased from Asylum Research (Santa Barbara, California) with a cantilever length of 160 µm and a tip radius of 9 nm (AC160TS). The RMS roughness of the obtained images was calculated using Gwyddion software (http://gwyddion.net/).
Supplementary Material
To view supplementary material for this article, please visit https://doi.org/10.1557/jmr.2018.141.
ACKNOWLEDGMENT
This work was supported by the Agence Nationale de la Recherche (ANR) through the PROGELEC 2013 program “HELIOS” (ANR-13-PRGE-0006).