INTRODUCTION
The scaling laws of the maximum proton energy with laser power density delivered by ps- and fs-laser (Tan et al., Reference Tan, McCall and Williams1984; Clark et al., Reference Clark, Krushelnick, Zepf, Beg, Tatarakis, Machacek, Santala, Watts, Norreys and Dangor2000; Krushelnick et al., Reference Krushelnick, Najmudin and Dangor2007) predict a maximum energy of the protons produced with the sub-nanosecond 3-TW laser system PALS to be about 1 MeV. Nevertheless, the use of an ion collector shielded with 8-μm Al foil, in order to absorb the extreme ultraviolet pulse inducing the “photopeak” in the IC signal (Margarone et al., Reference Margarone, Krása, Giuffrida, Picciotto, Torrisi, Nowak, Musumeci, Velyhan, Prokůpek, Láska, Mocek, Ullschmied and Rus2011), brought clear-cut evidence that the fastest protons have energy up to about 4 MeV (Picciotto et al., Reference Picciotto, Margarone, Bellutti, Colpo, Torrisi, Krasa, Velyhan and Ullschmied2011). This value well correlates with the Omega EP proton scaling as a function of intensity for 10 ps laser pulses (Flippo et al., Reference Flippo, Bartal, Beg, Chawla, Cobble, Gaillard, Hey, MacKinnon, MacPhee, Nilson, Offermann, Le Pape and Schmitt2010). The shift of the Omega EP proton energy to higher values indicates that the deposited energy is 2–100 times higher than that achieved at most of all other lasers in the world with a given intensity (Flippo et al., Reference Flippo, Bartal, Beg, Chawla, Cobble, Gaillard, Hey, MacKinnon, MacPhee, Nilson, Offermann, Le Pape and Schmitt2010). Despite of a large spread in the values of energy, it is evident that the maximum proton energy observed in the PALS experiment corresponds to the value of the similarity parameter Iλ2 = 2 × 10¹⁸ Wcm−2μm2 created by ps-lasers. Under similar experimental conditions, production of Taq+ and Auq+ ions with a maximum charge state q ~ 50 was observed when irradiating massive targets with the intensity of about 3 × 10¹⁶ W/cm2 (Láska et al., Reference Láska, Jungwirth, Krása, Krouský, Pfeifer, Rohlena, Ullschmied, Badziak, Parys, WoLowski, Gammino, Torrisi and Boody2006; Reference Láska, Cavallaro, Jungwirth, Krása, Krouský, Margarone, Mezzasalma, Pfeifer, Rohlena, Ryć, Skála, Torrisi, Ullschmied, Velyhan and Verona-Rinati2009; Torrisi et al., Reference Torrisi, Margarone, Laska, Krasa, Velyhan, Pfeifer, Ullschmied and Ryc2008). Such high values of the charge state were ascribed to the enhanced value of target irradiance due to the assumed self-focusing, resulting in the estimated intensity increase up to 1 × 10¹⁹ W/cm2, when considering only the power-density effect (Láska et al., Reference Láska, Jungwirth, Krása, Krouský, Pfeifer, Rohlena, Ullschmied, Badziak, Parys, WoLowski, Gammino, Torrisi and Boody2006). Thus, not only the maximum velocity of protons, but also the maximum charge state of heavy elements does not scale with the intensity as presumed by a number of scaling ps-laser experiments.
The distinctive interaction between a 300-ps pulse produced by the 3-TW PALS laser system with a solid target allows generating not only fast protons and highly charged ions but also high energetic deuterons accelerated directly from the front surface of a massive CD2 foil, which are capable of initiating mutual fusion reactions. In this work, we report appearance of the bursts in emission of fast ions from deuterated polyethylene and graphite plasmas and the resulting peaked structure of the ion energy distribution. The goal of our experiments was also to determine some characteristics of fusion neutrons emitted by the CD2 plasma produced with the PALS laser system.
EXPERIMENTAL ARRANGEMENT
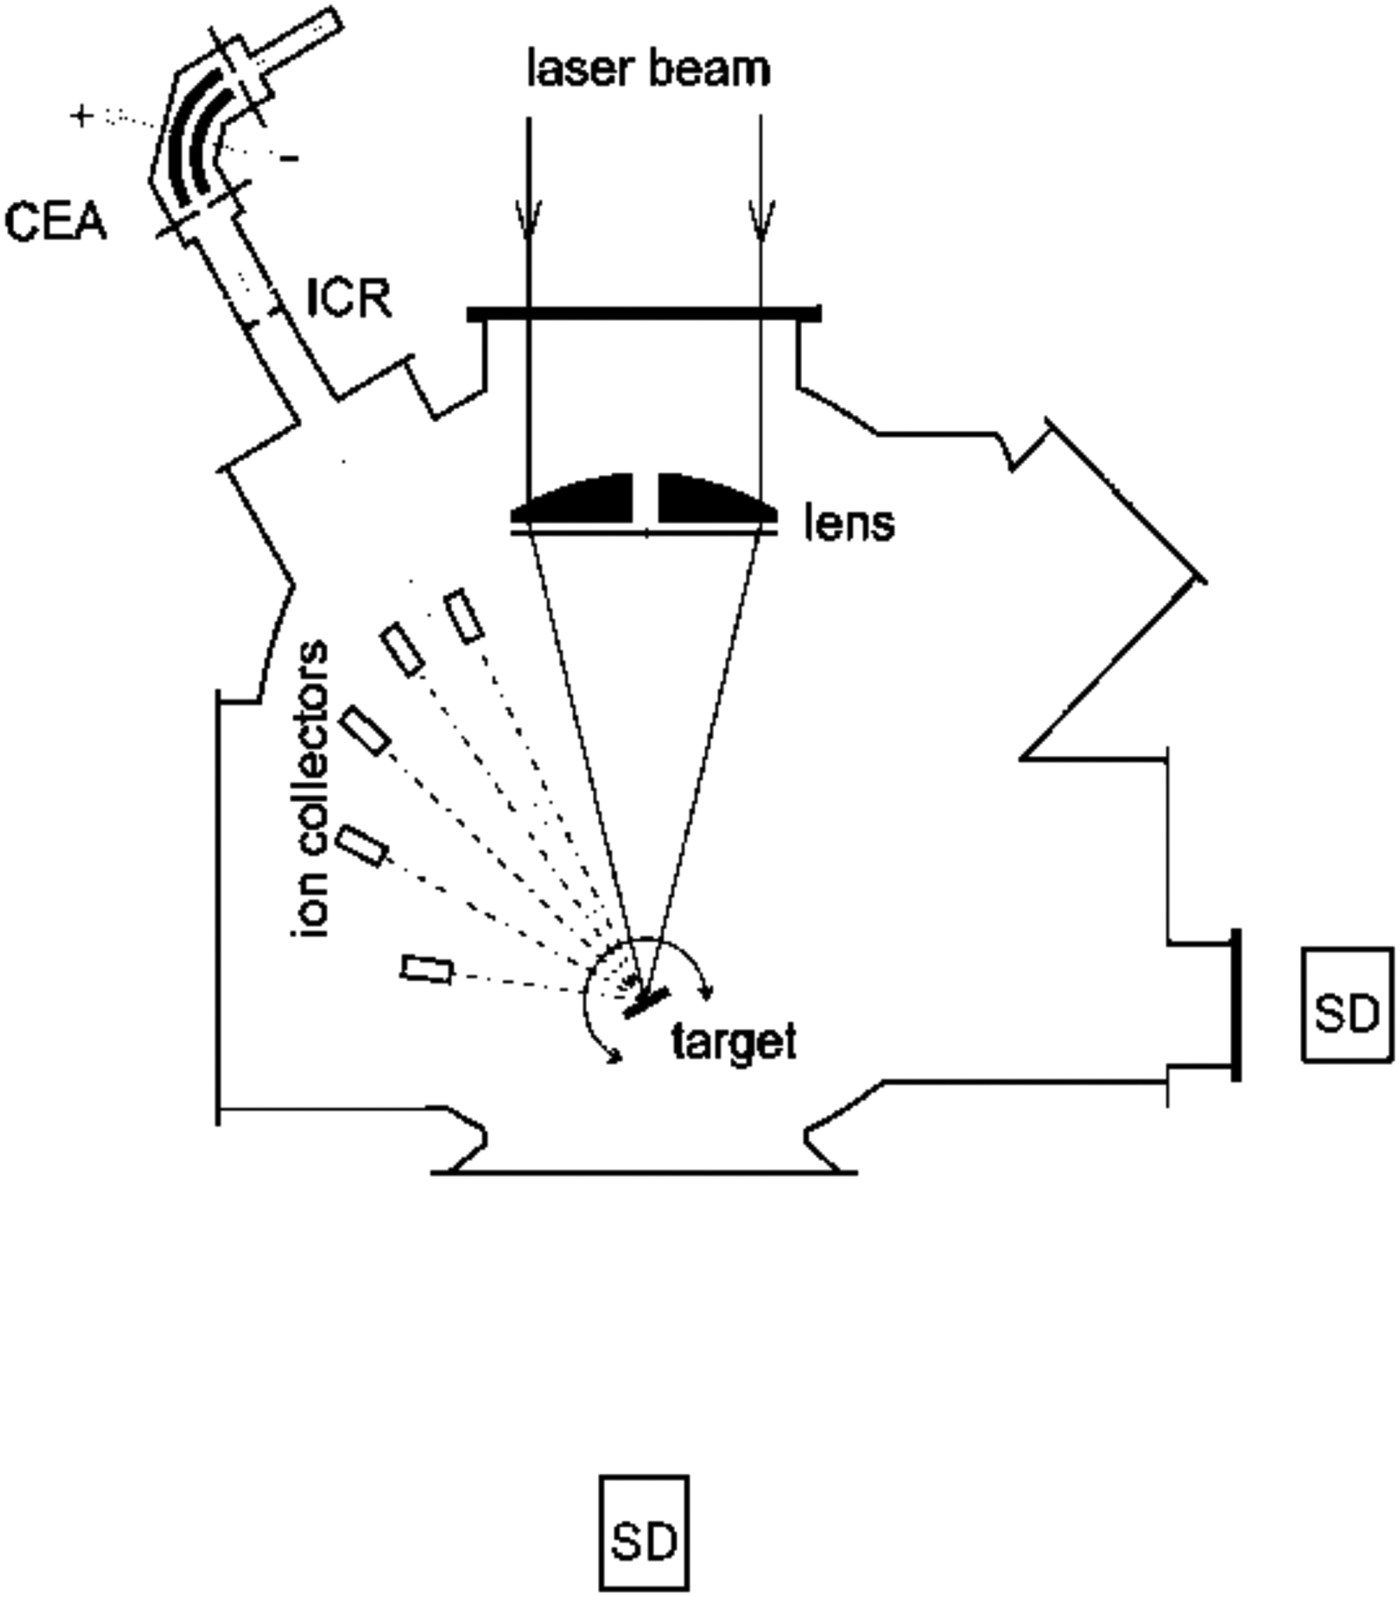
The reported measurements were performed with the PALS laser system delivering onto a target a focused beam of intensity of about 3 × 10¹⁶ W/cm2 in 300-ps pulses with the fundamental wavelength of 1.315 µm (Jungwirth et al., Reference Jungwirth, Cejnarová, Juha, Králiková, Krása, Krouský, Krupičková, Láska, Mašek, Mocek, Pfeifer, Präg, Renner, Rohlena, Rus, Skála, Straka and Ullschmied2001). In this experiment, the laser beam struck a massive deuterated polyethylene target parallel to the target normal. Characteristics of ions were measured with the use of an ion ring collector (ICR) coaxial with a cylindrical electrostatic ion energy analyser (CEA), and a Thomson parabola spectrometer (TPS) positioned in the far expansion zone, i.e., outside the recombination zone. The emission of neutrons was observed by the use of calibrated temperature-compensated bubble dosimeters (BD-PND) with sensitivity of about 4 b/μSv (Bubble Technology Industries, Chalk River, Ontario, Canada), and 4 calibrated neutron time-of-flight (N-TOF) scintillation detectors composed of a fast plastic scintillator of BC408 type and of a photomultiplier tube (Klir et al., Reference Klir, Kravarik, Kubes, Rezac, Litseva, Tomaszewski, Karpinski, Paduch and Scholz2011), which were positioned at distances of 2 m to 6 m in the forward (on-axis) and radial directions, as sketched in Figure 1. To reduce the scintillator response to the gamma-rays from the electrons hitting the chamber wall and diagnostics located inside the chamber, the scintillation detectors were mounted inside a protective housing composed of 10-cm thick interlocking lead bricks. The scintillation detectors were operated in a current mode.
Scheme of the experimental arrangement. CEA – cylindrical ion energy analyzer or Thomson parabola spectrometer (TPS), ICR–ion ring collector, SD – scintillation detector.

EXPERIMENTAL RESULTS AND DISCUSSION
Ion Time-of-Flight Spectra
Figure 2 shows time-resolved ICR signals being characteristic for the generation of fast ions with the use of the 3 TW kJ-class laser system PALS. The emission of fast protons, deuterons and carbon ions exhibits significant shot-to-shot fluctuations. The pulsing currents fluctuate in both the amplitude and time-of-flights (velocity) of partial peaks. These fluctuations are caused by non-linear interaction of the laser pulse with the created plasma resulting in occurrence of ion bursts (Krása et al., Reference Krása, Velyhan, Jungwirth, Krouský, Láska, Rohlena, Pfeifer and Ullschmied2009).
(Color online) Shot-to-shot fluctuations in the emission of ions from a deuterated polyethylene target, which was exposed to laser intensities of about 3 × 10¹⁶ W/cm2. The distance of the ICR from the target was 1.51 m and the angle of observation was 30° to the target surface normal (i.e., laser beam axis).
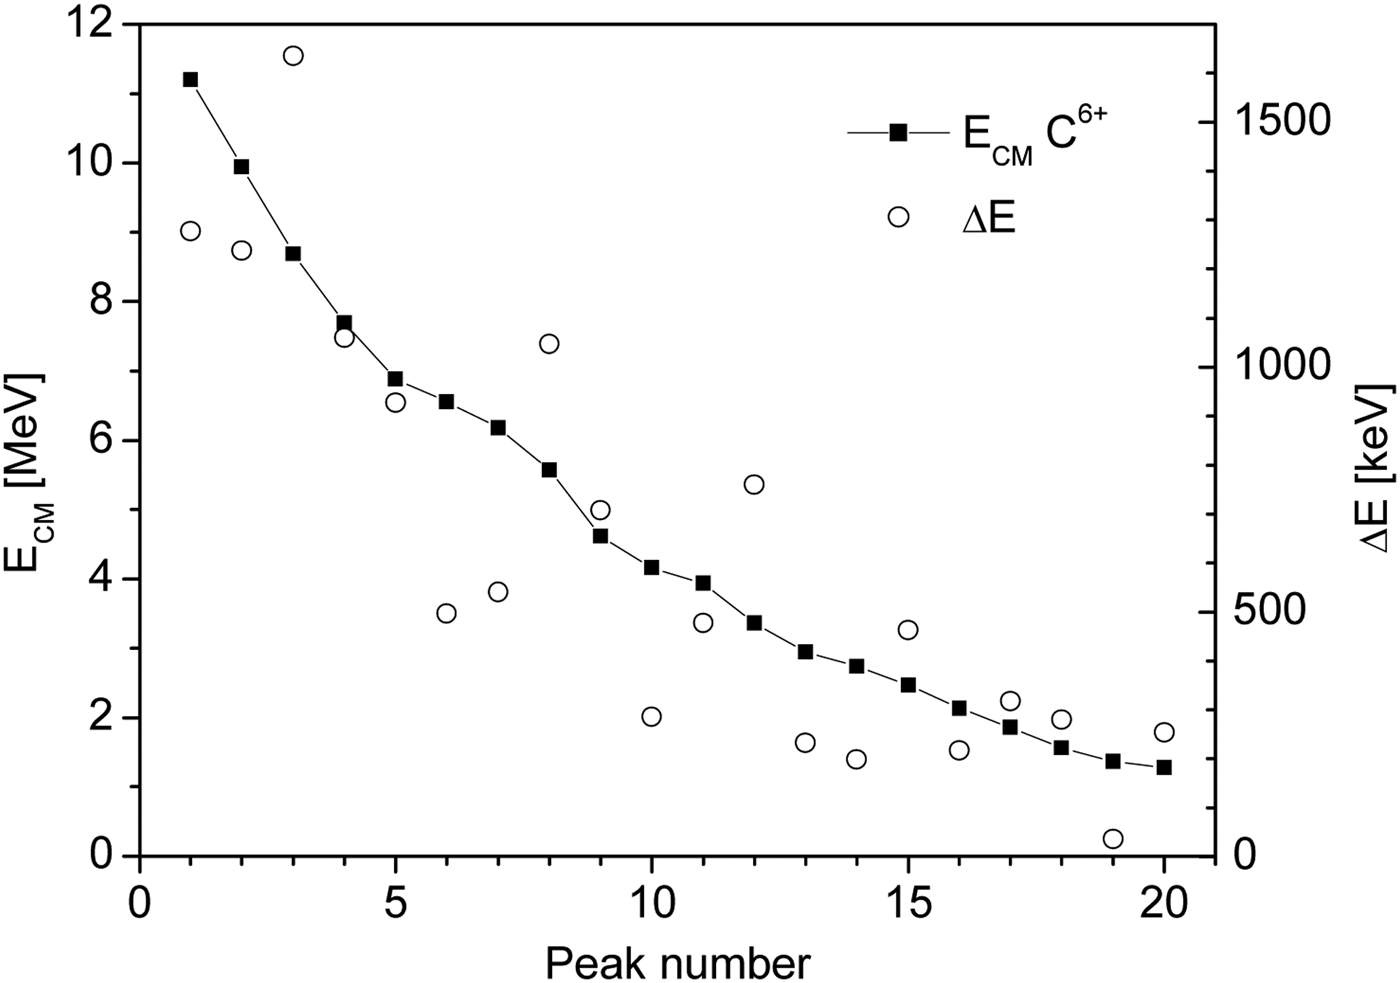
The peaked structure of TOF spectra should be reproduced in the structure of energy spectra of all ionized species constituting the ion current. In this case, a graphite target was irradiated under the same conditions as CD2 to create deuteron-free plasma because D+ and C6+ ions constitute a common parabola due to their equal charge-to-mass ratios. The energy distribution of C6+ ions ranges from 1 MeV to 11 MeV, which corresponds to the TOF range from about 110 ns to about 380 ns at 1.5-m distance from the target (see Fig. 2). The broadband energy spectrum of C6+ ions with the FWHM of about 6 MeV shows a number of local maxima, which can be regarded as a result of the burst instability (Luther-Davies & Rode, Reference Luther-Davies and Rode1993; Krása et al., Reference Krása, Velyhan, Jungwirth, Krouský, Láska, Rohlena, Pfeifer and Ullschmied2009). Every burst of the carbon plasma is composed of H+ and C6+ ions, which were accelerated as a group of ions by the same voltage U n at the time of the laser-plasma interaction. In the following stage of the plasma expansion, the partial recombination of C6+ ions creates new Cq+ ions with q ≤ 5 being a part of the burst. The energy spectrum observed far from the target remains to be a sum of partial energy spectra Σ S n, where the subscript n is the burst number. The TPS allows us to pick up just spectrum of C6+ ions, as shown in Figure 3. Since the energy spectrum of fast ions is nearly Gaussian (Krása, Reference Krása2013), the partial energy spectra can be obtained by deconvolution of the total spectrum using the Gaussian function, as Figure 3 shows. The best-fit values of center-of-mass energy, E CM-n, and energy spread, ΔE n, are plotted in Figure 4. Although this analysis does not claim to accuracy in the determination of the total number of bursts, it is evident that the center-of-mass energies decrease gradually with the increasing sequence number of the burst, which is expressed in terms of the n-th burst starting at the shortest flight time (i.e., the highest energy) of a burst, as it was described in Krása et al. (Reference Krása, Velyhan, Jungwirth, Krouský, Láska, Rohlena, Pfeifer and Ullschmied2009). The energy spread also exhibits a decrease with the increasing burst number. It should be noted that these above presented values reflect not only the laser-plasma interaction itself and eventually the parameters of deuterons at the time of fusion burn, but also the process of plasma expansion.
(Color online) Energy spectrum of C6+ ions emitted by graphite plasma generated with an intensity of 3 ×1 016 W cm−2 (solid line labelled “Observed” was derived from a TPS). Peaks P1 to P20 represent partial energy spectra of ion bursts, which were retrieved by deconvolution of the observed spectrum.
Center-of-mass energy E CM and energy spread ΔE of partial energy spectra of C6+ ions versus the peak number shown in Figure 3.
The dependences shown in Figure 4 give an average value of ratio < ΔE n / E PEAK-n > = 0.12. Since the energy spectra of C6+ ions are very similar for both graphite and CD2 plasmas produced by the same intensity, and because the parabola traced by deuterons on a TPS detection plane interferes with the parabola of co-moving C6+ ions, we can deduce the values of ΔE D from those energy spreads ΔE 6+ rescaling the energy spectrum of C6+ ions to the mass of D+. The corresponding range of ΔE D-n is 6 to 270 keV and the maximum centre-of-mass energy of deuterons, E D-MAX, reaches a value of about 2 MeV. Thus, all the deuterons contained in plasma bursts have sufficient energy to produce fusion neutrons.
Neutron Yield and Time-of-Flight Spectra
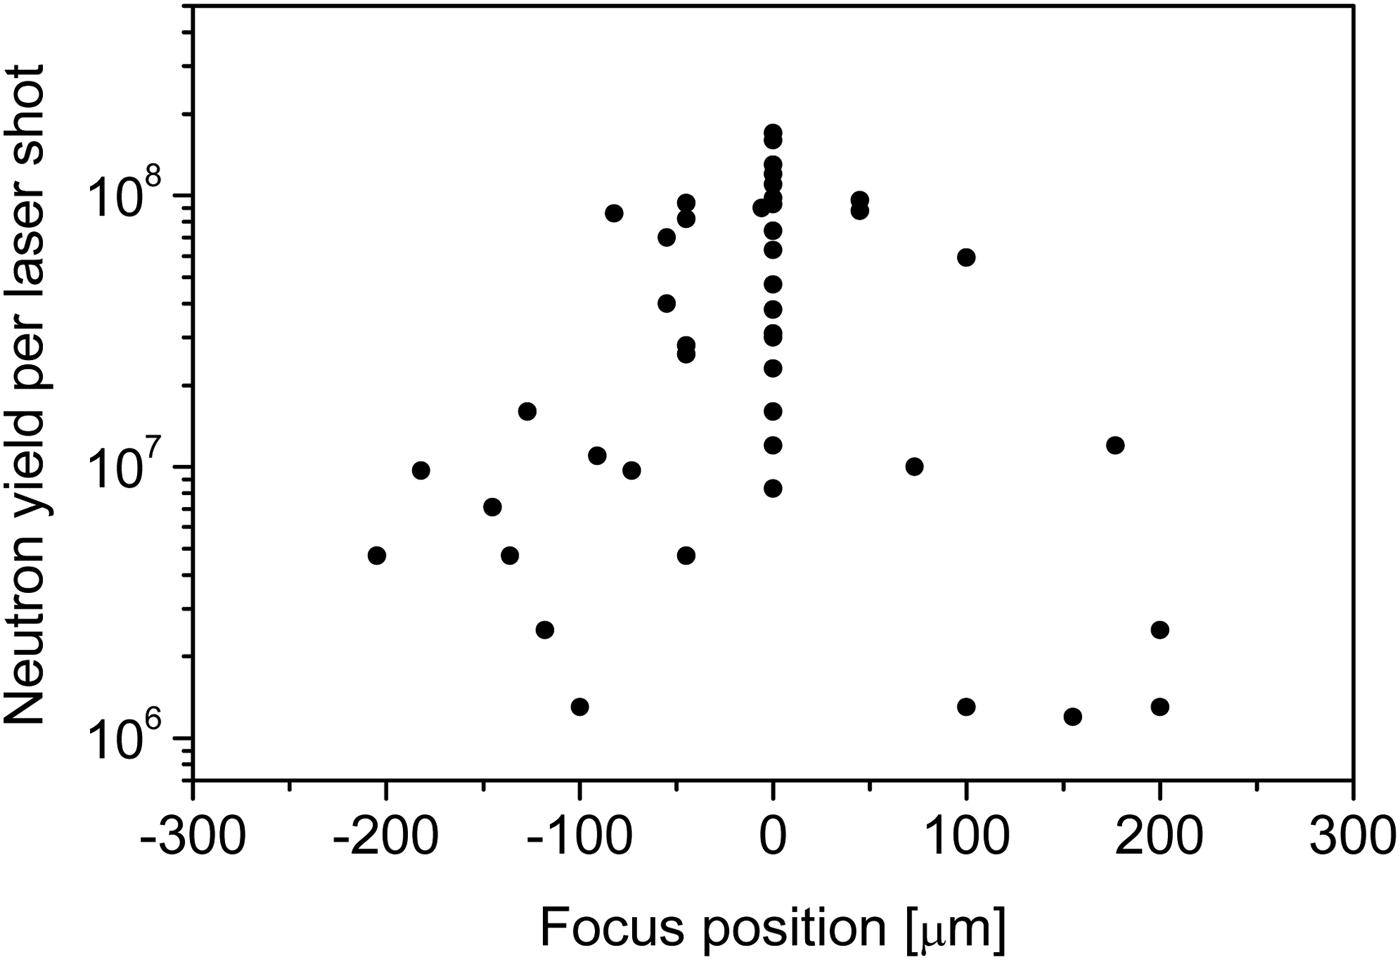
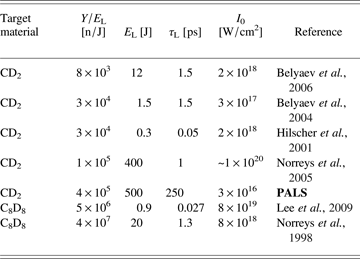
The focus position dependence of the neutron yield per shot, Y, produced mainly by fusion reaction D + D → He3 (0.82 MeV) + n (2.45 MeV) is shown for values Y > 1 × 10⁶ in Figure 5. It is evident that beside the instabilities influencing the energy transfer from the laser beam to fusing ions via generated fast electrons, the sharp focusing of the laser radiation on the target may become one of the decisive factors affecting the neutron yield. As for the focus position, FP, the convention used is: FP < 0 means that the focus is located in front of the target surface, and FP > 0 means that it falls inside the target. Correspondingly, the spot diameter increases from 80 µm (FP = 0) to 200 µm (FP = ±200 µm). The maximum value of the neutron yield per laser energy deposited onto a target surface was observed to be 3.5 × 10⁵ neutrons/J for the average laser energy of 550 J. This value falls between the higher efficiency values observed at the laser solid interactions driven by high laser intensities ranging from 1 × 10¹⁸ to 5 × 10¹⁹ W cm−2, as Table 1 reports. It is evident that the similarity parameter Iλ2 does fully scale neither the observed neutron yield efficiency (Madison et al., Reference Madison, Patel, Allen, Price, Fitzpatrick and Ditmire2004; Davis & Petrov, Reference Davis and Petrov2008), nor the computed yield per shot of an ultra-intense fs-laser (Youssef, Reference Youssef2013).
Focus position dependence of the neutron yield per laser shot. The laser intensity at FP = 0 was 3 × 10¹⁶ W cm−2.
Neutron yield per energy from thick deuterated plastic targets irradiated by different laser systems. E L – laser energy, τ L – laser pulse length, I 0 – target irradiance
Another parameter needed for proper scaling could be the laser pulse rise time, as it was demonstrated in Madison et al. (Reference Madison, Patel, Allen, Price, Fitzpatrick and Ditmire2004) for the fusion neutron yield of deuterium cluster targets. It was shown that this yield depends on the ratio of the cluster ionization time to its intrinsic expansion time, which is just sensitive to the laser pulse rise time. Nonetheless, the rise time is correlated to the laser pulse length which determines the irradiance of a solid target. Therefore, the yield should be affected by the laser energy deposited during the rise time period. One can deduce that the other key parameter is the laser energy. Figure 6 shows a spread in the neutron yield dependence on the energy delivered on deuterated targets with the use of various fs-, ps-, and sub-ns lasers. The spread can be limited by a baseline which was estimated to be Y BL = 2000 × E 1.65. It is obvious that all the experiments cannot give the neutron yield approaching the maximum value for a given energy due to the relative importance of other laser and target parameters that should be considered although their importance is not evident from the physical phenomenon alone. The spread in the energy dependence of the neutron yield is much higher than the spread in the intensity dependence of the maximum proton energy (Krushelnick et al., Reference Krushelnick, Najmudin and Dangor2007) because the neutron yield depends not only on the ion acceleration but also on the effectively absorbed energy needed to produce a high number of fusing ions.
(Color online) Neutron yield per laser shot versus laser energy. Data from: P98 – Pretzler et al., Reference Pretzler, Saemann, Pukhov, Rudolph, Schätz, Schramm, Thirolf, Habs, Eidmann, Tsakiris, Meyer-ter-Vehn and Witte1998; H01 – Hilscher et al., Reference Hilscher, Berndt, Enke, Jahnke, Nickles, Ruhl and Sandner2001; TA5 – Ter Avetysian et al. Reference Ter-Avetisyan, Schnürer, Hilscher, Jahnke, Busch, Nickles and Sandner2005; M04 – Madison et al., Reference Madison, Patel, Allen, Price, Fitzpatrick and Ditmire2004; Y05 – Youssef et al., Reference Youssef, Kodama, Habara, Tanaka, Sentoku, Tampo and Toyama2005; Iz02 – Izumi et al., Reference Izumi, Sentoku, Habara, Takahashi, Ohtani, Sonomoto, Kodama, Norimatsu, Fujita, Kitagawa, Mima, Tanaka and Yamanaka2002; B06 – Belyaev et al., Reference Belyaev, Vinogradov, Matafonov, Krainov, Lisitsa, Andrianov and Ignatyev2006; F02 – Fritzler et al., Reference Fritzler, Najmudin, Malka, Krushelnick, Marle, Walton, Wei, Clarke and Dangor2002; N05 - Norreys et al., Reference Norreys, Lancaster, Habara, Davies, Mendonca, Clarke, Dromey, Gopal, Karsch, Kodama, Krushelnick, Moustaizis, Stoeckl, Tatarakis, Tampo, Vakakis, Wei and Zepf2005; N98 – Norreys et al., Reference Norreys, Fews, Beg, Bell, Dangor, Lee, Nelson, Schmidt, Tatarakis and Cable1998; H04 – Habara et al., Reference Habara, Lancaster, Karsch, Murphy, Norreys, Evans, Borghesi, Romagnani, Zepf, Norimatsu, Toyama, Kodama, King, Snavely, Akli, Zhang, Freeman, Hatchett, MacKinnon, Patel, Key, Stoeckl, Stephens, Fonseca and Silva2004; PALS – this experiment; ISKRA-5 – Bessarab et al. Reference Bessarab, Gaidash, Dolgoleva, Zhidkov, Izgorodin, Kirillov, Kochemasov, Kunin, Litvin, Murugov, Nasyrov, Punin, Rogachev, Senik, Suslov, Tachaev and Shemyakin1992.
In contrast to Table 1 presenting the best results achieved Figure 7 shows a real shot-to-shot spread in the N-TOF spectra, which correlates with the spread in the yield of neutrons presented in Figure 5. These spreads are comparable with the spread in the number and kinetic energy of fast deuterons and other ions expanding into vacuum from the front side of the target. As the signal of scintillation detectors operated in current mode is disturbed by the shot noise and the number of neutrons inducing scintillations is not high enough, an average signal of scintillation detectors was used to determine the characteristics of neutrons observed in both the radial and on-axis directions, as Figures 7 and 8 show.
(Color online) N-TOF signals showing the shot-to-shot fluctuations in the neutron emission (#42602 and #42615 shots). The solid line represents the average N-TOF spectrum of 18 shots. Spectra were observed in radial direction at a distance of 387 cm from the target.
(Color online) Average N-TOF signal measured on-axis (forward) direction at a distance of 221 cm from the target.
Both the N-TOF spectra have maxima at a time corresponding to the neutron energy of about 2.45 MeV. It implies that the anticipated shift of the peak due to the Doppler effect reflecting the velocities of the reactants is insignificant. For that reason, the mean velocity of a main group of fusing deuterons is much lower than the velocity of neutrons carrying the fraction of the fusion energy of 2.45 MeV and, thus, the majority of fusing deuterons belongs to the slow ions class contrary to the fast deuterons expanding in the backward direction (see Figs. 2 and 4). The average N-TOF spectra allow to determine the equivalent temperature of fusing deuterons by using the formula ΔE N−DD = 82.5T 1/2 (Brysk, Reference Brysk1973; Wolle, Reference Wolle1999), where ΔE N−DD is the energy spread of DD−neutrons determined from Δτ FWHM of the N−TOF spectrum and T is the temperature of fusing ions. The value of T estimated from the average broad N-TOF spectra is about 100 keV. Although this equivalent temperature is comparable with the temperature of backward moving deuterons, which was estimated from the energy distribution of carbon ions rescaled to the mass of deuterons as mentioned above (see Fig. 4), this value can be overestimated because the neutrons could be also generated by a burst emission mechanisms which was observed in the ion emission (Krása et al., Reference Krása, Velyhan, Jungwirth, Krouský, Láska, Rohlena, Pfeifer and Ullschmied2009). In this case the temperature should decrease to a few tens of keV for the reason that the corresponding values ΔE N-j-burst of partial bursts are lower than the “total” ΔE N−DD. As the emission of partial bursts of ions has a cascading form with a delay between the bursts of about 4 ps to about 14 ps, a similar form of the accompanying emission of fused neutrons can be expected. Nevertheless, the full-time evolution of the neutron bursts cascade including the partial fusion burn times can be hardly uncovered from the mean N-TOF signal due to the averaging of shot-to-shot fluctuations, which are inherent to the burst emission mechanisms. Similar average N-TOF signal and, thus, energy spectra of neutrons were reported by Norreys et al. (Reference Norreys, Fews, Beg, Bell, Dangor, Lee, Nelson, Schmidt, Tatarakis and Cable1998) namely for the average intensity on target of 8 × 10¹⁸ W cm−2. This intensity made it possible to generate neutrons having energy distribution with FWHM of 680 keV.
The average N-TOF signal observed in the on-axis direction has FWHM ranging from about 1.3 to about 2.7 MeV. If the beam of deuterons hits nucleons in the stationary target along the target surface normal, then the energy of neutrons outgoing from the D(d,n)3He reaction depends on the energy of the collided deuterons. The neutrons emitted in the forward direction with energy of 3.1 MeV (a flight time of about 90 ns in Fig. 8) were generated by deuterons collided with about 250−keV energy, as can be estimated from the numerical modelling presented in (Rezac et al., Reference Rezac, Klir, Kubes and Kravarik2012). These 250−keV deuterons also cause the emission of neutrons in the backward and radial directions with energies of about 2 MeV and about 2.5 MeV, respectively. Regarding the radial spectrum, if the fusion neutrons are generated only by deuterons hitting the target along its surface normal (forward direction) with the 250-keV energy, then the neutrons emitted in the radial direction should have a very narrow spectrum of about 2.51 ± 0.01 MeV, as estimated from (Rezac et al., Reference Rezac, Klir, Kubes and Kravarik2012). However, the neutrons we observed in the radial direction have very broad spectrum (see Fig. 7), which is centred on the fusion energy fraction of 2.45 MeV carried by DD-neutrons, as similar spectra obtained on various other laser and plasma-focus devices show. Such broad spectra can be explained only by considering the deuterons impacting at various angles with respect to the laser-beam or plasma-focus axis (Ivanova-Stanik & Miklaszewski, Reference Ivanova-Stanik and Miklaszewski2009), because they should interact with each other via ‘transverse’ collisions of reacting nuclei (Norreys et al., Reference Norreys, Fews, Beg, Bell, Dangor, Lee, Nelson, Schmidt, Tatarakis and Cable1998) that have radial velocity components. It is also evident from the observed slow decrease in the on-axis N-TOF spectrum toward longer flight times that a significant number of forward neutrons was either produced in the backward direction, because the neutrons arriving at 140 ns (i.e., at a FWHM level) have the energy only of 1.3 MeV (see Fig. 8), or they originated from another nuclear reaction, as D−12C and 12C−D producing neutrons with lower energies up to 2.4 MeV (Toupin et al., Reference Toupin, Lefebvre and Bonnaud2001; Youssef et al., Reference Youssef, Kodama, Habara, Tanaka, Sentoku, Tampo and Toyama2005). A smaller portion of these slower neutrons was slowed down by collisions with a 'moderating' medium. The observed relative number of 1.3-MeV neutrons compared to 2.45-MeV ones is evidently higher than that observed in ps- and fs-experiments by Norreys et al. (Reference Norreys, Fews, Beg, Bell, Dangor, Lee, Nelson, Schmidt, Tatarakis and Cable1998; Reference Norreys, Lancaster, Habara, Davies, Mendonca, Clarke, Dromey, Gopal, Karsch, Kodama, Krushelnick, Moustaizis, Stoeckl, Tatarakis, Tampo, Vakakis, Wei and Zepf2005), Hilscher et al. (Reference Hilscher, Berndt, Enke, Jahnke, Nickles, Ruhl and Sandner2001), and Izumi et al. (Reference Izumi, Sentoku, Habara, Takahashi, Ohtani, Sonomoto, Kodama, Norimatsu, Fujita, Kitagawa, Mima, Tanaka and Yamanaka2002). Nonetheless, the single-shot N-TOF signals (see Fig. 7) converted into the energy spectra are very similar to the energy spectra produced from a CD2 target exposed to the intensity of 3 × 10¹⁸ W/cm2 (450 fs, 20 J, 1053 nm) shown in Figure 4 in Youssef et al. (Reference Youssef, Kodama, Habara, Tanaka, Sentoku, Tampo and Toyama2005).
CONCLUSION
Based on the observed neutron yield per deposited laser energy of 3.5 × 10⁵ neutrons/J and the maximum proton energy of about 4 MeV, the important role of non-linear processes in the reported experiments is evident. Beside a number of instabilities being harmful to laser fusion processes due to the caused by them undesirable losses in the deposited energy, the self-focusing occurring in the plasma (Young et al., Reference Young, Hammer, Wilks and Kruer1995) may have a partially favorable effect. This can be inferred, for example, from the observed emission characteristics of the plasma produced by the 3-TW PALS system, which do not scale with the similarity parameter Iλ2 as presumed by a number of scaling experiments (Tan & Williams, Reference Tan, McCall and Williams1984; Clark et al., Reference Clark, Krushelnick, Zepf, Beg, Tatarakis, Machacek, Santala, Watts, Norreys and Dangor2000; Krushelnick et al., Reference Krushelnick, Najmudin and Dangor2007). On the other hand, the second key parameter, which should be taken into account, is the laser energy, which influences the number of fusing ions (Madison et al., Reference Madison, Patel, Allen, Price, Fitzpatrick and Ditmire2004).
Our analysis of the observed TOF ion spectra as well as of Thomson parabolas has shown that the bursts in the emission of D+ and Cq+ ions are manifestations of one of important characteristic instabilities accompanying the laser-matter interaction. It was shown that the maximum centre-of-mass energy of deuterons expanding into the vacuum reaches a value of about 2 MeV and the corresponding range of energy spreads of partial D+ bursts ΔE D-n is 6 to 270 keV.
The broad forward and radial N-TOF spectra indicate that the observed neutrons were produced not only by the D(d,n)3He reaction but also by D−12C and 12C−D ones producing the slower neutrons. Owing to disintegration of the sub − nanosecond laser pulse into many ps-cycles (Krása et al. Reference Krása, Velyhan, Jungwirth, Krouský, Láska, Rohlena, Pfeifer and Ullschmied2009), which causes repetitive bursts in ion emission, it is difficult to decide which mechanism of deuteron acceleration is the dominant process of neutron generation. Thus, more experimentation is needed on sub-nanosecond laser-matter interaction to elucidate the influence of the burst instability on neutron production.
ACKNOWLEDGMENT
This work benefited from support of the Czech Science Foundation (Grant Nos. P205/12/0454), and of the Czech Republic's Ministry of Education, Youth and Sports to the OPVK (Project IC: EE2.3.20.0279) and PALS RI (Project IC: LM2010014) projects.