INTRODUCTION
The abundance and species composition of phytoplankton in marine environments are strongly influenced by a multitude of physiochemical (e.g. temperature, salinity and nutrient availability) and biological (e.g. grazing) factors (Officer & Ryther, Reference Officer and Ryther1980; Brand & Guillard, Reference Brand and Guillard1981; Burkill et al., Reference Burkill, Mantoura, Llewellyn and Owens1987; Doney, Reference Doney2006; Moran et al., Reference Moran, Lopez-Urrutia, Calvo-Diaz and Li2010). How phytoplankton size structure and community composition shift with changes in environmental factors associated with the continuum from estuarine to coastal environments is not well understood.
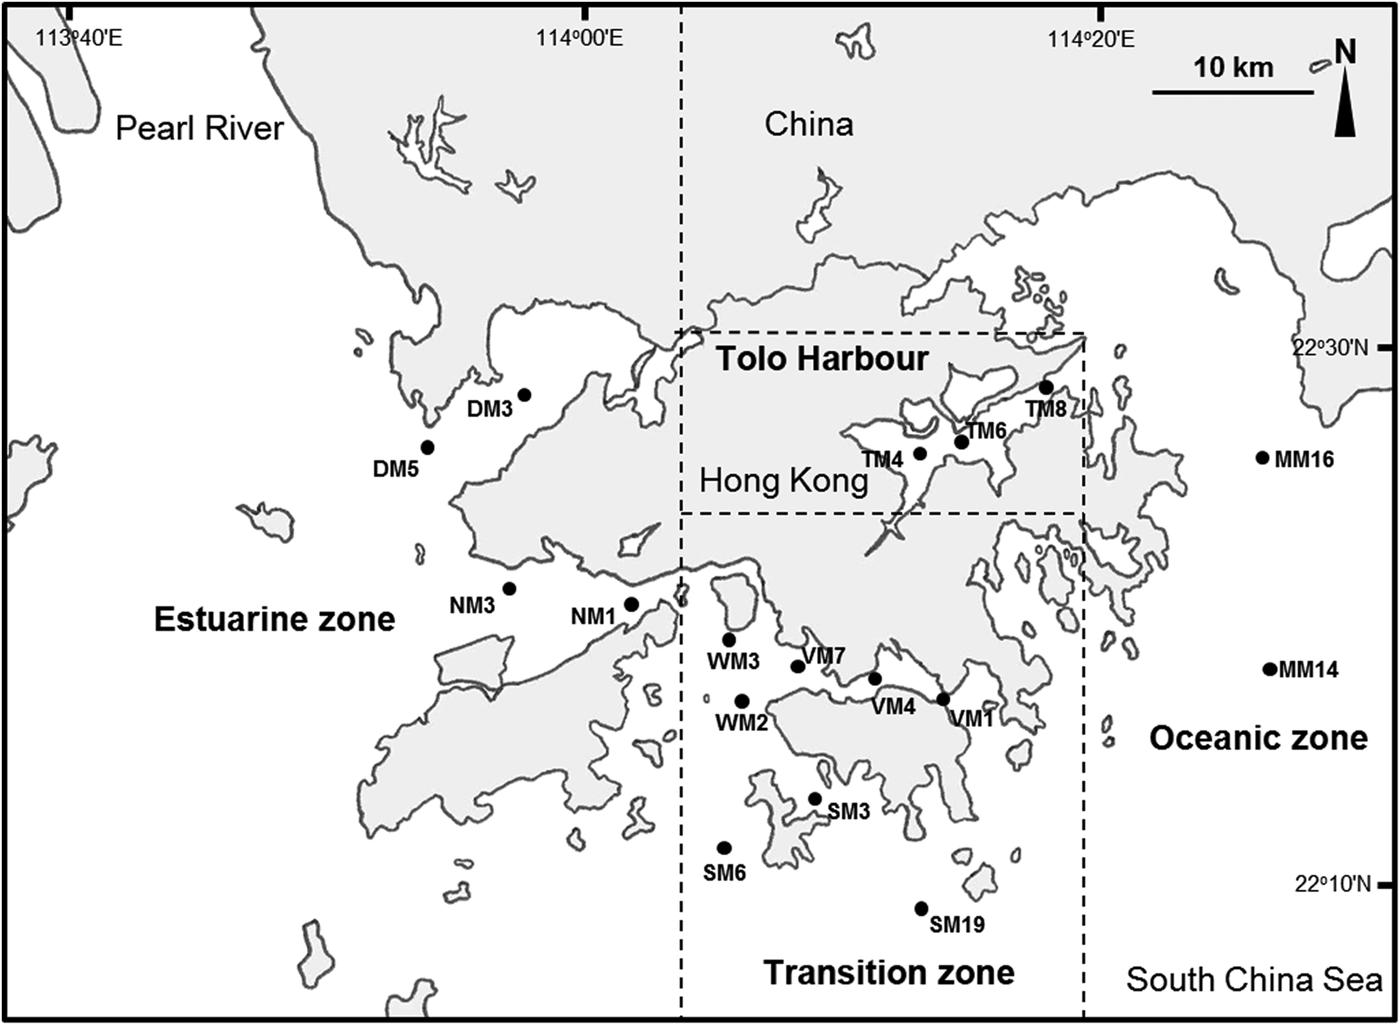
Located near the Pearl River estuary in the southern coast of China, Hong Kong's coastal waters are characterized by a transition from an estuarine environment in the west to an oceanic condition in the east (Chau, Reference Chau1958; Morton & Wu, Reference Morton and Wu1975). Morton (Reference Morton, Morton and Tseng1982) divided Hong Kong's coastal waters into three zones with different hydrographic characteristics (Figure 1), but the boundaries of the hydrographic zones vary seasonally and have not been clearly defined. The estuarine zone in the western part of Hong Kong is strongly influenced by sediment-laden discharges from the Pearl River, especially during the rainy season (summer). The oceanic zone, which covers the entire eastern part of Hong Kong, is marked by marine waters with high salinity. The central region of Hong Kong, including Victoria Harbour and the southern part of Hong Kong Island, represents a zone of transition where the influence of estuarine waters from the west is strongest in summer and weakens in winter with reduced discharge from the Pearl River.
Map of Hong Kong with locations of 17 sampling stations in the estuarine zone, transition zone, oceanic zone and Tolo Harbour.

Phytoplankton monitoring in Hong Kong's coastal seas began in the 1980s. Data collected by the Hong Kong Environmental Protection Department (HKEPD) and other investigators have provided useful information on the relationships between hydrographic parameters and phytoplankton abundance (Yung et al., Reference Yung, Wong, Yau and Qian2001; Yin, Reference Yin2002; Lie et al., Reference Lie, Wong, Lam, Liu and Yung2011; HKEPD, 2012). However, due to the lack of taxonomic expertise, past studies tended to focus on large diatoms and dinoflagellates which possess external morphological features for identification by light microscopy and are implicated in algal blooms. While the size structure of the phytoplankton community may impact the efficiency of energy transfer between trophic levels in the food web (Sheldon et al., Reference Sheldon, Prakash and Sutcliffe1972; Barnes et al., Reference Barnes, Maxwell, Reuman and Jennings2010), information on the abundance, distribution and taxonomic composition of small phytoplankton is limited. In recent years, chemotaxonomic marker pigments, separated by high performance liquid chromatography (HPLC), have been widely used to provide information on the pigment composition of phytoplankton communities and to identify small and fragile microalgae that are easily lost in microscopic analyses (Jeffrey et al., Reference Jeffrey, Mantoura and Wright1997).
The objectives of this study are: (1) to use HPLC analyses of marker pigments to analyse the pigment compositions of phytoplankton of different size fractions in Hong Kong's coastal waters and (2) to study how phytoplankton communities change across the transition from estuarine to oceanic conditions in Hong Kong's marine environment. While several recent studies have investigated the relationship between macronutrient concentrations and phytoplankton abundance in the Pearl River estuary to the west of Hong Kong (Yin, Reference Yin2002; Huang et al., Reference Huang, Jian, Song, Huang, Liu, Qian, Yin and Wu2004; Ho et al., Reference Ho, Xu, Yin, Jiang, Yuan, He, Anderson, Lee and Harrison2010), few studies have focused on the community composition and size structure of the phytoplankton in marine areas within Hong Kong's territorial boundary. We hope to provide information to elucidate the linkage between environmental variables and phytoplankton community composition in coastal waters with different hydrographic conditions in an estuarine-coastal continuum.
MATERIALS AND METHODS
Field sampling
Phytoplankton sampling was conducted at 17 sampling stations in Hong Kong's coastal waters (Figure 1) in summer (July and August 2009) and winter (December 2009 and January 2010) aboard HKEPD's marine monitoring vessel ‘Dr. Catherine Lam’. A rosette water sampler was used to collect water samples at 0.5 m below the surface. Water samples were immediately pre-filtered through a 200 µm mesh to remove debris and zooplankton larger than 200 µm, returned to the laboratory in two 2 l brown bottles, and stored at 4°C until processing. Environmental variables including temperature, salinity and turbidity were also recorded at 0.5 m below the surface using a conductivity-temperature-depth profiler (SEACAT 19+ CTD with OBS-3 turbidity sensor) connected to the water sampler and controlled by an on-board computer.
Samples and data analyses
Concentration of ammonium (NH4+), nitrate (NO3−), phosphate (PO43−) and silica (SiO2) were measured by HKEPD using methods described by the American Public Health Association (APHA, 1995). In our laboratory, water samples for pigment analysis were filtered through filters with different pore sizes to obtain phytoplankton of 20–200, 5–20, 2–5 µm (Poretics® polycarbonate membrane filters) and 0.7–2 µm (Whatman GF/F filters) size fractions. The filters were blotted dry, wrapped in aluminium foil, and stored at −80°C before pigment extraction. Pigments were extracted by cutting the filter papers into small pieces under dim light conditions and extracted in 90% acetone (HPLC grade) in darkness for 24 h. Extracts were centrifuged for 15 min at 4800 rpm at 4°C. The supernatant was collected with a syringe (Terumo) and filtered through a 0.2 µm PTEF filter membrane (Nalgene). A 20 µl aliquot of the filtered extract was injected into the HPLC machine (Hewlett Packard HP 1100 series) for pigment analyses according to the methods described in Wright et al. (Reference Wright, Jeffrey, Mantoura, Llewellyn, Bjornland, Repeta and Welschmeyer1991) and Lie & Wong (Reference Lie and Wong2010).
Tolo Harbour, a semi-enclosed bay in the north-eastern corner of Hong Kong, was originally assigned to the transition zone by Morton (Reference Morton, Morton and Tseng1982). In this study, Tolo Harbour was considered separately from the rest of the transition zone because of its landlocked topography, poor water circulation, and long history of eutrophication.
The software PRIMER 6 (PRIMER-E Ltd, Plymouth, UK) was used to perform principal component analysis (PCA) on the environmental variables and multidimensional scaling (MDS) analyses on the concentration of chlorophyll a (Chl a) and selected pigments. Environmental variables, including temperature, salinity, turbidity, NH4+, NO3−, PO43− and SiO2, were log (x + 1) transformed before conducting the PCA. Pigment concentrations were square-root transformed to construct a Bray–Curtis similarities matrix for the MDS analysis. Only MDS plots with stress values ≤0.05, which indicated excellent representation of the community composition on the ordination, were presented. Correlation analyses and two-way analyses of variance (two-way ANOVA) were carried out using Sigmaplot 12.0 (Systat Software Inc., USA) and SPSS 19 (IBM Corporation, USA).
RESULTS
Seasonal and spatial variations in environmental variables
SUMMER
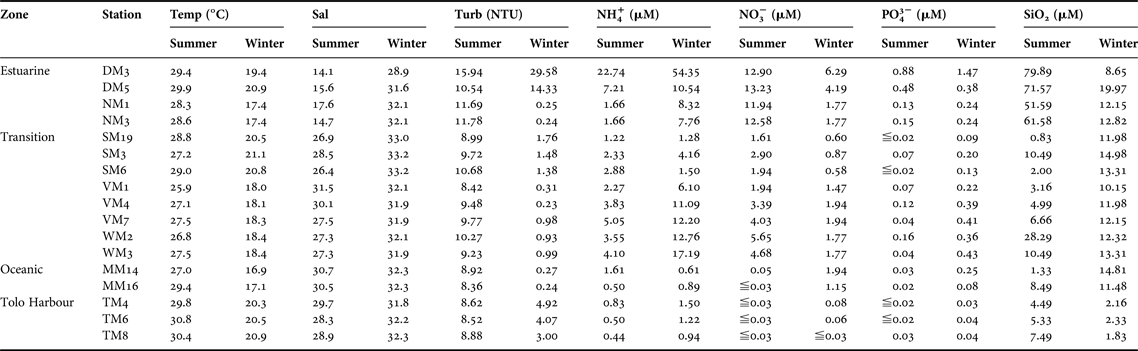
Surface water temperature in Hong Kong ranged from 25.9 to 30.8°C in summer (Table 1). The estuarine zone was characterized by low salinity (14.1–17.6) and high turbidity (10.54–15.94 NTU). High concentrations of NH4+ (7.21–22.74 µM), NO3− (12.90–13.23 µM), PO43− (0.48–0.88 µM), and SiO2 (71.57–79.89 µM) were recorded at DM3 and DM5 in the inner part of Deep Bay. Concentrations of NH4+ and NO3− in the transition zone ranged from 1.22 to 5.05 µM and 1.61 to 5.65 µM, respectively. Concentrations of PO43− averaged 0.16 µM at WM2, but samples with concentrations below the detection limit of 0.02 µM were also found in the same zone. The concentrations of SiO2 were much higher in the estuarine zone (51.59–79.89 µM) than in the transition zone, the oceanic zone and Tolo Harbour. Nutrient concentrations at TM4, TM6 and TM8 in Tolo Harbour were generally low, with the concentrations of NH4+ and SiO2 ranging from 0.44 to 0.83 µM and 4.49 to 7.49 µM, respectively. The concentrations of NO3− and PO43− were below the detection limits of 0.03 and 0.02 µM, respectively, for most samples collected from Tolo Harbour (Table 1).
Mean values of temperature, salinity, turbidity and nutrient concentrations at 17 sampling stations in Hong Kong's coastal waters in summer (July–August 2009) and winter (December–January, 2010).
Temp, temperature; Sal, salinity; Turb, turbidity; NH4+, ammonium; NO3−, nitrate; PO43−, phosphate; SiO2, silica.
WINTER
Surface water temperature dropped to 16.9–21.1°C in winter (Table 1). In the estuarine zone, a decrease in the discharge of fresh water from the Pearl River was marked by sharp increases in salinity (28.9–32.1) (Table 1). While turbidity at DM3 and DM5 remained high (14.33–29.58 NTU), a decrease in turbidity was recorded at NM1 and NM3 (0.24–0.25 NTU). As in summer, nutrient concentrations were generally much higher at DM3 and DM5 than in the other sampling stations. High concentrations of NH4+ (10.54–54.35 µM), NO3− (4.19–6.29 µM) and PO43− (0.38–1.47 µM) were recorded at DM3 and DM5. Surprisingly, the SiO2 concentrations were lower at DM3 than at DM5, NM1 and NM3. Relatively high concentrations of NH4+ (1.28–17.19 µM), PO43− (0.09–0.43 µM) and SiO2 (10.15–14.98 µM) were recorded in the transition zone. The oceanic zone was characterized by high concentrations of SiO2 (11.48–14.81 µM) and low concentrations of PO43− (0.08–0.25 µM). In general, nutrient concentrations were lower at TM4, TM6 and TM8 in Tolo Harbour than in other stations (Table 1).
ANALYSES OF ENVIRONMENTAL VARIABLES
Spatial and temporal variations in environmental variables were analysed by two-way ANOVA. Salinity varied both seasonally (P < 0.001) and spatially (P < 0.001), and there was significant interaction between season and zone (P < 0.001) (Table 2). According to simple-main-effects analysis, seasonal variations in salinity occurred in all zones except the oceanic zone (F (1, 26) = 1.159, P = 0.292). Not unexpectedly, salinity varied among zones only in summer (F (3, 26) = 158.356, P < 0.001), but not in winter. Significant variations among zones (P < 0.001) and significant interaction between season and zone (P < 0.001) were detected in SiO2 concentrations (Table 2). According to simple-main-effects analysis, significant zonal variations in SiO2 concentrations occurred in both summer (F (3, 26) = 21.281, P < 0.001) and winter (F (3, 26) = 6.770, P = 0.002). NO3− concentrations showed significant variation among zones and interaction between season and zone (P < 0.001, Table 2). Simple-main-effects analysis showed zonal variations in NO3− concentrations in both summer (F (3, 26) = 62.683, P < 0.001) and winter (F (3, 26) = 13.345, P < 0.001). Significant spatial variations were also found in NH4+ (P < 0.001) and PO43− (P = 0.002) concentrations.
Result of two-way ANOVA on log (x + 1) transformed environmental variables and chlorophyll a concentrations. Bold values represent statistical significance at P < 0.05 level.
Temp, temperature; Sal, salinity; Turb, turbidity; NH4+, ammonium; NO3−, nitrate; PO43−, phosphate; SiO2, silica; Chl a, chlorophyll a in the <200 µm size fraction.
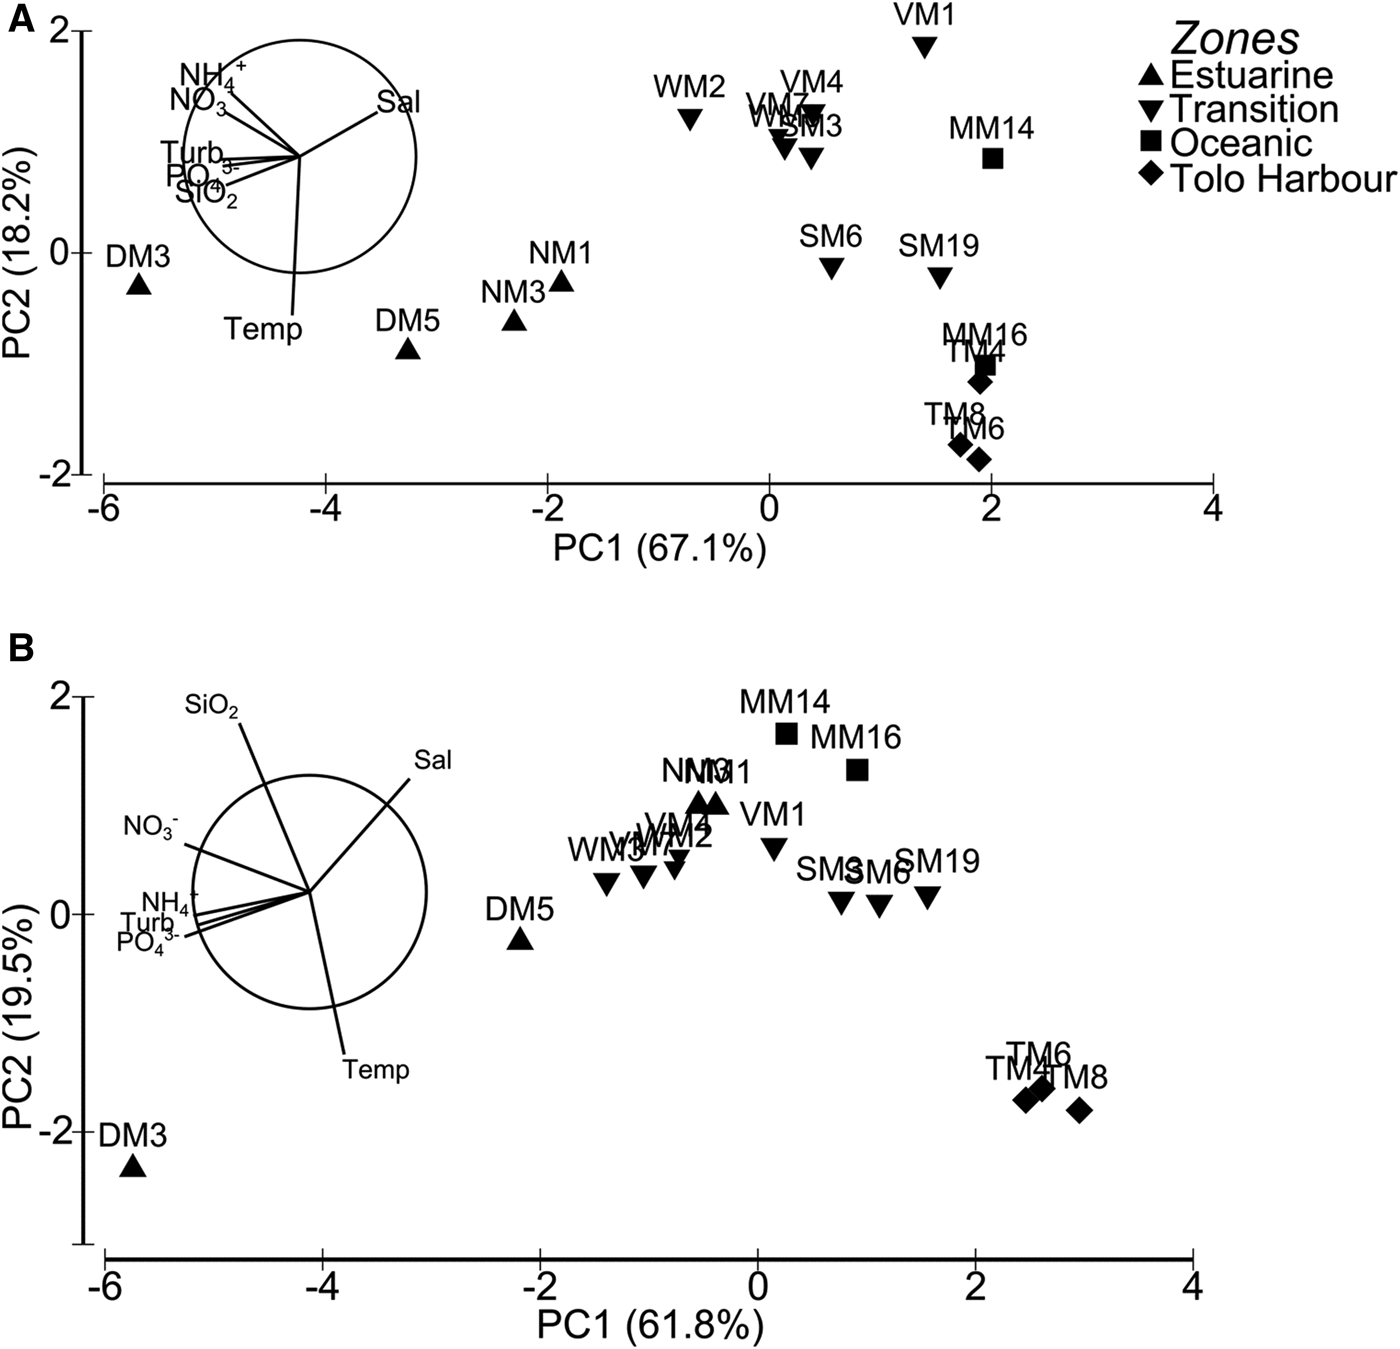
According to PCA, principal components 1 (PC1) and 2 (PC2) explained collectively 85.2% of the total variations in environmental variables in summer (Figure 2A). The component PC1 gave relatively greater weights to turbidity (−0.427), salinity (0.422), and PO43− (−0.417), while PC2 assigned significant weights to temperature (−0.895) and NH4+ (0.343). Biplot of environmental variables in summer showed that PO43−, SiO2 and turbidity were highly related, while NH4+ was highly related to NO3−. Hydrographic conditions of sampling stations were mainly distinguished by turbidity and salinity in summer.
Principal component-analysis biplots based on temperature, salinity, turbidity and nutrient concentrations in 17 sampling stations: (A) summer; (B) winter.
In winter, PC1 and PC2 explained collectively 81.3% of the total variations in environmental variables (Figure 2B). The component PC1 assigned equal weights to NO3− (−0.461) and PO43− (−0.461), while PC2 assigned significant weights to SiO2 (0.622) and temperature (−0.598). Biplot of environmental variables in winter showed that NH4+, PO43− and turbidity were highly related, with NO3− and PO43− being the major components distinguishing hydrographic conditions of stations.
Chl a and chemotaxonomic marker pigments
SPATIAL AND SEASONAL PATTERNS IN Chl A CONCENTRATIONS
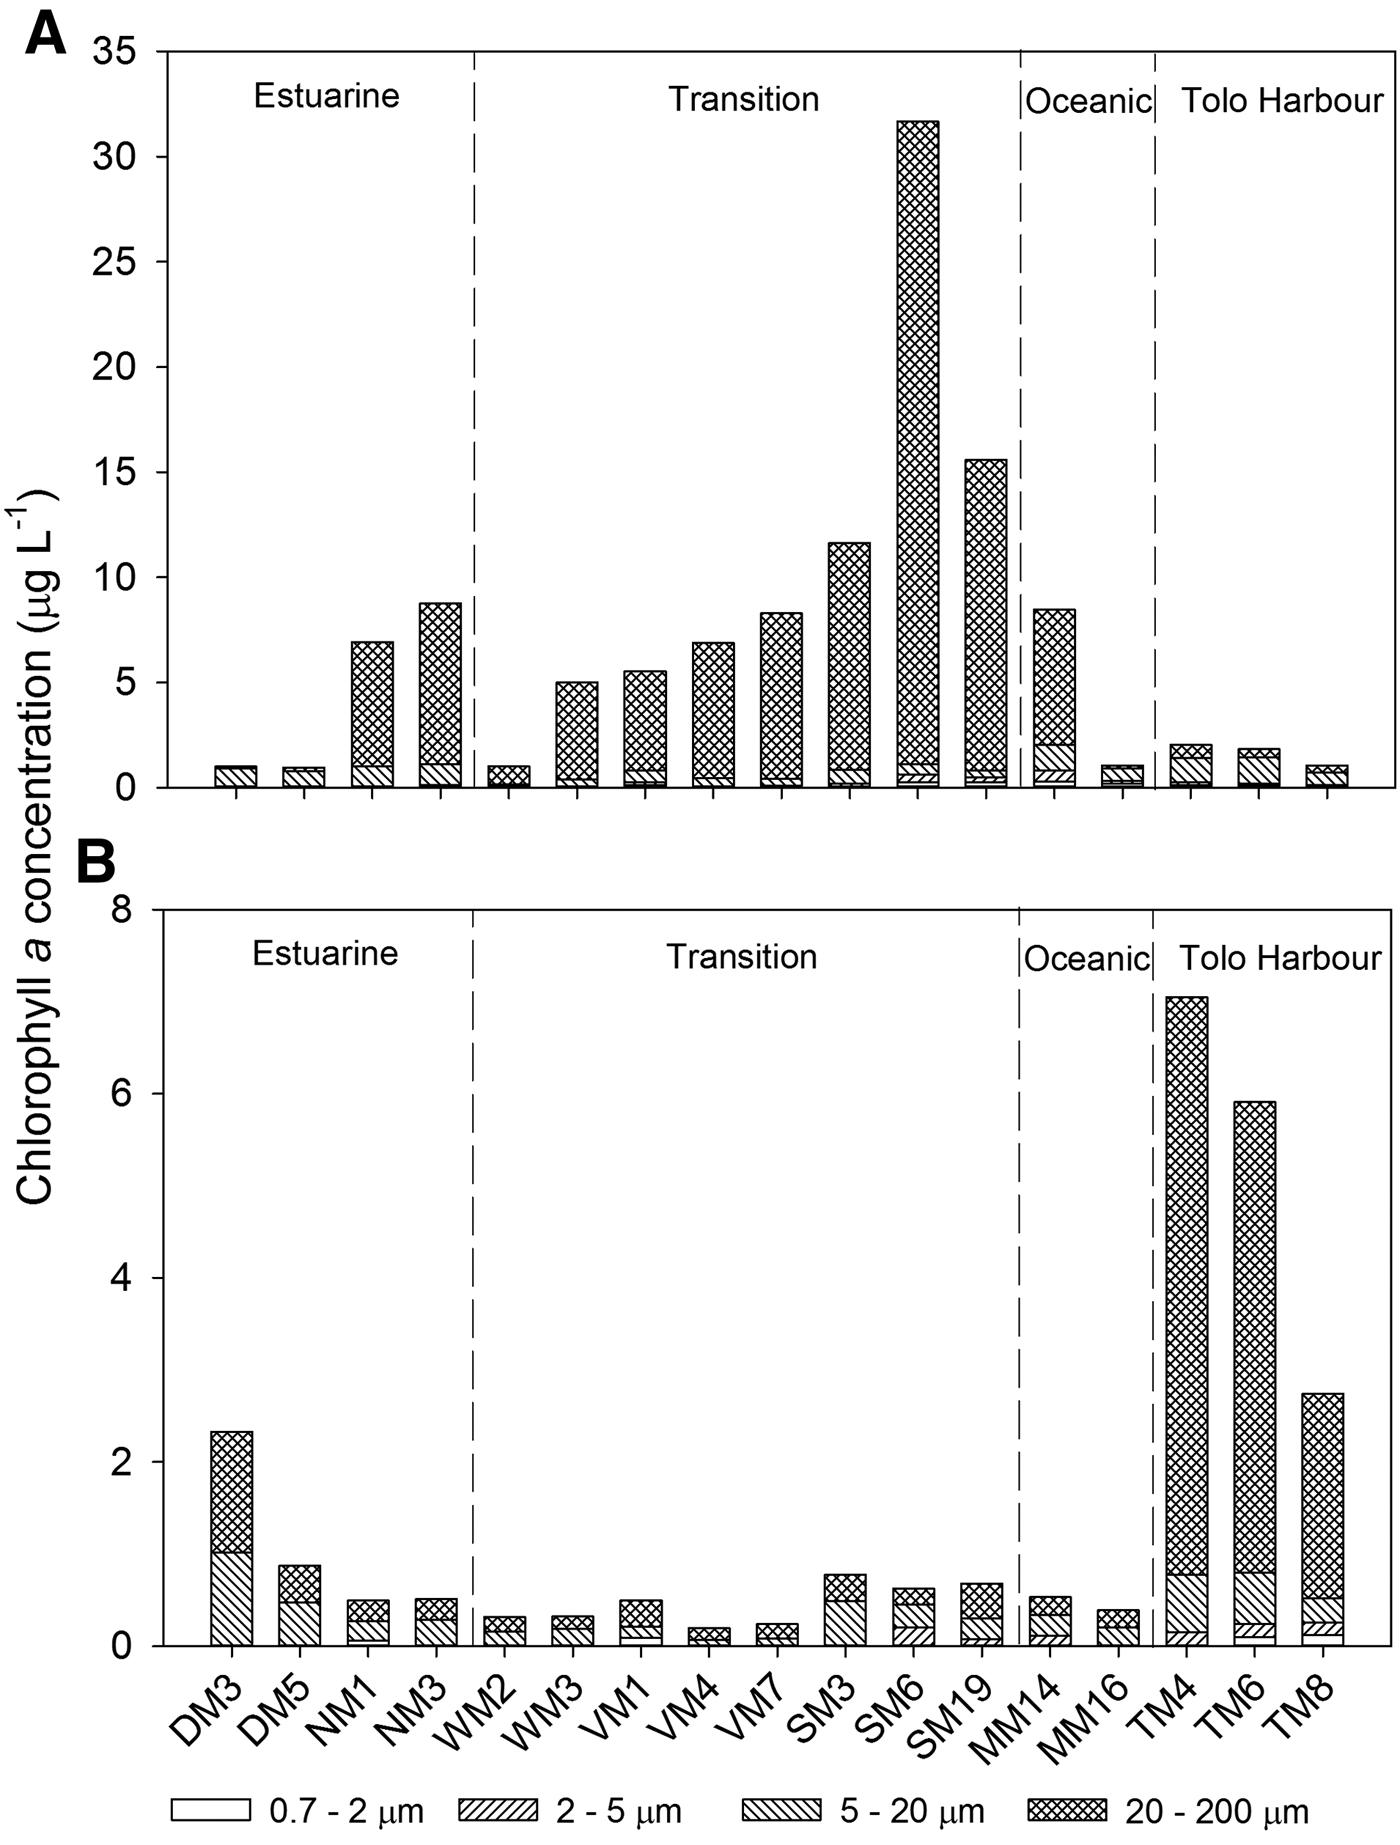
Over the entire study area, total Chl a concentrations (<200 µm) averaged 6.93 µg l−1 in summer and 1.44 µg l−1 in winter. In summer, total Chl a concentrations ranged from 1.0 to 31.7 µg l−1, while concentrations >10 µg l−1 were recorded at SM3, SM6 and SM19 in the transition zone (Figure 3A). Over the entire study period, the 20–200 µm size fraction accounted for over 90% of the total Chl a concentrations at most stations. Total Chl a concentrations ranged from 0.2 to 7.0 µg l−1 in winter, with higher concentrations at TM4, TM6 and TM8 in Tolo Harbour (Figure 3B). On average, the 20–200 and 5–20 µm size fractions accounted for over 90% of total Chl a concentrations.
Chlorophyll a concentrations in various size fractions in 17 sampling stations in Hong Kong's coastal waters: (A) summer; (B) winter.
Results of two-way ANOVA showed significant seasonal variations (P = 0.004), but no zonal variations, for total Chl a concentrations (Table 2). In general, Chl a concentrations were higher in summer than in winter. Interaction between season and zone was also significant (P < 0.001). Analysis of simple main effects revealed that seasonal variations in total Chl a concentrations were significant only in the transition zone (F (1, 26) = 38.171, P < 0.001). Positive correlations between Chl a concentrations of various size fractions (except the 2–5 µm size fraction) and surface water temperature (Table 3) suggested that phytoplankton abundance increased with increasing temperature. In general, Chl a concentrations correlated poorly with nutrient (NH4+, NO3−, PO43−, and SiO2) concentrations, although significant negative correlations were found between Chl a concentrations from the <2 µm size fraction and the concentrations of NO3−, PO43− and SiO2 (Table 3).
Pearson correlations between chlorophyll a concentrations in various size fractions and environmental variables. Bold values represent statistical significance at P < 0.05 level.
Temp, temperature; Sal, salinity; Turb, turbidity; NH4+, ammonium; NO3−, nitrate; PO43−, phosphate; SiO2, silica.
SPATIAL AND SEASONAL PATTERNS IN MARKER PIGMENT CONCENTRATIONS
HPLC analyses of chemotaxonomic marker pigments provided information on the taxonomic composition of the phytoplankton community. Fucoxanthin, an indicator of diatoms, was the most abundant and ubiquitous accessory pigment at all stations during both summer and winter (Tables 4 and 5). The ratio of fucoxanthin concentration to Chl a concentration (Fuco:Chl a ratio, abbreviations for marker pigments listed in Tables 4 and 5) for the >200 µm size fraction was >0.50 at most stations during both summer and winter. Peridinin, a signature pigment of dinoflagellates, was recorded at nine stations in summer and four stations in winter. An algal bloom occurred at SM6 during the summer when total Chl a concentration was >30 µg l−1 and the phytoplankton assemblage was dominated by cells in the 20–200 µm size range. A Peri:Chl a ratio of 0.11 suggested that the algal bloom was caused by rapid growth of dinoflagellates. Surprisingly, Peri:Chl a ratios >0.15 were recorded at MM14 and MM16 in the oceanic zone in winter when total Chl a concentration was <0.5 µg l−1.
Pigment to total chlorophyll a ratios for phytoplankton (<200 µm) at 17 sampling stations in Hong Kong's coastal waters in summer (July–August 2009). ‘–’ represents cases where ratios were not calculated because pigment concentrations were below detection limit.
Dv Chl a, Divinyl chlorophyll a; Chl b, chlorophyll b; Allo, alloxanthin; Fuco, fucoxanthin; 19 hex, 19-hex-fucoxanthin; Lut, lutein; Peri, peridinin; Viola, violaxanthin; Zea, zeaxanthin.
Pigment to total chlorophyll a ratios for phytoplankton ( < 200 µm) at 17 sampling stations in Hong Kong's coastal waters in winter (December–January, 2010). ‘–’ represents cases where ratios were not calculated because pigment concentrations were below detection limit.
Dv Chl a, Divinyl chlorophyll a; Chl b, chlorophyll b; Allo, alloxanthin; Fuco, fucoxanthin; 19 hex, 19-hex-fucoxanthin; Lut, lutein; Peri, peridinin; Viola, violaxanthin; Zea, zeaxanthin.
The accessory pigment 19-hex-fucoxanthin was recorded at nine stations in summer and 10 stations in winter, but the 19 hex:Chl a ratios were <0.10 in all samples. Lutein and chlorophyll b are major pigments in green algae. Both pigments were common in the inner part of Deep Bay in the estuarine zone in summer. Alloxanthin, a marker pigment for cryptomonads, occurred at most stations during both summer and winter. Ratios of >0.20 of Allo:Chl a were recorded at DM3 in summer and WM2 in winter. Zeaxanthin, a marker pigment for cyanobacteria, was found only in summer. Zea:Chl a ratios >0.1 were detected at TM6 and TM8 in Tolo Harbour, and at MM16 in the oceanic zone.
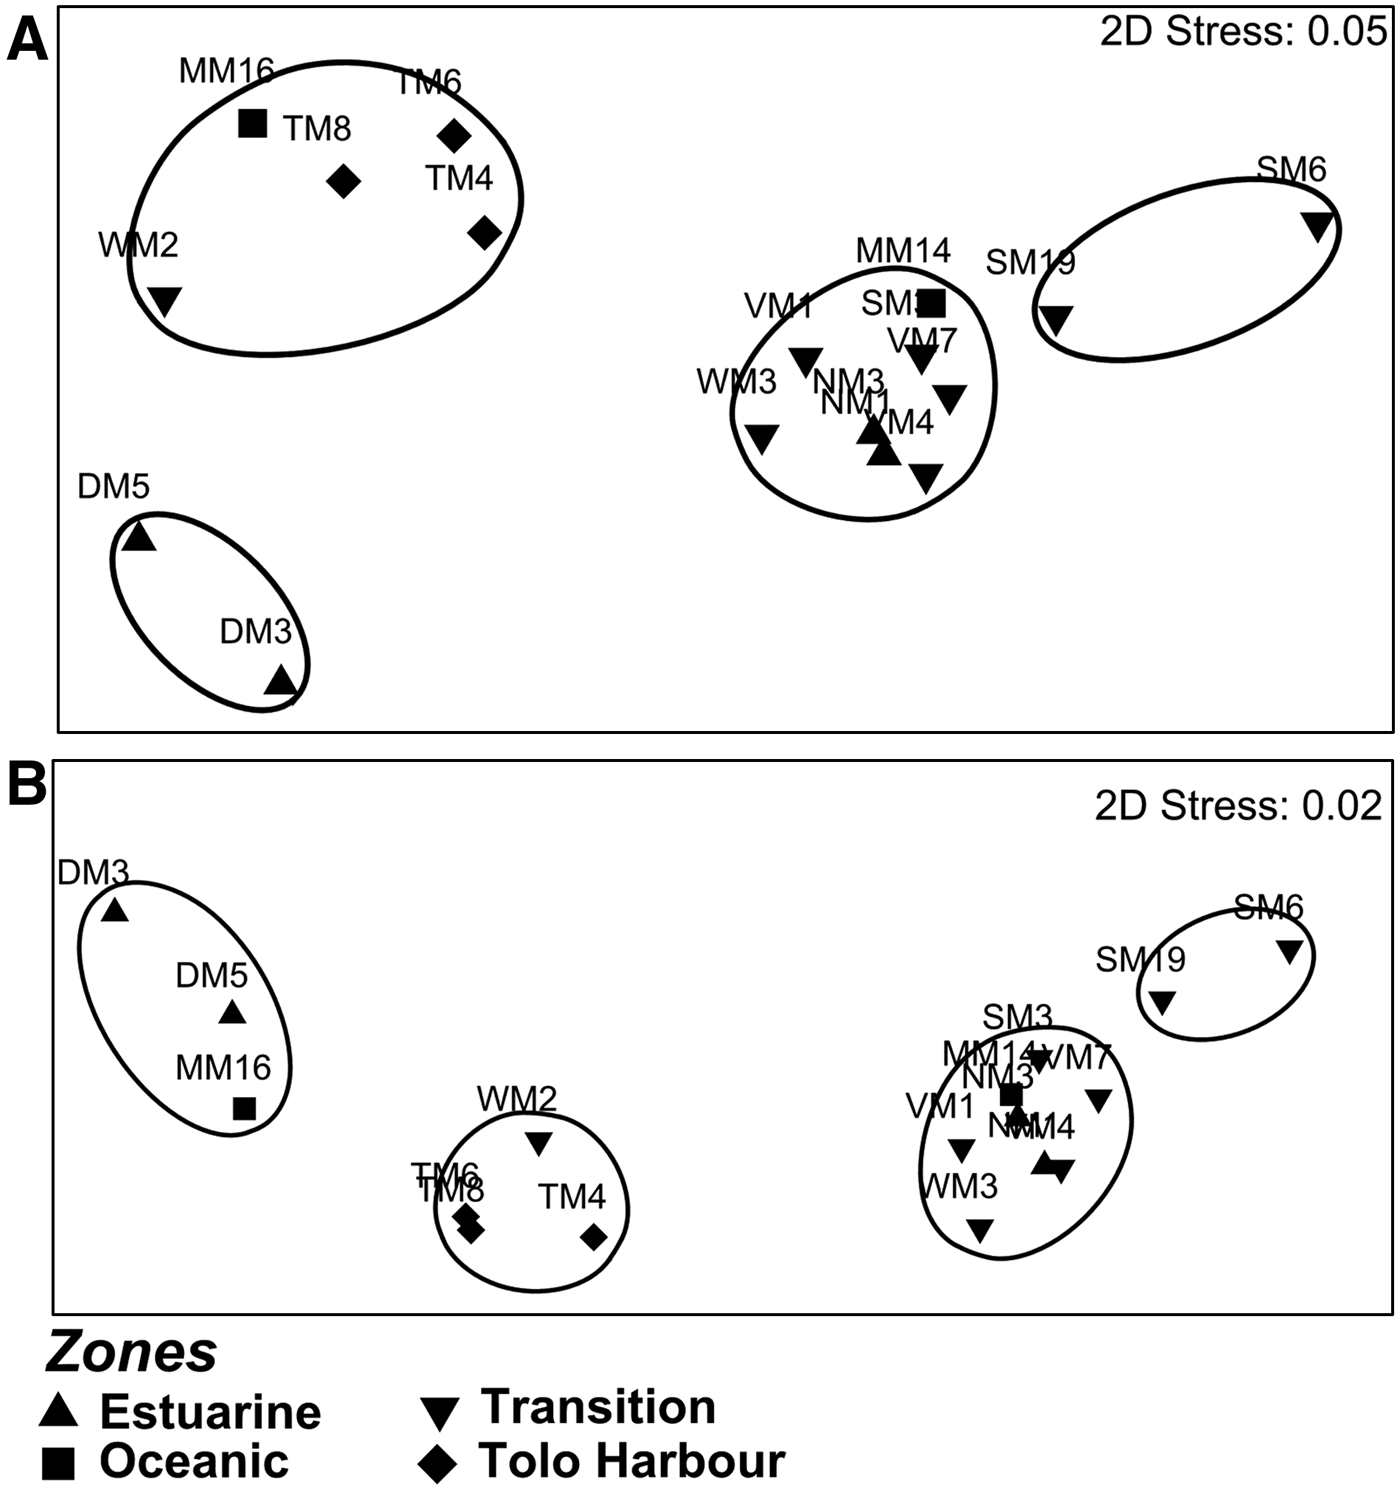
Phytoplankton communities were separated into distinct clusters by MDS plots. In summer, a distinct cluster formed by DM3 and DM5 in Deep Bay in the estuarine zone was observed at the 65% similarity level for the <200 µm size fraction (Figure 4A). Likewise, clustering of some stations from the estuarine and oceanic zones at the 65% similarity level suggested that these two zones were poorly separated based on phytoplankton in the <200 µm size fraction. Clustering of stations from different zones suggested that zonal separation was poor based on phytoplankton in the 20–200 µm size fraction (Figure 4B). In winter, a distinct cluster formed by stations in Tolo Harbour (TM4, TM6 and TM8) was detected at the 65% similarity level for both the <200 and 20–200 µm size fractions (Figure 5A, B). However, no clear zonal separation was detected for phytoplankton <5 µm in winter (Figure 5C).
Multidimensional-scaling-ordination plots based on Bray–Curtis similarity of pigment compositions of phytoplankton in summer of size fractions: (A) <200 µm; (B) 20–200 µm. Only plots with stress values ≤0.05 were shown and stations sharing ≥65% similarity are encircled.
Multidimensional-scaling-ordination plots based on Bray–Curtis similarity of pigment compositions of phytoplankton in winter of size fractions: (A) <200 µm; (B) 20–200 µm; (C) <5 µm. Only plots with stress values ≤0.05 were shown and stations sharing ≥65% similarity are encircled.
DISCUSSION
Hydrographic conditions in coastal waters around Hong Kong
Hong Kong's coastal waters are influenced by water masses from the South China Sea throughout the year and by estuarine inputs from the Pearl River during the rainy season in summer. Impacted by discharges from the Pearl River, seawater in the estuarine zone to the west of Hong Kong is characterized by low salinity, high turbidity and high nutrient concentrations during the period from April to October (Broom & Ng, Reference Broom and Ng1995; Zhang et al., Reference Zhang, Yu, Wang, Ren, Chen, Xiong, Dong and Xu1999). During the dry season, a decline in river flow is accompanied by an intrusion of seawater from the South China Sea into the Pearl River Estuary and marked increases in salinity in the entire estuarine zone.
Influenced by the influx of large quantities of suspended solids as well as pollutants in the form of agricultural and domestic wastes from Hong Kong and Shenzhen (Broom & Ng, Reference Broom and Ng1995), turbidity at DM3 and DM5 in the inner part of Deep Bay remains high throughout the year. Light attenuation by suspended sediments may decrease phytoplankton productivity (Cloern, Reference Cloern1987). In this study, Chl a concentrations at DM3 and DM5 were low during the summer when turbidity was extremely high. However, it should be noted that data collected by HKEPD show that Chl a concentrations in the inner part of Deep Bay tend to be higher and more variable compared with other areas during the summer (HKEPD, 2012).
Marked increases in salinity, turbidity and nutrient concentrations allow the estuarine zone to be readily distinguished from the other hydrographic zones in summer. Deep Bay is considered to be highly eutrophic due to nutrient inputs from the Shenzhen River and the Yuen Long creeks (Qi & Zhang, Reference Qi, Zhang and McComb1995; HKEPD, 2012). Tolo Harbour can be distinguished from the other areas in winter. Tolo Harbour, a semi-enclosed bay in the north-eastern part of Hong Kong, is naturally eutrophic due to its landlocked topography and limited tidal exchange (Hodgkiss & Yim, Reference Hodgkiss, Yim and McComb1995). Water residence time in the inner part of Tolo Harbour ranges from 16 to 42 days under normal conditions (Oakley & Cripps, Reference Oakley, Cripps and Ruivo1972; Preston, Reference Preston and Morton1975). Limited tidal exchange with Mirs Bay and a long flushing period allow nutrients, pollutants and phytoplankton to accumulate in Tolo Harbour.
A decreasing trend in nutrient concentrations across Hong Kong's coastal waters from the estuarine zone in the west to the oceanic zone in the east was observed in this study. This is in agreement with observations of decreases in nutrient concentrations along the estuarine-coastal continuum reported by other investigators (Yin et al., Reference Yin, Qian, Chen, Hsieh and Harrison2000; Miao et al., Reference Miao, Hutchins, Yin, Fu, Harrison and Wang2006). While it is commonly argued that many estuarine and coastal seas are nitrogen (N) limited (Nixon et al., Reference Nixon, Oviatt, Frithsen and Sullivan1986; Howarth & Marino, Reference Howarth and Marino2006), phytoplankton growth in the western and southern waters of Hong Kong is believed to be limited mainly by phosphorus (Zhang et al., Reference Zhang, Yu, Wang, Ren, Chen, Xiong, Dong and Xu1999; Miao et al., Reference Miao, Hutchins, Yin, Fu, Harrison and Wang2006). Reduction in N loading has been linked to increases in the abundance and diversity of N2-fixing cyanobacteria in the Neuse River Estuary in North Carolina (Piehler et al., Reference Piehler, Dyble, Moisander, Pinckney and Paerl2002). In this study, strong negative correlations between Chl a concentrations in the <2 µm size fraction and nutrient variables including NO3−, PO43− and SiO2 suggest that nutrients may not be the limiting factors for phytoplankton growth. An alternative explanation is that small phytoplankton are allowed to thrive during periods when nutrient levels are too low to support the growth of larger cells. Since zeaxanthin, an indicator of cyanobacteria, was only detected in summer, it can be argued that the abundance of cyanobacteria was related to water temperature (Tang et al., unpublished).
Seasonal and spatial patterns in phytoplankton communities
Our results reveal that Chl a concentrations differ between summer and winter, but do not display spatial patterns that reflect hydrographical zonation. Seasonal and spatial patterns in Chl a concentrations in Hong Kong's coastal waters have been documented by various investigators. According to Chiu et al. (Reference Chiu, Hodgkiss and Chan1994), Chl a concentrations in Tai Tam Bay in the southern part of the transition zone were highest during the period from August to October. Miao et al. (Reference Miao, Hutchins, Yin, Fu, Harrison and Wang2006) reported higher Chl a concentrations (34.0 µg l−1) in the coastal seas to the south of Hong Kong Island in the transition zone than in Mirs Bay (4.4 µg l−1) in the oceanic zone. However, studies of phytoplankton distribution over Hong Kong's entire coastal sea area are scarce.
Higher Chl a concentrations in the summer than the winter and positive correlation between Chl a concentrations and temperature suggest that phytoplankton growth in the subtropical waters of Hong Kong is triggered by increases in water temperature. The response of phytoplankton to increases in water temperature is probably species-specific (Huertas et al., Reference Huertas, Rouco, Lopez-Rodas and Costas2011). In Hong Kong's coastal seas, algal blooms formed by rapid growth of dinoflagellates are most common in the later winter and early spring when water temperature is increasing (Lam & Ho, Reference Lam and Ho1989). In the temperate North Atlantic Ocean, contribution of small picophytoplankton (<2 µm) to the total phytoplankton biomass increases with temperature (Moran et al., Reference Moran, Lopez-Urrutia, Calvo-Diaz and Li2010).
Phytoplankton in the coastal seas of Hong Kong are dominated by cells >2 µm. Biomass of Chl a from the <2 µm size fraction was low during both summer (0.30 µg l−1) and winter (0.12 µg l−1). This is in agreement with results from previous studies (Ho et al., Reference Ho, Xu, Yin, Jiang, Yuan, He, Anderson, Lee and Harrison2010; Lie et al., Reference Lie, Wong and Wong2013). Small phytoplankton are considered to have a competitive advantage in oligotrophic waters due to their higher surface area/volume ratios for more efficient acquisition of nutrients and light (Raven, Reference Raven1986). It is commonly believed that the contribution to the total phytoplankton biomass by picophytoplankton tends to vary with the trophic status of the water body (Chisholm, Reference Chisholm, Falkowski and Woodhead1992; Agawin et al., Reference Agawin, Duarte and Agusti2000; Bell & Kalff, Reference Bell and Kalff2001). In this study, the low contribution to total Chl a by the <2 µm size fraction suggests that Hong Kong's coastal waters are relatively eutrophic. Moreover, Chl a from the <2 µm size fraction correlated negatively with concentrations of NO3−, PO43− and SiO2, but positively with temperature. It can be argued that the abundance of small cells may be more strongly regulated by temperature rather than nutrient availability.
Ubiquity and high abundance of fucoxanthin suggest that phytoplankton communities in the coastal seas of Hong Kong are dominated by diatoms. Indeed, the widespread occurrence of diatoms in Hong Kong's coastal waters has been reported by various investigators (Yung et al., Reference Yung, Wong, Broom, Ogden, Chan and Leung1997, Reference Yung, Wong, Yau and Qian2001). Chiu et al. (Reference Chiu, Hodgkiss and Chan1994) noted the prevalence of diatoms in terms of both species richness (70%) and cell density (97%) at Tai Tam Bay in the southern part of the transition zone. Dickman et al. (Reference Dickman, Tang and Lai2002) found a clear dominance of diatoms at Lamma and Port Shelter over dinoflagellates in the transition zone.
Dinoflagellates, indicated by the chemotaxonomic marker peridinin, occur sporadically in the estuarine zone, the southern part of the transition zone, and Tolo Harbour in summer, but are scarce in winter. Dinoflagellates are the major causative organisms of algal blooms in Hong Kong's coastal waters (Hodgkiss & Chan, Reference Hodgkiss and Chan1987; Yung et al., Reference Yung, Wong, Broom, Ogden, Chan and Leung1997; Huang et al., Reference Huang, Jian, Song, Huang, Liu, Qian, Yin and Wu2004). Officer & Ryther (Reference Officer and Ryther1980) argued that fluctuations in silicon (Si) availability may control the cycle of alternate dominance by diatoms and flagellates in phytoplankton-based ecosystems, and proposed that phytoplankton communities tend to be flagellate-dominated when Si is limited. Hodgkiss & Chan (Reference Hodgkiss and Chan1987) reported a progressive increase in the dominance of dinoflagellates during the 1980s when Tolo Harbour and Tolo Channel became increasingly eutrophic. Their observation was corroborated by that of Lam & Ho (Reference Lam and Ho1989) who reported a shift in the composition of the phytoplankton from diatoms to dinoflagellates in Tolo Harbour over the period from 1982 to 1985. However, several more recent studies found no evidence of a change in the composition of the phytoplankton community in Tolo Harbour (Yung et al., Reference Yung, Wong, Broom, Ogden, Chan and Leung1997; Wong & Wong, Reference Wong and Wong2004). Lie et al. (Reference Lie, Wong, Lam, Liu and Yung2011) suggested that shifts in N:Si ratios affected the abundance of diatoms in Tolo Harbour, but presented no evidence to show that the effect was strong enough to alter the dominance of diatoms.
Cryptophytes, indicated by the marker pigment alloxanthin, appear at low densities at most stations during both summer and winter. The presence of Cryptomonas spp. in Tolo Harbour has been confirmed previously by microscopic observations (Lam & Ho, Reference Lam and Ho1989) and by the detection of alloxanthin (Yung et al., Reference Yung, Wong, Broom, Ogden, Chan and Leung1997; Wong & Wong, Reference Wong and Wong2004). Cryptomonads, in sizes ranging from 3 to 50 µm, have a tendency to become more abundant when the abundance of other species decreases (Klaveness, Reference Klaveness and Sandgren1988). Yung et al. (Reference Yung, Wong, Broom, Ogden, Chan and Leung1997) found a strong positive correlation between abundance of cryptomonads and nutrient concentrations in Tolo Harbour, which according to Sommer (Reference Sommer1981) may reflect the ability of r-selected small cells to grow faster and take advantage of high nutrient availability. Strong grazing pressure imposed by zooplankton grazers may account for the low abundance of cryptophytes in Hong Kong's coastal waters. Cryptomonads are excellent food items for herbivorous zooplankton because of their unarmoured cells and high proportions of highly unsaturated fatty acids (Dunstan et al., Reference Dunstan, Brown and Volkman2005; Graham et al., Reference Graham, Graham and Wilcox2009). Studies conducted in Tolo Harbour showed that cryptomonads were preferentially grazed by microzooplankton (Lie & Wong, Reference Lie and Wong2010; Liu et al., Reference Liu, Tang and Wong2014) and the marine cladoceran Penilia avirostris (Wong et al., Reference Wong, Liu, Siu and Hwang2006).
Cyanobacteria, indicated by the marker pigment zeaxanthin, appear in all zones during summer, and are particularly common in Tolo Harbour. Several studies have documented the presence of cyanobacteria in Tolo Harbour and other parts of Hong Kong's coastal seas (Hodgkiss & Chan, Reference Hodgkiss and Chan1987; Huang et al., Reference Huang, Jian, Song, Huang, Liu, Qian, Yin and Wu2004; Wong & Wong, Reference Wong and Wong2004). Cyanobacteria can grow in nutrient-depleted waters by converting atmospheric nitrogen into ammonia for assimilation and by consuming suspended organic matter (Stanier & Cohen-Bazire, Reference Stanier and Cohen-Bazire1977; Stewart, Reference Stewart1980). The ability to adjust their buoyancy allows cyanobacteria to stay near the surface and maximize acquisition of light and nutrients in stratified waters (Paerl, Reference Paerl, Whitton and Potts2002). High surface-water temperature enhances stratification of the water column and provides conditions favourable to cyanobacteria (Paerl & Huisman, Reference Paerl and Huisman2008). Certain strains of cyanobacteria can multiply rapidly when experiencing anthropogenic nutrient enrichment, and produce secondary compounds which are harmful to other organisms (Keating, Reference Keating1978; Giussani & Bernardi, Reference Giussani and Bernardi1990; Jochimsen et al., Reference Jochimsen, Carmichael, An, Cardo, Cookson, Holmes, de Cerqueira Antunes, de Melo Filho, Lyra, Barreto, Azevedo and Jarvis1998). While Cyanophyceae accounted for only 2% of the total number of algal blooms recorded in Hong Kong (Lu & Hodgkiss, Reference Lu and Hodgkiss2004), our findings suggest that they are widely distributed in Hong Kong's coastal waters and should be given more attention for better water-quality management.
Phytoplankton in different hydrographic zones
Except for the semi-enclosed Deep Bay and Tolo Harbour, phytoplankton communities in different hydrographic zones cannot be separated based on pigment composition. Specifically, it can be concluded that the phytoplankton communities in the oceanic zone, transition zone and at NM1 and NM3 of the estuarine zone are relatively similar in terms of their pigment composition. The spatial patterns of phytoplankton composition do not correspond with the delineation of the hydrographic zones. While PCA suggests that the principal factors distinguishing the hydrographic zones are turbidity and salinity in summer, and NO3− and PO43− in winter, these factors correlate poorly with the size-fractionated Chl a concentrations. In fact, strong correlations between temperature and the Chl a concentrations from various size fractions point to the presence of the seasonality in phytoplankton abundance in Hong Kong's coastal waters.
The abundance and community composition of phytoplankton can be influenced by many factors. The absence of strong correlations between nutrient concentrations and phytoplankton abundance implies that nutrient availability is not the major factor affecting the distribution pattern of phytoplankton. Many studies have demonstrated that the grazing impact of herbivorous zooplankton can play a major role in shaping the community composition of phytoplankton (Burkill et al., Reference Burkill, Mantoura, Llewellyn and Owens1987; Strom & Welschmeyer, Reference Strom and Welschmeyer1991). Chen et al. (Reference Chen, Liu, Landry, Chen, Sun, Shek, Chen and Harrison2009) found that microzooplankton grazing rates in Hong Kong waters were higher in the west than in the east. They also reported that temperature was the pivotal factor affecting phytoplankton growth rates and microzooplankton grazing rates. Experiments conducted in Tolo Harbour revealed that both mesozooplankton and microzooplankton grazed selectively on particular taxa of phytoplankton (Wong et al., Reference Wong, Liu, Siu and Hwang2006; Lie & Wong, Reference Lie and Wong2010; Liu et al., Reference Liu, Tang and Wong2014), and reasoned that top-down control by planktonic herbivores may influence the community composition and size structure of the phytoplankton. Unfortunately, quantitative information on the grazing impacts of phytoplankton by zooplankton grazers in Hong Kong's coastal seas is still very limited.
Hong Kong's coastal waters are traditionally divided into three hydrographic zones. Our analyses on environmental variables from both summer and winter reveal clear differences between semi-enclosed bays and other water bodies, but provide no justification for separating the transition and oceanic zones. The absence of clear spatial patterns in the abundance and pigment composition of the phytoplankton suggests that the spatial variations in phytoplankton communities do not reflect the delineation of hydrographic zones. There is also no evidence to suggest that phytoplankton abundance and pigment composition are determined by nutrient availability.
ACKNOWLEDGEMENTS
We thank the officers of the Hong Kong Environmental Protection Department and the crew of the scientific vessel ‘Dr. Catherine Lam’ for their generous assistance with sample collection. We are grateful to technicians and students in the Marine Science Laboratory of the Chinese University of Hong Kong for assistance in the laboratory. The manuscript was much improved by valuable comments from Prof. Jefferson Turner and other anonymous reviewers.