I. INTRODUCTION
Cobalt based alloys have been widely used in the field of biomedical applications. Their exceptional mechanical properties and corrosion resistance are valued in orthopedic implants for artificial knee and hip joint Reference Buford and Goswami1 replacements, whereas in dentistry, they are commonly used as substructures for fixed and removable prosthesis. Porcelain-fused-to-metal (PFM) restorations in particular, have been well received in dentistry due to their high strength and low cost which make them an attractive alternative to the traditional high-noble alloy counterpart. Published clinical studies have also shown reasonable performance and survival rates. Reference Pjetursson, Sailer, Zwahlen and Hammerle2–Reference Walton and O'Brien5 However, complications for this alloy do exist and are usually associated with chipping fractures in the porcelain or delamination near the metal-porcelain junction. Reference Pjetursson, Sailer, Zwahlen and Hammerle2–Reference Walton and O'Brien5 These failures are often considered to be associated with the residual stress development within the porcelain during the manufacturing process and have been largely attributed to the mismatch in coefficient of thermal expansion (CTE) between porcelain and metal as well as the rate of cooling. Reference Walton and O'Brien5,Reference Lenz and Kessel6 Conversely, little is known about the alloy substructures and its potential contribution toward these PFM restoration failures.
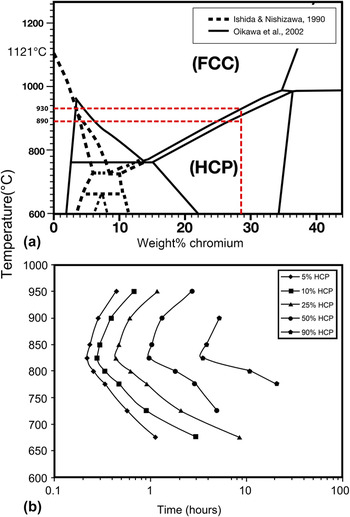
Commercially available dental Co–Cr alloys typically contain between 55–63 wt% cobalt and 25–28 wt% chromium with a melting point of >1490 °C. Reference Ishida and Nishizawa7–Reference Okamoto9 During oxidation, Cr and other elements in base metal alloys have been known to diffuse toward the surface of the alloy Reference Anusavice, Ringle and Fairhurst10 and thus, certain areas of the alloy will have changes in composition. Previous studies have also indicated that Co–Cr alloys consist of a two phase dendritic structure, Reference López and Saldivar-Garcia11,Reference Turrubiates-Estrada, Salinas-Rodriguez and Lopez12 which are face-centered cubic (fcc) and hexagonal close-packed (hcp) [Fig. 1(a)]. Reference López and Saldivar-Garcia11,Reference Matković, Matković and Malina13,Reference Lee, Nomura and Chiba14 Although for Co–Cr alloys the expected thermodynamically stable phase at room temperature is hcp, Reference Ishida and Nishizawa7,Reference Oikawa, Qin, Ikeshoji, Kainuma and Ishida8 this is usually not observed in practice under normal cooling conditions due to the relatively sluggish nature of the fcc to hcp transformation. Reference López and Saldivar-Garcia11 Therefore, Co–Cr alloys usually retain most of their fcc structure in the as cast state. This is beneficial for application of these alloys as the fcc structure fulfills the von Mises criterion in which five independent slip systems are required for enhanced ductility. Reference Lee, Nomura and Chiba14 However, during porcelain sintering temperatures of <900 °C, the fcc–hcp ratio may change significantly due to the repetitive heat treatments within the thermodynamically stable hcp region as indicated in Fig. 1(a). A typical time–temperature transformation (TTT) curve for Co–Cr alloy [Fig. 1(b)] Reference Turrubiates-Estrada, Salinas-Rodriguez and Lopez12 shows that the hcp phase is developed most rapidly at ∼850 °C. Therefore, the rate of heating and cooling as well as the efficiency of heat transfer into the alloy through a layer of low-thermal conductivity porcelain may have a significant role in determining the final phase content of the alloy. To further complicate issues, the sintering temperature of the porcelain firings occurs approximately at the fcc–hcp phase boundary Reference Ishida and Nishizawa7–Reference Okamoto9 as shown in Fig. 1(a). Thus, the final properties of the alloy may also differ depending on the type and the number of porcelain firings performed on the restoration. Therefore, the effect of such heating conditions on the phase stability and mechanical properties is vital for dental applications as well as other applications where high temperature exposure occurs.
(a) Co–Cr equilibrium phase diagram generated by Oikawa et al. Reference Oikawa, Qin, Ikeshoji, Kainuma and Ishida8 and Ishida and Nishizawa. Reference Ishida and Nishizawa7 Red horizontal dotted lines outline the porcelain firing temperature range (890–930 °C) used in this study. (b) A time–temperature–transformation (TTT diagram) for a Co–27Cr–5Mo–0.23C alloy generated by Turrubiates-Estrada et al. Reference Turrubiates-Estrada, Salinas-Rodriguez and Lopez12

The objective of the present study was to identify the effect of multiple firings and alloy thickness has on the microstructure and phase development of Co–Cr alloys for PFM systems.
The hypothesis of this research is that the Co–Cr alloy thickness and repeated firings influence the underlying microstructure developed.
II. MATERIALS AND METHODS
Bi-layered specimens were fabricated using Co–28.6Cr–5.9Mo wt% alloy (LOT: Z104780, dentaNEM, Wieland Pforzheim, Germany) with a CTE of 14.4 × 10⁻⁶ K−1 (25–500 °C) as the core substructure while the veneering porcelain (LOT: 9/10, Wieland Pforzheim, Germany) used had a CTE of 13.1 × 10⁻⁶ K−1 (25–500 °C).
A. Preparation of the substrate material
Square plates of (5) 8.0 mm × 8.0 mm × 0.5 mm and (5) 8.0 mm × 8.0 mm × 1 mm were cut from thermoforming discs (Erkodent, Germany). These plates were held in a muffle made of phosphate-bonded investment for the lost wax procedure and cast with Co–Cr alloy using an induction casting machine (Fornax, BEGO). The investment was preheated to 950 °C prior to casting and the melting point of this alloy is ∼1490 °C. The investment and cast alloy were left to air cool to room temperature before subsequent removal. The plates obtained were separated into their associated thickness (0.5 and 1 mm) and ground with 320 grit size SiC paper to achieve exact dimensions and flat surface finish (SiC paper, Struers, Denmark). Finally, the surfaces were treated with airborne particle abrasion using 110 µm Al2O3 particles.
B. Preparation of the veneering porcelain
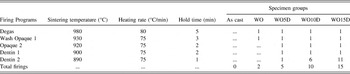
A 1.5 mm layer of veneering porcelain was coated with the assistance of prefabricated templates. Specimens were sintered using manufacturer recommended settings and were treated to an incremental amount of porcelain firings in accordance to their specimen group. A detailed summary of the firing and specimen group specifications is listed in Table I.
Firing specifications and porcelain firing cycles used for each group.

C. Electron backscatter diffraction and energy dispersive spectrometry
Electron backscatter diffraction (EBSD) data were obtained and analyzed in the present study for Co–Cr core substructure before and after an increasing number of porcelain firings. The plates as described above were subsequently sectioned perpendicular to the porcelain surface and sequentially polished to a final <0.05 µm colloidal silica finish to eliminate as much surface damage as possible: an essential process for acquiring high quality EBSD patterns. The specimens were coated with ∼10 nm carbon coating to reduce the effect of charging from the low conductivity porcelain layer. Subsequent EBSD patterns were collected using Oxford Instruments AZtec software (@25 kV, ∼50.4 nA) in a fixed grid of 1600 × 800 analysis points with a 0.2–0.5 µm step size. EBSD data were postprocessed (HKL CHANNEL 5 software) using methods outlined in Prior et al. Reference Prior, Mariani, Wheeler, Schwartz, Kumar, Adams and Field15 and grains were defined as cells surrounded by boundaries with misorientations of 10° or more. Reference Shigematsu, Prior and Wheeler16 Subsequent texture orientation, grain size analysis, and phase maps were also produced. Energy dispersive spectrometry (EDS) was also performed (@10 kV, ∼300 pA) across the bulk and metal-porcelain interface to identify the elemental composition.
D. Modeling the heating–cooling relationship
Newton’s law of heating and cooling was used to estimate the temperatures during heating (575–930 °C) and cooling (930–475 °C) for the 0.5 and 1 mm specimens using the following equation Reference Vollmer17 :
 $$T_{{\rm{spec}}} = T_{{\rm{sur}}} - \left( {T_{{\rm{sur}}} - T_0 } \right)e^{ - rt} \quad ,$$
and cooling as:
 $$T_{{\rm{spec}}} = T_{{\rm{sur}}} + \left( {T_0 - T_{{\rm{sur}}} } \right)e^{ - rt} \quad ,$$
where:
 $$r = {{hA} \over {m{c_{\rm{p}}}}}\quad .$$
T spec is the specimen temperature, T sur is the surrounding temperature, r is the transfer characteristic of the specimens in units S−1, T 0 is the temperature of the specimen after time t in seconds, m is the total mass of the specimen, c p is the specific heat capacity of the specimen (approximated by the mass ratio of the porcelain and metal to account for the difference in heat capacity), h is the heat transfer coefficient of the furnace, and A is the surface area available for heat transfer.
Specific heat capacity c p of ∼470 J/kg K for Co–Cr alloy was obtained from ASTM-F75 while the porcelain c p was found to be Reference Kingery18 ∼1009 J/kg K and the radiation heat transfer coefficient Reference Kingery18 h was 10–50 W/m2K. For simplicity, the radiation heat transfer coefficient is assumed to increase linearly with temperature although the temperature is a T 4 function for radiated thermal energy. This comparison between the two thicknesses is considered to be valid as the heating range is relatively short and the heat transfer rate between the two specimen thicknesses will be similar. The temperature of the metal is also considered uniform because of its relatively high thermal conductivity. Furthermore, the radiative cooling relationship was also modeled using the Stefan–Boltzmann law for comparison where the heat loss by radiation can be found using the formula Reference Levesque19 :
 $${{{\rm{d}}T} \over {{\rm{d}}t}} = - {{\varepsilon \sigma } \over {\rho \tau c}}\left( {{T^4} - T_0^4} \right)\quad .$$
By rearranging the equation and integrating, an analytical solution for T was found and is given by Reference Levesque19 :
 $$- {k_1}t =\; {1 \over {4\mathop {{T_0}}\nolimits^3 }}\left\{ {\ln \left[ {{{\left( {T - {T_0}} \right)\left( {{T_{\rm{i}}} + {T_0}} \right)} \over {\left( {T + {T_0}} \right)\left( {{T_{\rm{i}}} - {T_0}} \right)}}} \right]} \right\} - {1 \over {4\mathop {{T_0}}\nolimits^3 }}{\tan ^{ - 1}}\left( {{T \over {{T_0}}}} \right) + {1 \over {2\mathop {{T_0}}\nolimits^3 }}{\tan ^{ - 1}}\left( {{{{T_{\rm{i}}}} \over {{T_0}}}} \right)\quad ,$$
where k
1 is (εσ/ρτc), T
i is the temperature of the specimen just as it starts to cool, T
0 is the surrounding temperature external to the furnace (∼50°), T is temperature of the specimen, ε is the emissivity of the specimen which is assumed to be 1, σ is Stefan’s constant 5.67 × 10⁻⁸, ρ is the density ratio of the alloy and porcelain by their mass, τ is the thickness of the heated layer, c is the specific heat capacity ratio of the alloy and porcelain as given previously in the convection model. For large temperature differences of T
i > 10T
0, the ratio of
 ${{\left( {{T_{\rm{i}}} + {T_0}} \right)} \over {{T_{\rm{i}}} - {T_0}}}$
is ∼1 and for T > 10T
0, the logarithmic function can be approximated by:
 $$\left\{ {\ln \left[ {{{\left( {T - {T_0}} \right)\left( {{T_{\rm{i}}} + {T_0}} \right)} \over {\left( {T + {T_0}} \right)\left( {{T_{\rm{i}}} - {T_0}} \right)}}} \right]} \right\} \approx \ln \left[ {{{1 - {{{T_0}} \mathord{\left/ {\vphantom {{{T_0}} T}} \right. \kern-\nulldelimiterspace} T}} \over {\left( {1 + {{{T_0}} \mathord{\left/ {\vphantom {{{T_0}} T}} \right. \kern-\nulldelimiterspace} T}} \right)}}} \right]\quad .$$
The arc tan functions for T i > 10T 0 are negligible since they nearly cancel each other out. Therefore, the approximation should hold for the temperatures >500 °C which is the area of interest since the TTT curve indicates peak fcc–hcp transformation rates at ∼850 °C. Reference Turrubiates-Estrada, Salinas-Rodriguez and Lopez12
E. Statistical analysis
Two-tailed t-test with Bonferroni correction was used to verify the statistical significance (p < 0.05) between the grain size and grain depth measurements.
III. RESULTS
A. Bulk analysis
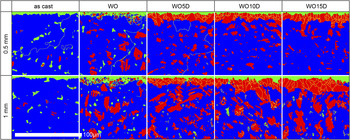
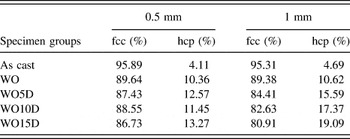
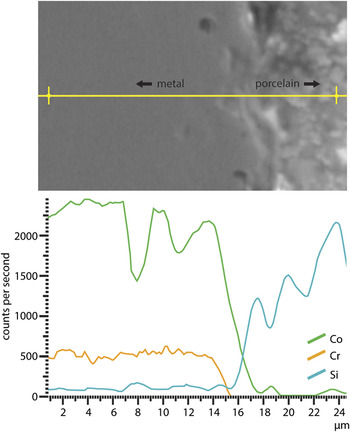
EBSD phase maps each collected from >1500,000 points (Fig. 2) observed a dendritic structure with two phases present within the alloy: fcc and hcp. In the bulk of the alloy, an increase in hcp content (%) was observed for both 0.5 and 1 mm specimens after an increasing number of porcelain firings. A detailed phase analysis (%) of the bulk scanned grid is presented in Table II. Elemental analysis of the bulk of the alloy revealed a composition of Co 61.9%, Cr 26.1%, Mo 5.6%, C 5.1%, Si 0.7%, O 0.4%, and Sr 0.2%. An EDS line scan of the WO5D metal-porcelain interface was also performed as shown in Fig. 3.
EBSD phase map showing the phase development of the bulk and interfacial layer with increasing number of porcelain firings. Blue phase is fcc, red phase is hcp, and green is nonindexed solutions.

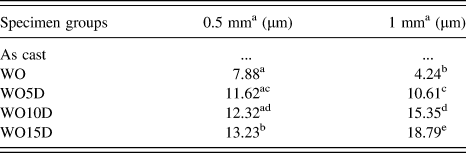
Bulk phase content (%) of the Co–Cr alloy in each specimen group.

EDS line scan of the variation of the elemental composition across the metal-porcelain interface.

B. Surface analysis
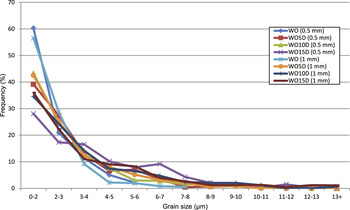
At the cross sectional interface between the metal and porcelain, a fined grained hcp phase was observed for firing cycles of wash opaque and above. This layer was found to develop on all external surfaces of the alloy after firing; irrespective of whether there was a porcelain layer on the alloy surface. Transformed surface layer depth was measured by calculating the mean of 10 intercept points per specimen (Table III) and it was clearly observed that a gradual increase in layer depth occurred with an increasing number of firings. The increase in layer depth was particularly apparent in the 1 mm specimens (4.2–18.8 µm) compared to the 0.5 mm specimens (7.9–13.2 µm). Statistical significance (p < 0.05) of the layer depth data is shown in Table III. Grain size analysis of more than 300 surface grains as shown in Fig. 4 indicated a significant increase in grain size (p < 0.05) for comparisons of WO to WO5D and above with the same alloy thickness. However, no significant differences (p > 0.05) were observed for direct comparisons between alloy thicknesses (0.5 versus 1 mm) of the same specimen group. Bulk microstructure consisted of grains >200 µm. For both depth measurement and grain size analysis, the as cast (surface ground) specimen was excluded as no fine-grained interface developed at that stage.
Grain layer depth measurement of the metal-porcelain interfacial layer.

Statistical analysis was performed for WO to WO15D of the same group and 0.5 versus 1 mm groups.
Transformed surface layer depth measurements containing at least one same superscript was not statistically significant (p > 0.05).
Grain size data of the surface interfacial layer in the 0.5 and 1 mm specimens.

C. Pole figures
The EBSD technique enables the orientation of specific grains and is thus able to generate pole figures. Examples of generated pole figures between the fcc–hcp grains at the interface and bulk are shown in Fig. 5. These pole figures indicate an orientation relationship (OR) between the {111}fcc//{0001}hcp and
 ${\left\{ {110} \right\}_{{\rm{fcc}}}}//{\left\{ {11\bar 20} \right\}_{{\rm{hcp}}}}$
for the bulk portion of the alloy but not for the fcc/hcp phase at the metal-porcelain interface.
Pole figures indicating {111}fcc//{0001}hcp and
 ${\left\{ {110} \right\}_{{\rm{fcc}}}}//{\left\{ {11\bar 20} \right\}_{{\rm{hcp}}}}$
OR for the bulk fcc–hcp intragranular structure of the alloy but none at the surface of the fine-grained hcp–fcc structure.

D. Convection and radiation temperature modeling
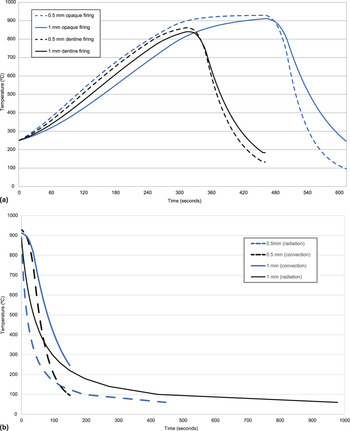
Heating and cooling response through convection was modeled using Newton’s law of heating and cooling for 0.5 and 1 mm specimens as shown in Fig. 6(a). The thinner 0.5 mm specimen was shown to heat and cool more rapidly than the thicker 1 mm specimen. Radiative heat loss, which was calculated using the Stefan–Boltzmann law, [Fig. 6(b)] indicated minor differences compared to the convection model.
(a) Prediction of the temperature–time plots during porcelain firing from Newton’s law and furnace heat transfer conditions showing differences between the thinner and thicker specimens. The dash line is for the 0.5 mm specimens, whereas solid line is for the 1 mm specimens. (b) Prediction of the dentin firing temperature–time plots using Stefan–Boltzmann law with direct comparison of the convection predicted temperature–time model.

IV. DISCUSSION
The present observations of the dendritic-like microstructure found within the bulk of the alloy are consistent with previous studies of Co–Cr alloy of similar composition. Reference López and Saldivar-Garcia11,Reference Matković, Matković and Malina13 EDS analysis of the bulk also revealed a composition which was consistent with the values given by the manufacturer.
For the phase analysis of the bulk, as cast specimens for both 0.5 and 1 mm specimens, consisted of similar ∼4% hcp phase content. However, after WO firing, this percentage rose to 10.4 and 10.6% for both 0.5 and 1 mm specimens, respectively. Overall, the comparison of the bulk phase composition between the specimens (Table II) indicated that the 0.5 mm specimens had less fcc–hcp phase transformation occurring for all firings. This observation relates to the binary Co–Cr phase equilibrium diagram in Fig. 1(a), Reference Ishida and Nishizawa7–Reference Okamoto9 in which porcelain firing temperatures (<900 °C) that the alloy was cycled through was in the thermodynamically stable region of the hcp phase. Therefore, an increase in hcp phase associated with longer exposure within the hcp stable region was anticipated. However, this does not account for the different hcp contents observed between the 0.5 and 1 mm specimens subjected to the same number of firings. To better understand this observation, the thermal history of the specimens during the porcelain firings as well as the associated TTT of the Co–Cr alloy must be understood. The authors are not aware of such a relationship for the current alloy used. However, according to the study of a similar Co–Cr alloy investigated by Turrubiate-Estrada et al., Reference Turrubiates-Estrada, Salinas-Rodriguez and Lopez12 very slow fcc–hcp transformation occurs below 750 °C [Fig. 1(b)]. Above 750 °C, transformation rate increases rapidly until 945 °C with maximum transformation rates found between 800 and 850 °C. For the current study, the thinner (0.5 mm) specimens are expected to heat and cool faster as they have almost the same surface area but half the total mass of the thicker (1 mm) specimens. This result corresponds to the predicted heating–cooling relationship produced through convection and radiation heat transfer as shown in Figs. 6(a) and 6(b). Both figures indicated that the 0.5 mm specimen had a more rapid increase to a slightly higher temperature during the heating stage and faster decrease in temperature during the cooling stages. It can also be seen that the prediction curves for 0.5 and 1 mm specimens failed to reach the targeted temperatures of 890 and 930 °C even after the full duration of hold time. Referring back to the TTT diagram, this faster change in temperature will reduce the time spent in the critical temperature range between 800 and 850 °C for the thinner specimens where the rate of fcc–hcp transformation is highest. This is especially noticeable in the cooling stages of the specimens. A difference of more than a 100 °C between the 0.5 and 1 mm specimen can be observed based on the estimated cooling curve. Therefore, the faster initial cooling and heating rate of the thinner 0.5 mm specimens is the likely reason for the higher fcc retention.
From the examination of the metal-porcelain interface, the presence of a fine-grained surface layer was found to have developed on all specimens that were exposed to the porcelain firing cycles. This observation has not been documented in previous literature. The surface layer depth measurements shown in Table III indicate a progressive increase in depth for both 0.5 and 1 mm specimens associated with the longer time spent as the porcelain sintering temperature increased. Initially, thinner 0.5 mm specimens developed a significantly thicker layer depth (p < 0.05) compared to the 1 mm specimens. However, as sintering time increased, the 0.5 mm specimens showed only a small increase in transformation depth while the 1 mm specimens had a larger and more consistent increase in layer depth. Grain size analysis also noted a significant increase (p < 0.05) in grain sizes for both 0.5 and 1 mm specimens with the increasing number of firings. This indicated the characteristics of typical nucleation and growth mechanisms occurring with longer heat treatment durations. However, unlike the phase content data, no significant (p > 0.05) differences were observed in grain size between the 0.5 and 1 mm specimens for all specimen groups. This was likely due to the existing grains being relatively coarse, which limited the kinetics for further grain growth. Reference Karato20,Reference Tullis and Yund21 However, exposure to more firings did increase the grain size and layer depth, indicating that the growth of the interfacial layer depth was related to the phase stability of the Co–Cr alloy.
In addition to the finer grain sizes developed at the surface, the interfacial layer was also found to be predominantly hcp phase. Analysis of the orientation data as shown in Fig. 5 indicates that an OR exists between the {111}fcc//{0001}hcp and
 ${\left\{ {110} \right\}_{{\rm{fcc}}}}//{\left\{ {11\bar 20} \right\}_{{\rm{hcp}}}}$
in the bulk of the alloy but not between the hcp interfacial layer and the fcc bulk. This OR is typical in fcc–hcp metals due the similarity in atomic arrangement and is commonly known as the Shoji–Nishiyama relationship.
Reference Nishiyama22
Since this OR observed in the bulk is related to the classic lattice rotation dictated (military) fcc–hcp transformation,
Reference Yamanaka, Mori and Chiba23
the lack of the same OR with the interfacial layer suggests that a different process (i.e., civilian or diffusion based transformation) must be associated with the observed fine-grained hcp layer developed. An in situ analysis by Seward et al.
Reference Seward, Celotto, Prior, Wheeler and Pond24
of Ti alloys found that the growth mechanisms of hcp differed depending on the OR and whether the process had a military or civilian component. The key difference between these two associated mechanisms is that military dictated transformation had surface relief characteristics such as tent-like formations to accommodate for the shear strains occurring during phase transformation. Civilian driven transformation, on the other hand, does not have surface relief characteristics. This aspect could not be explored as the surfaces were either coated with porcelain or had an oxide layer limiting direct observation.
As for the preferential hcp phase that developed at the interfacial layer, this may be associated with elemental diffusion of Cr and Co during oxidation, which has been documented by previous studies. Reference Anusavice, Ringle and Fairhurst10,Reference Lautenschlager, Greener and Elkington25 An increase in wt% of Cr would justify the equilibrium shift in favor of the hcp phase. This is supported by the current EDS results (Fig. 3), which observed that Co more readily diffused into the porcelain than Cr. Therefore, a change in Co and Cr concentration ratio at the interface would shift the equilibrium in favor of the hcp stable region i.e., toward the right in the phase diagram shown in Fig. 1(a). Given the current observations that the layer was found to develop irrespective of the porcelain layering, it appears to be clear that the oxidation and diffusional processes are linked to this layer development. Stress-induced recrystallization from the CTE mismatch is unlikely since the interfacial layer also developed on all external surfaces. Additional treatment procedures such as airborne particle abrasion, which is routinely performed to improve the mechanical bonding in PFM restorations, may have also contributed to the recrystallization at the surface. Such treatments introduce high dislocation densities of defects that are accompanied with a substantial amount of strain that may have assisted the initiation of the recrystallization. Further investigation is required to better understand the development of this interfacial layer as well as its impact on the localized properties of the alloy.
An implication of the current findings is that it may have an influence on the adhesion and stress development of metal-porcelain restorations. The limited ductility of the hcp compared with the fcc structure would be expected to result in a more embrittled interfacial layer and thus a reduction of the adhesion with the veneering material. In addition, the finer grains observed at the interface would be anticipated on the basis of the Hall–Petch relationship to increase the hardness at the interface. Most importantly, the present results have demonstrated that the phase content and microstructure of the Co–Cr alloy can be greatly altered by alloy thickness and typical porcelain firing durations. The final fcc to hcp vol% may vary drastically in practice depending on the thickness of the restoration, the temperatures used and the effectiveness of the heat transfer to the restoration. Therefore, the amount of porcelain firings and the thickness of the alloy should be considered and kept to a minimal when manufacturing metal-porcelain restoration. Outside of the purposes of dental restorations, these fluctuations in phase content at heating conditions of relatively short durations may influence other high temperature applications, especially in regards to the interfacial development. Further investigation of the interface utilizing chemical composition analysis will allow better understanding of the existing phase transformation mechanisms.
V. CONCLUSION
Therefore, within the limitations of this study, the following conclusions were drawn:
-
(1) Longer exposure to porcelain firing temperatures resulted in an increased vol% of the hcp phase in both the 0.5 and 1 mm Co–Cr specimens. The thicker 1 mm specimens were found to have more extensive fcc–hcp transformation due to the slower heating and cooling rates as indicated by the heat transfer models.
-
(2) A fine-grained hcp layer developed on all surfaces of the Co–Cr alloy after the WO specimen group. The depth of the layer was found to have developed in relationship with the phase stability of the alloy, which resulted in the 1 mm specimens developing a thicker layer with more porcelain firings.
ACKNOWLEDGMENTS
The authors wish to thank the assistance of Brent Pooley from Geology, University of Otago and Jin Yoo from Faculty of Dentistry, University of Otago for their assistance with some specimen preparation.