I. INTRODUCTION
Most circuits utilize complementary metal–oxide–semiconductor (CMOS) devices which include both p- and n-channel types. Despite the simple structure and fabrication process steps of CMOS devices, the lack of availability of a good oxide/semiconductor system without excessive leakage, oxide charges, and interface traps has delayed significant progress for a long time. The oxide quality improvement over the years has enabled improvements in respect of CMOS device manufacturing.Reference Ng1 The importance of surface and oxide/semiconductor interface quality is increasing as thinner oxide layers are being used in advanced devices.
With scaling of devices, lateral and vertical dimensions of devices have been shrinking steadily over the years. Ultrathin, high-quality gate oxide films, without excessive thermal exposure, are essential for fabricating advanced CMOS devices.Reference Nicollian and Brews2 Low-temperature, high-quality oxidation techniques have been actively investigated in the industry for several decades.Reference Wang, Wen, Bright, Nguyen and Chang3,Reference Hiller, Zierold, Bachmann, Alexe, Yang, Gerlach, Stesmans, Jivanescu, Müller, Vogt, Hilmer, Löper, Künle, Munnik, Nielsch, Zacharias, Brown and Austin4 Establishing proper oxide/silicon (Si) interface characterization techniques has been very important for the development of effective ultrathin oxide layers on Si. Until now, the quality of the gate oxide has been primarily characterized by electrical characteristics of the CMOS devices.
Subtle and unexpected oxide integrity and/or oxide/Si interface quality variations in CMOS device production lines can be detrimental to device yields, reliability and performance. As the oxide film thicknesses get thinner steadily over a period of many years and oxidation temperatures get reduced to lower levels, the control of oxide integrity and/or oxide/Si interface quality has become both urgent and extremely important. To minimize the negative impact on device yields through optimization and routine monitoring of the critical oxidation process, development of an effective and practical noncontact in-line monitoring technique for oxide integrity and oxide/Si interface quality is strongly desired. An optical characterization technique with high spatial resolution would be an ideal candidate.
It is well known that room-temperature interband photoluminescence (PL) of crystalline Si at wave lengths near 1.1 μm is very sensitive to the density of nonradiative bulk and surface defects.Reference Tajima, Ikebe, Ohshita and Ogura5,Reference Schroder6 This makes measurement of the degree of defects at both the oxide/Si interface and in Si bulk by an appropriately designed room-temperature PL (RTPL) system feasible. Monitoring of surface defect formation by RTPL, during oxidation processes and after wet etching, has been reported previously.Reference Konishi, Yao, Tajima, Ohshima, Ito and Hattori7 Promising results from spectroscopic RTPL studies on shallow and ultrashallow implanted junctions providing characterization examples of ion implant damage and defects in the surface and bulk regions, have also been reported.Reference Baek, Kim and Schroder8–Reference Yoo, Ueda, Ishigaki, Kang, Rouh, Kim and Eun12
Raman spectroscopy has been widely used for characterizing crystal quality and stress in the Si crystalline lattice, as a noncontact optical characterization technique. Effects of feature size and types of dielectric films on stress in Si lattice have been investigated.Reference De Wolf13,Reference De Wolf14 In SiO2/Si interface characterization, stress in the Si lattice, beneath the oxide layer, can provide additional information on SiO2/Si interface quality.
In this article, ultrathin oxides on Si wafers, prepared by three different low-temperature formation techniques, were characterized using both multiwave length RTPL and Raman spectroscopy. RTPL characterization of Si wafers with native oxide and high-temperature dry oxide films was done and the results were used as references for comparisons. Raman characterization of Si wafers with low-temperature oxide and native oxide layers were characterized and compared. Key performance parameters of CMOS devices, fabricated using three different low-temperature ultrathin oxide films, were compared with RTPL characterization results. Based on the correlation from key device performance parameters and RTPL characterization results, the feasibility of RTPL and Raman spectroscopy for in-line monitoring of oxide integrity and oxide/Si interface quality, was investigated.
II. EXPERIMENT
Ultrathin (∼1.5 to 2.0 nm thick) oxide films were grown on 300-mm Si (100) wafers using three different low-temperature oxidation techniques, at RT and 350 °C. Table I shows the oxide thickness, oxide preparation technique and oxidation conditions.
Description of wafers and oxidation conditions.

Wafer A was heat-treated at 350 °C for 0.5 min in microwave-excited, remote O2 plasma to avoid potential damage from charged particles emanating from the O2 plasma. As a microwave excitation source, ∼4000 W 2.45 GHz was irradiated to a remotely located O2 plasma cavity. The pressure in the oxidation process chamber and the distance between remote O2 plasma source and process chamber were ∼100 Pa and ∼10 cm, respectively. Neutral oxygen radicals (O*) were delivered to the wafer surface and formed an oxide film at the Si wafer surface. Si is only supplied from the wafer itself. No additional Si source was used.
Wafer B was treated at room temperature for 0.4 min in immersed O2 plasma using a conventional (parallel-plate capacitively coupled) plasma-enhanced chemical vapor deposition (PECVD) system. As a radiofrequency (RF) power source, ∼2000 W of 13.56 MHz was supplied through an impedance matching box. Only O2 gas was supplied and chamber pressure was maintained at ∼10 Pa during the oxidation process.
Wafer C was oxidized at 350 °C for 4 h under 1 atmospheric pressure (atm) steam with N2 carrier gas in a vertical furnace. Up to 100 wafers were simultaneously processed in a batch. One complete cycle including wafer loading, process preparation, temperature ramp up, oxidation, temperature ramp down, wafer unloading can take up to 4 h/batch.
For comparison purposes, Si wafers with an ∼1.3-nm thick native oxide film and a 588-nm thick thermal oxide film, grown at 1100 °C in a single-wafer rapid thermal furnace (SRTF) system (WaferMasters, Inc., San Jose, CA),Reference Yoo, Fukada, Kuribayashi, Kitayama, Takahashi, Enjoji and Sunohara15,Reference Yoo, Fukada, Kuribayashi, Kitayama, Takahashi, Enjoji and Sunohara16 were also prepared as references.
A multiwave length PL system (MPL-300 system, WaferMasters, Inc., San Jose, CA) was used for RTPL measurements. The details of the system and its applications have been published elsewhere.Reference Yoo, Kang, Ueda and Ishigaki17,Reference Trigg, Yu, Cheng, Kumar, Kwong, Ueda, Ishigaki, Kang and Yoo18 RTPL spectra from three Si wafers with low-temperature oxide films, and the two reference Si wafers, were measured in the wave length range of 900 ∼ 1400 nm under 650 and 827 nm focused laser beam excitation. The excitation laser beam spot size was in the range of 50 ∼ 100 μm in diameter. The laser power at the wafer surface was 20 ∼ 50 mW. The RTPL signal was integrated for 20 ∼ 1000 ms per measurement point. RTPL line scans were made in 1 mm intervals and wafer mapping up to 16,645 points (2 mm intervals with 3 mm edge exclusion) were performed.
Multiwave length micro-Raman wafer mapping was done for Si wafers with low-temperature oxide and native oxide layers using a polychromator-based high-resolution Raman system (MRS-300 system, WaferMasters, Inc., San Jose, CA). The details of the polychromator design and Si stress measurement examples can be found in previous reports.Reference Gambino, Vanslette, Webb, Luce, Ueda, Ishigaki, Kang and Yoo19–Reference Theuwissen22 Three excitation wave lengths of 457.9, 488.0, and 514.5 nm were used. The diameter of the focused laser beam was 0.5 ∼ 1.0 μm, depending on the combination of excitation wave length and objective lens. The incident laser power was kept below 10 mW to prevent wafer heating. Measurement repeatability and spectral resolution of the Raman shift after curve fitting were 0.01 and 0.01 cm−1, respectively.
The three low-temperature ultrathin oxide films were integrated in CMOS image sensor devices. Key device performance parameters such as dark current, random telegraph signal (RTS) and the number of white pixels were characterized and compared with RTPL and micro-Raman characterization results. Potential application of the RTPL and micro-Raman characterization techniques in screening, optimization and in-line monitoring of the low-temperature oxidation process step was analyzed.
III. RESULTS AND DISCUSSIONS
A. Low-temperature oxidation
Because the oxidation reaction was limited by Si diffusion from Si substrate through the interface, at a given temperature (350 °C or room temperature), all Si wafers (A, B, and C) have an oxide thickness in the range of 1.5 ∼ 2.0 nm, regardless of low-temperature oxidation techniques, and the wide range of temperature, pressure, and time. The Si supply for oxide formation quickly diminishes after a few atomic layers of oxide formation. The oxide thickness quickly saturates due to the lack of additional unreacted Si. Thus, the thickness of low-temperature oxide films is almost identical to the native oxide thickness of ∼1.3 nm, grown in air at room temperature, regardless of whichever of the three low-temperature oxidation techniques had been used.
B. Room-temperature photoluminescence (RTPL)
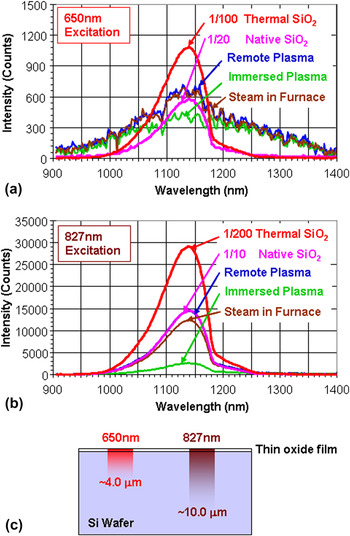
RTPL spectra, under 650 and 827 nm excitations, from the center of three Si wafers with low-temperature oxide films and two reference wafers, were plotted in Figs. 1(a) and 1(b). Very strong RTPL signals were measured from the two reference wafers with native oxide and high-temperature oxide films under both 650 and 827 nm excitations. The typical asymmetric interband RTPL spectra, with a peak wave length at ∼1140 nm, were measured. RTPL spectra of the reference wafers were plotted from 1/20 to 1/200 in magnitude to facilitate comparisons with the Si wafer with low-temperature oxide films. Very weak and broad RTPL spectra, with poor signal-to-noise (S/N) ratio, were measured from the wafers with low-temperature oxide films under 650 nm excitation. Characteristic interband RTPL spectra of Si measured from the two reference wafers were not observed from the three low-temperature oxidation wafers. RTPL signals with reasonable intensity and characteristic interband RTPL signatures were measured from the low-temperature oxidation wafers under 827 nm excitation, however. Excitation wave length and dependence on low-temperature oxidation technique of RTPL intensity and spectra suggest significant variations in oxide integrity and oxide/Si interface characteristics among the low-temperature oxide formation techniques. The probing depth of RTPL depends on the excitation wave length. It deepens as the excitation wave length gets longer because the absorption coefficient gets smaller as the excitation wave length elongates. As illustrated in Fig. 1(c), estimated probing depths for Si, under 650 and 827 nm, are ∼4.0 and 10.0 μm, respectively.Reference Yoo, Ueda, Ishigaki and Kang10–Reference Yoo, Ueda, Ishigaki, Kang, Rouh, Kim and Eun12
RTPL spectra of three Si wafers with different low-temperature thin oxide films under 650 and 827 nm excitation and their RTPL probing depths. RTPL spectra of Si wafers with native oxide and high-temperature thermal oxide (588 nm thick) film are plotted for comparison.

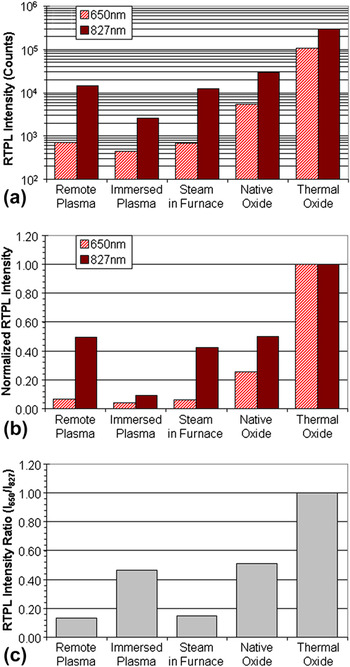
Figure 2 shows, (a) the RTPL intensity, (b) normalized RTPL intensity, and (c) normalized RTPL intensity ratio (I650/I827) of 650 nm excited signal to 827 nm excited signal. The normalization was done to the RTPL signal from wafers with the high-temperature oxidation. For Si wafers with thermal oxide grown at the high temperature (1100 °C), RTPL signals are 10 ∼ 200 times stronger than for Si wafers with a native oxide layer and an oxide layer prepared at low temperatures. Poor oxide film quality and/or poor SiO2/Si interface, significantly weakens the RTPL signal. RTPL signals under shorter excitation wave-lengths, with shallower probing depths [Fig. 1(c)], are more sensitive because the probing volume is strongly influenced by the quality of the oxide film and SiO2/Si interface.
RTPL intensity (a), normalized RTPL intensity (b), and normalized RTPL intensity ratio (I650/I827) (c), of three Si wafers with different low-temperature oxide thin films and two reference Si wafers with native oxide and high-temperature thermal oxide (588 nm thick) films under 650 and 827 nm excitation.

Among three Si wafers with different low-temperature oxide films, Wafer B, with the immersed plasma oxide layer, showed the weakest RTPL signal under both excitation wave lengths. Wafer A, with remote plasma oxide layer, resulted in the highest absolute and normalized RTPL intensities. Generally, oxide films with high SiO2/Si interface quality result in strong RTPL intensity ratio (I650/I827) due to the strong RTPL signal under a shorter excitation wave length having a shallower probing depth as seen from the thermally grown oxide film at high temperature. Normalized RTPL intensity ratio (I650/I827) in Fig. 2(c) shows the highest value (0.45) for the immersed oxidation film (Wafer B) among other low-temperature oxide films. It may be mistakenly interpreted as the sign of lower SiO2/Si interface damage if we only consider the RTPL intensity ratio. By taking the lowest absolute and normalized RTPL intensities for Wafer B, among other low-temperature oxides seen in Figs. 2(a) and 2(b) into account, the low-temperature oxide formed in immersed plasma would be expected to have the worst SiO2/Si interface and Si bulk quality due to damage from the charged particles during the immersed plasma oxidation process. Judging from the excitation wave length dependence of RTPL intensity and its ratio (I650/I827), the low-temperature oxide quality and bulk Si damage can be interpreted in the following order.
 $${\rm{Oxide}}\,{\rm{Quality:}}\,{\rm{Wafer}}\,{\rm{A}}\,{\rm{ > }}\,{\rm{Wafer}}\,{\rm{C}}\,{\rm{ > }}\,{\rm{Wafer}}\,{\rm{B\quad,}}$$
 $${\rm{Si}}\,{\rm{Bulk}}\,{\rm{Damage:}}\,{\rm{Wafer}}\,{\rm{B}}\,{\rm{ > }}\,{\rm{Wafer}}\,{\rm{C}}\,{\rm{ > }}\,{\rm{Wafer}}\,{\rm{A}}{\rm{\quad.}}$$
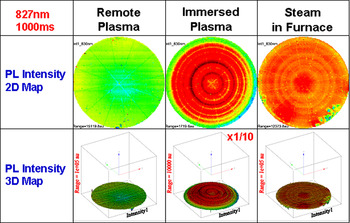
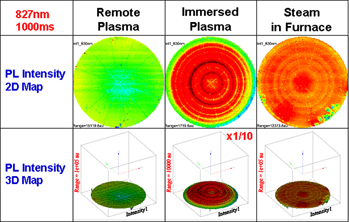
Figures 3(a)–3(c) show 2D and 3D RTPL intensity wafer maps under 827 nm excitation. For RTPL wafer mapping, 15,101 points were measured for each excitation wave length. Wafer A and Wafer C showed reasonably uniform RTPL intensity across the wafer, whereas Wafer B showed a concentric ring-shaped RTPL intensity nonuniformity. The reasonably strong uniform RTPL signals across the wafer under both 650 and 827 nm excitations suggest the remote plasma oxidation at 350 °C (Wafer A) resulted in relatively uniform SiO2/Si interface and Si bulk quality. The immersed plasma oxidation at room temperature in a PECVD system (Wafer B) showed a peculiar RTPL intensity distribution within wafer. Considering the probing depth of 827 nm excitation (∼10 μm from the surface), plasma-induced Si lattice damage is suspected. The radial stripe patterns on 2D RTPL intensity maps are from the wafer stage of the spectroscopic RTPL system. The steam oxidation at 350 °C in a furnace (Wafer C) showed localized RTPL intensity weakening near wafer edge where the quartz boat made contact.
2D and 3D RTPL maps of three Si wafers with different low-temperature oxide thin films under 827 nm excitation.

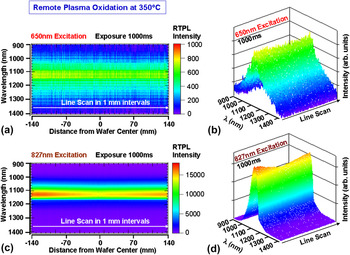
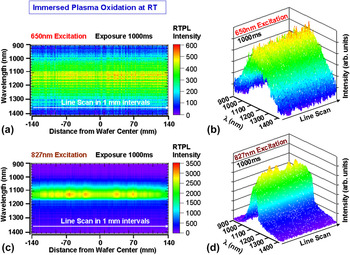
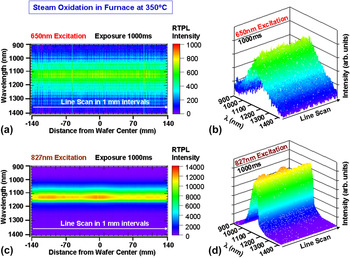
Figures 4–6 show 2D and 3D RTPL line scan results on the three Si wafers with different low-temperature oxide films under 650 and 827 nm excitations. The 281-point line scans were done across the wafers in 1 mm intervals. RTPL spectra measured, under 650 nm excitation, were all weak and broad as compared with the ones measured under 827 nm excitation. This suggests that there are significant densities of carrier trapping sites near the SiO2/Si interface. The 827 nm excited RTPL spectra show specific patterns of nonuniformity across the wafers, depending on the low-temperature oxidation technique. Wafer A [Figs. 4(c) and 4(d)] with remote plasma oxidation showed the minimum RTPL intensity at the center and increased RTPL signal toward the edges. Wafer B [Figs. 5(c) and 5(d)] showed weak RTPL signals at all measurement points, under 827 nm excitation. It also showed a symmetrical RTPL intensity distribution across the wafer. It may represent the RF power distribution due to a standing wave between two parallel plates (a shower head and a susceptor) during immersed plasma oxidation at room temperature. The regions of higher plasma damage at the SiO2/Si interface and Si bulk would emit weaker RTPL (green color). Wafer C [Figs. 6(c) and 6(d)] with steam oxidation layer formed at 350 °C, showed relatively strong RTPL signals. However, the RTPL intensity distribution across the wafer was less symmetrical than for the other two wafers. The asymmetry of RTPL intensity across the wafer is likely from the relative location of contact points of the wafer and a quartz boat used in the batch furnace, as indicated in the RTPL wafer maps (Fig. 3).
RTPL line scan (281 points in 1 mm intervals) spectra across the Si wafer with thin remote plasma oxide films grown at 350 °C under 650 and 827 nm excitation.

RTPL line scan (281 points in 1 mm intervals) spectra across Si wafer with thin immersed plasma oxide film grown at room temperature under 650 and 827 nm excitation.

RTPL line scan (281 points in 1 mm intervals) spectra across Si wafer with thin steam oxide film grown at 350 °C under 650 and 827 nm excitation.

C. High resolution micro-Raman spectroscopy
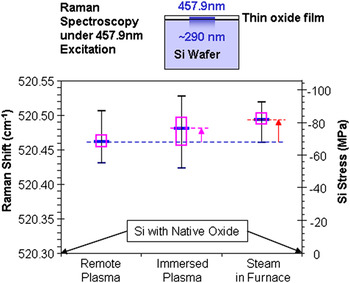
Multiwave length micro-Raman measurements were done on Si wafers with low-temperature oxide and native oxide films with a similar oxide thickness (<2.0 nm). Wafer mapping measurements were made on 207 points per wafer. Three excitation wave lengths of 457.9, 488.0, and 514.5 nm from an Ar+ laser were used as the excitation source. Probing depths of 457.9 nm excitation Raman measurement in Si are approximately 290 nm. It deepens with wave length increase. The probing depths at 488.0 and 514.5 nm are ∼490 and 645 nm, respectively.Reference Yoo, Kang, Ueda and Ishigaki17–Reference Yoo, Ishigaki, Ueda, Kajiwara, Kang, Hung, Ang and Min20 Slight change of Raman shifts between wafers was measured under all excitation wave lengths. Raman shift measured under longer excitation wave lengths (488.0 and 514.5 nm) showed smaller variations due to the weighted average nature of Raman measurement through the probing depths. Since the main purpose of this study is to understand the SiO2/Si interface quality, 457.9 nm excited Raman measurement results are mainly discussed.
Figure 7 shows the probing depth of 457.9 nm excited Raman measurement and box plots of Raman shift measured from three wafers with different low-temperature oxide layers. The average Raman shift values ranged from 520.46 to 520.49 cm−1. Stress-free Si with a native oxide layer shows a Raman shift at 520.30 cm−1. All wafers with low-temperature oxide layers showed 0.16–1.19 cm−1 higher shifts. The Si stress can be calculated using the deviation of the measured Raman shift value from the value from stress-free Si (520.30 cm−1). A positive shift of 1 cm−1 is equivalent to −434.5 MPa of stress.Reference De Wolf13,Reference De Wolf14 The equivalent Si stress values are shown as the second vertical axis. All wafers showed compressive stress. Wafer A, with remote plasma oxidation, showed the lowest average compressive stress of −70.61 MPa. Wafer C, with steam oxidation in a furnace, showed the highest average compressive stress of −84.45 MPa. The Stress variation was the largest in Wafer B. Based on the Raman shift box plot, the Si stress and its variations under the low-temperature oxide quality can be interpreted in the following order.
 $${\rm{Si}}\,{\rm{Stress:}}\,{\rm{Wafer}}\,{\rm{C}}\,{\rm{ > }}\,{\rm{Wafer}}\,{\rm{B}}\,{\rm{ > Wafer A\quad,}}$$
 $${\rm{Si}}\,{\rm{Stress}}\,{\rm{Variations:}}\,{\rm{Wafer}}\,{\rm{B}}\,{\rm{ > }}\,{\rm{Wafer}}\,{\rm{A}}\,{\rm{ > Wafer}}\,{\rm{C}}{\rm{\quad.}}$$
Raman probing depth of 457.9 nm excitation in Si, and box plots of high resolution micro-Raman wafer mapping (207 points per wafer).

D. CMOS image sensor performance
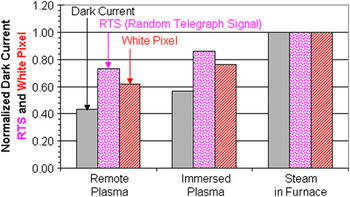
1.75 megapixel CMOS image sensors were fabricated by integrating the three different low-temperature ultrathin oxide films. Key device performance parameters, such as dark current, random telegraph signals (RTS) and a number of white pixels were characterized. Statistics of >10 device wafers from different oxidation techniques were taken. Figure 8 shows a bar graph of normalized average dark current, RTS and the number of white pixels.
Normalized average dark current, RTS (random telegraph signal) and number of white pixels of CMOS image sensor devices fabricated on Si wafers with three different low-temperature oxide layers.

All three key device performance parameters showed very close correlation. Steam oxide grown at 350 °C for ∼2 h in a batch furnace (Wafer C condition) showed the highest values in all three key device performance parameters. The Weibull probability distribution plot showed distorted lines and wide variation between the six device wafers. Up to 5% of chips showed a very high dark current level in addition to the highest average dark current among three low-temperature oxidation conditions. This condition was quickly screened out due to the poor device performance.
The device wafers integrated with remote plasma oxide layers grown at 350 °C (Wafer A condition) showed the lowest values in all three categories of device performance parameters. They also show a steep slope and small variations between wafers in the probability distribution curves.
The device wafers integrated with immersed plasma oxide layers, grown at room temperature (Wafer B condition), show medium values for all three device performance parameters. They showed nonlinear curves in the distribution plots and a large variation between device wafers. Folded curves and a large number of device failures are measured. The average dark current of devices was still high.
The device performance results showed the interface quality in the following order.
 $${\rm{Average}}\,{\rm{SiO}}_{\rm{2}} {\rm{/Si}}\,{\rm{interface}}\,{\rm{quality:}}\,{\rm{Condition}}\,{\rm{A}}\,{\rm{ > }}\,{\rm{Condition}}\,{\rm{B}}\,{\rm{ > }}\,{\rm{Condition}}\,{\rm{C\quad,}}$$
 $${\rm{Uniformity}}\,{\rm{of}}\,{\rm{SiO}}_{\rm{2}} {\rm{/Si}}\,{\rm{interface}}\,{\rm{quality:}}\,{\rm{Condition}}\,{\rm{A}}\,{\rm{ > }}\,{\rm{Condition}}\,{\rm{B}}\quad{\rm{.}}$$
The average SiO2/Si interface quality coincides with the Si stress results measured by micro-Raman spectroscopy. Wafer C condition was excluded for comparison of SiO2/Si interface quality uniformity due to an abnormal probability distribution. Both RTPL and micro-Raman characterization of blanket low-temperature oxide films on Si wafers showed good agreement with the device performance variations.
E. Discussions
Dark current is one of the main sources for noise in image sensors such as charge-coupled devices (CCDs) and CMOS image sensors.Reference Bigas, Cabruja, Forest and Salvi21,Reference Theuwissen22 It is the relatively small electric current that flows through photosensitive devices, even when no photons are entering the device. The dark current is due to the random generation of electrons and holes within the depletion region of the image sensor device. The electrons and holes are then swept by the high electric field across the depletion layer. The electron and hole generation rate is related to specific crystallographic defects, deep level traps and/or metal contaminations in the depletion region. Dark current spectroscopy (DCS) is often used to determine the presence of defects in finished image sensor devices by monitoring the temperature-dependence of peaks in the dark current histograms under different light illumination conditions.Reference McColgin, Lavine and Stancampiano23–Reference Webster, Nicol, Grant and Renshaw26
The pattern of different dark currents can result in fixed-pattern noise. Dark frame subtraction can remove an estimate of the mean fixed pattern, but temporal noise cannot be effectively removed due to its random occurrence. The temporal noise is often referred to as impulse noise or random telegraph signal (RTS) noise.Reference Hung, Ko, Hu and Cheng27–Reference Realov and Shepard29 No single source of RTS noise can explain all occurrences. The most commonly believed cause is the random trapping and release of charge carriers at thin film and Si interfaces or at defect sites in bulk Si. These defects can be caused by heavy ion implantation, random dopant fluctuations at small geometries, or surface contamination during manufacturing processes.
In an early study reported by McColgin, as few as three cobalt (Co) or nickel (Ni) traps in a pixel can produce a white spot, or dim point defect, that can affect device performance or yield of CCD image sensors.Reference McColgin, Lavine and Stancampiano23,Reference McColgin, Lavine and Stancampiano24 The DCS technique has validated, on a per-pixel basis by temperature dependence, a study using a three megapixel CMOS image sensor intentionally contaminated with molybdenum (Mo).Reference Webster, Nicol, Grant and Renshaw26
It is not surprising to see the close correlation among dark current, RTS frequency and white pixel frequency in finished CMOS image sensors, as seen in Fig. 8. DCS and device performance tests using finished CMOS image sensor devices are essential to understand and identify the possible source of problems.
Metal contamination, interface traps and specific crystallographic defects are considered to be major sources of dark current and/or white pixels in image sensor devices.Reference Webster, Nicol, Grant and Renshaw25–Reference Tega, Miki, Pagette, Frank, Ray, Rooks, Haensch and Torii28 In addition to the factors listed, random dopant fluctuation is suspected as a possible source of RTS noise. Since RTPL is sensitive to the charge generation and recombination in Si, it can be a very effective technique for screening potential noise problems in CMOS image sensor fabrication processes before electrode formation for DCS characterization and/or device performance tests. Raman spectroscopy with a shallower probing depth using a shorter [near ultraviolet (UV) or UV] excitation wave length, would be ideal for detecting Si stress changes and crystallographic defects near the SiO2/Si interface and depletion layer. Optimal RTPL intensity under various excitation wave lengths and appropriate levels of Si lattice stress measurement by micro-Raman spectroscopy can be used as very effective quality control parameters for the low-temperature oxidation process and the SiO2/Si interface control. The combination of multiwave length RTPL and micro-Raman spectroscopy is very promising as noncontact, in-line process screening, monitoring and optimization technique.
IV. SUMMARY
Multiwave length RTPL and micro-Raman measurements were performed on ultrathin low-temperature oxide films on Si wafers used in CMOS image sensor fabrication steps. Three types of low-temperature (350 °C or room-temperature) oxide films on Si, grown by different techniques, were measured.
The RTPL measurement results were compared with Si wafers with native oxide and high-temperature thermally grown oxide films. Significant RTPL spectra and intensity variations were observed among low-temperature oxide films. Very strong excitation wave length dependence of RTPL spectra and intensity was observed from the low-temperature oxide films on Si. The RTPL spectra and intensity from Si, with native oxide and thermally grown oxide films, are consistently strong under different excitation wave lengths. Multiwave length micro-Raman spectroscopy revealed that there is noticeable difference of stress in the Si lattice under different low-temperature oxide layers, depending on oxidation technique.
Key device performance parameters of CMOS image sensor devices fabricated using three low-temperature oxide films were compared with the RTPL and Raman measurement results. The RTPL spectra and Raman shift showed good correlation with the key device performance parameters. The RTPL characterization results reflect the quality of the SiO2/Si interface and correlates with electrical properties of devices fabricated on the same structures. They are very sensitive to the quality of the oxide/Si interface. The spectroscopic methodologies described in this article indicate they are suitable for use as valuable SiO2/Si interface quality monitoring techniques in CMOS image sensor device fabrication processes.