I. INTRODUCTION
Insufficient mobility of charge carriers is a drawback of organic semiconductor devices compared to their inorganic counterparts. Organic semiconductors consist of π-conjugated molecules weakly bonded to each other by van der Waals interactions, and thus electrons tend to be confined in molecular orbitals belonging to individual molecules. Efficient overlap of molecular orbitals between adjacent molecules is required for improved charge carrier mobility in organic devices. In this context, pentacene [C22H14, Fig. 1(a)] is regarded as a good model material for exploring conduction mechanisms in molecular solids because organic field-effect transistor (FET) devices exceeding charge carrier mobility of 1 cm2/(V s) were first achieved with thin-films of this material.Reference Lin, Gundlach, Nelson and Jackson1 A mobility over 10 cm2/(V s) was reported for the single crystal of this molecule.Reference Jurchescu, Baas and Palstra2
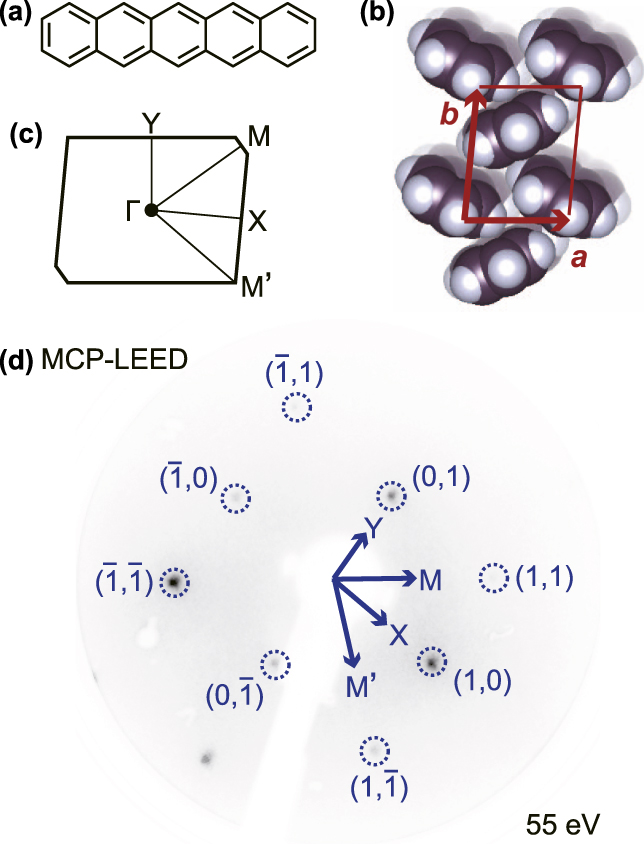
(a) Molecular structure of pentacene. (b) Molecular arrangement of the Pn-SC(001) surface. The surface unit cell is also shown. (c) SBZ of Pn-SC(001) surface. (d) MCP-LEED pattern of Pn-SC(001) surface (electron energy of 55 eV). Azimuthal orientations for ARUPS measurements toward four symmetry points of Pn-SC SBZ are also indicated.

Charge carrier transport behaviors in semiconductor materials are dominated by characteristics of their highest-occupied and lowest-unoccupied electronic states, i.e., structures of valence and conduction bands, respectively. Since pentacene is generally used as a p-type organic semiconductor, the electronic properties of its highest occupied molecular orbital (HOMO) or valence band(s) have been of particular interest. Theoretical studies on several solid-state polymorphs of this material have predicted effective intermolecular coupling between HOMOs of adjacent pentacene molecules and the formation of valence bands with notable energy dispersion widths of a few hundred meV.Reference Cheng, Silbey, da Silva Filho, Calbert, Cornil and Brédas3–Reference Yoshida and Sato7 Occurrence of energy–momentum (E–K) dispersion of valence bands was confirmed by ultraviolet photoelectron spectroscopy (UPS) in crystalline thin-film samples of pentacene.Reference Koch, Vollmer, Salzmann, Nickel, Weiss and Rabe8–Reference Hatch, Huber and Höchst12 This method successfully unveiled the valence band structures of pentacene thin-films but is not directly applicable to single crystal pentacene. The existence of valence band dispersion was recently resolved experimentally by overcoming a technical problem being recognized as “sample charging”.Reference Nakayama, Mizuno, Hikasa, Yamamoto, Matsunami, Ideta, Tanaka, Ishii and Ueno13 Problems still remained. That work examined the valance band dispersion only in one specific direction and therefore two-dimensional characters (e.g., anisotropyReference Lee, Roth and Park14) of transport could not be accounted for. Furthermore, the pentacene single crystal (Pn-SC) samples used in the previous work were not clean, but the surface contained a few percent of oxidized species (assignable to pentacene hydroxide), which were inevitably generated due to exposure to the ambient atmosphere.Reference Nakayama, Uragami, Yamamoto, Yonezawa, Mase, Kera, Ishii and Ueno15,Reference Mizuno, Yamamoto, Kinjo, Mase, Ishii, Okudaira, Yoshida and Nakayama16
For the sake of resolving the above questions, Pn-SC samples that were not exposed to ambient atmosphere were prepared, and the valence band structures of these unexposed Pn-SCs were investigated by means of angle-resolved UPS (ARUPS). The abundances of oxide impurities on the surfaces of these Pn-SC samples were also examined by X-ray photoelectron spectroscopy (XPS). E–K dispersion relationships of the valence bands were clearly resolved on Pn-SC samples with reduced surface oxide abundance, and the anisotropic characters of intermolecular coupling strength (transfer integral t) and effective mass of holes (m h*) at the valence band maximum (VBM) were elucidated based on ARUPS results.
II. EXPERIMENT
Quasi-parallelogram shaped Pn-SC pieces (typically, several mm square) were produced by a horizontal physical vapor transport technique in a purified N2 stream and transferred directly to a N2-filled glovebox without exposure to ambient atmosphere. Each crystal piece was placed on a Au-coated Si wafer and anchored by conductive Ag glue to ensure good electric contact for photoemission measurements. The Pn-SC samples were then enclosed in an air-tight container with deoxidizing and dehydrating agents for transfer to outside equipment. Introduction of samples to ultra-high vacuum systems for photoemission measurements was carried out via a plastic bag with gloves (so-called “glovebag”) filled with N2. It should be noted that the Pn-SC samples presumably came in contact with residual air in the glovebag in spite of efforts to keep the sample surfaces clean. After initial XPS or ARUPS measurements, the Pn-SC samples were subsequently exposed to ambient air for one hour followed by another series of XPS and ARUPS measurements to identify the influences of exposure to air on Pn-SC.
XPS measurements were conducted at undulator beamline BL-13B of Photon Factory, KEK, using an SES-200 analyzer (Gammadeta Scienta, Uppsala, Sweden).Reference Toyoshima, Kikuchi, Tanaka, Mase, Amemiya and Ozawa17 To minimize sample charging after photoelectron ejection and possible damage to the Pn-SC samples by X-ray irradiation, the incident photon flux was intentionally reduced as reported previously.Reference Nakayama, Uragami, Yamamoto, Yonezawa, Mase, Kera, Ishii and Ueno15 The excitation photon energy was set at 0.67, 0.82, 1.12, and 1.42 keV, which was calibrated by the Au4f 7/2 peak position (binding energy of 83.95 eVReference Seah, Gilmore and Beamson18). The photon flux was measured using a Si photodiode (AXUV, IRD Inc., Torrance, CA). ARUPS was measured with an in-house system at IMS, which was equipped with an electron spectrometer (MBS, A-1) and monochromatized rare-gas discharge lamp. In this study, Xe-Iα (hν = 8.44 eV) was chosen as excitation light source for relatively surface insensitive measurements.Reference Nakayama, Mizuno, Hikasa, Yamamoto, Matsunami, Ideta, Tanaka, Ishii and Ueno13,Reference Ozawa, Nakayama, Machida, Kinjo and Ishii19 The surfaces of platelike Pn-SCs (present samples) are known to be c*-oriented.Reference Nakayama, Mizuno, Hikasa, Yamamoto, Matsunami, Ideta, Tanaka, Ishii and Ueno13,Reference Jo and Takenaga20 Based on the reported crystallographic structure of Pn-SC at 293 K (a = 0.6266 nm, b = 0.7775 nm, c = 1.453 nm, α = 76.475°, β = 87.682°, γ = 84.684°Reference Mattheus, Dros, Baas, Meetsma, de Boer and Palstra21), the molecular arrangement of the bulk-truncated surface and the structure of the surface Brillouin zone (SBZ) of Pn-SC are illustrated in Figs. 1(b) and 1(c), respectively. The relationship between the reciprocal lattice and the real space molecular arrangement is indicated in Supplementary Material Fig. S1. The azimuthal direction for ARUPS measurements was accurately determined based on low-energy electron diffraction (LEED) patterns amplified with a microchannel plate (MCP),Reference Xin, Duhm, Bussolotti, Akaike, Kubozono, Aoki, Kosugi, Kera and Ueno22 as shown in Fig. 1(d). All XPS, ARUPS, and MCP-LEED measurements were conducted under the illumination of continuous-wave laser light (hν = 3.06 eV, 30 mWReference Machida, Nakayama, Duhm, Xin, Funakoshi, Ogawa, Kera, Ueno and Ishii23,Reference Nakayama, Uragami, Yamamoto, Machida, Kinjo, Mase, Koswattage and Ishii24 ) at room temperature.
III. RESULTS
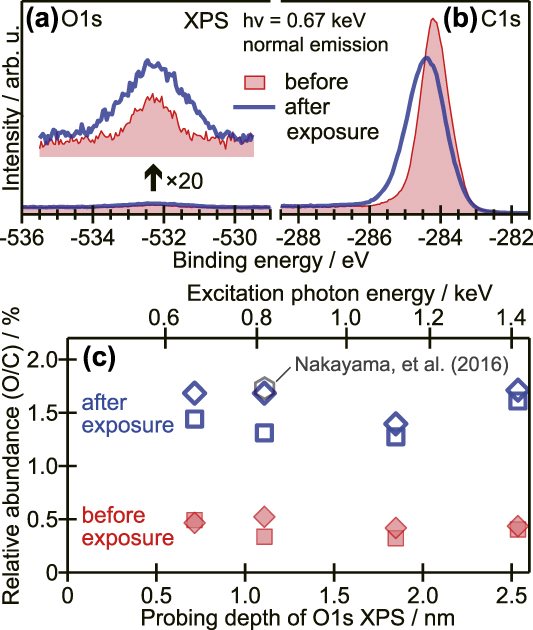
O1s and C1s XPS spectra of a Pn-SC sample before and after exposure to ambient air are presented in Figs. 2(a) and 2(b), respectively. Although the intensity of the O1s photoemission was much weaker than that of the C1s peak in each sample, the existence of oxygen even in the unexposed Pn-SC sample and the growth of the O1s peak after ambient exposure are clearly recognized in Fig. 2(a). While the C1s peak intensity was nearly unchanged, the peak exhibited apparent broadening and shifting to the deeper binding energy (BE) side after exposure, as can be seen in Fig. 2(b). These results indicated that ambient exposure promoted the oxidation of Pn-SC, which withdrew electrons from pentacene molecules and also increased the sample inhomogeneity.
(a) and (b) O1s and C1s XPS spectra, respectively, of Pn-SC before and after exposure to air. Magnified spectra of O1s XPS are represented in the inset of (a). (c) Relative abundance of oxygen with respect to carbon plotted as a function of photoelectron probing depth of O1s at each photon energy. The orientation of marks (squares and diamonds) represents individual Pn-SC samples, and open and filled symbols indicate the results for each sample before and after exposure to air, respectively. A hexagonal mark shows the previous result.Reference Nakayama, Uragami, Yamamoto, Yonezawa, Mase, Kera, Ishii and Ueno15
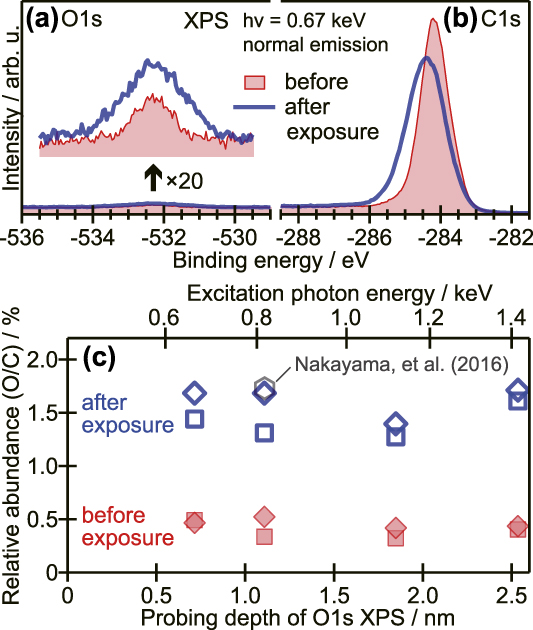
Peak intensities of the respective XPS spectra provide information on stoichiometry near the sample surface. In addition, since the inelastic mean free path of photoelectrons inside a solid varies depending on its kinetic energy,Reference Seah and Dench25,Reference Tanuma, Powell and Penn26 the probing depth of XPS measurements for the target element can be regulated by changing the excitation X-ray energy. The photoionization cross section of each atomic subshell also depends on the photon energy.Reference Yeh and Lindau27 The depth dependence of the relative oxygen abundance with respect to carbon (O/C) was thus evaluated based on excitation energy dependences of the O1s and C1s XPS results,Reference Yamanaka, Hayakawa, Cojocaru, Tsuruta, Sato, Mase, Uchida and Nakayama28 plotted as a function of the IMPF of the O1s peak in Fig. 2(c). The relative abundance of oxygen compared to carbon in Pn-SC samples after ambient exposure was around 1.5%. This was consistent with the previous report for Pn-SC samples exposed to ambient conditions after production.Reference Nakayama, Uragami, Yamamoto, Yonezawa, Mase, Kera, Ishii and Ueno15 By contrast, the oxygen abundances in unexposed Pn-SCs were reduced by a factor of three to five. This indicated that the present procedures were efficient for keeping the Pn-SC surface clean. In both the exposed and unexposed cases, oxygen abundances did not exhibit any clear dependence on the probing depth up to 2.5 nm, as can be seen in Fig. 2(c). This suggested that the oxidation of Pn-SC by ambient exposure was not limited to the molecular layer closest to the surface but proceeded deeper into the second layer, taking into account the interlayer distance of Pn-SC (1.41 nmReference Mattheus, Dros, Baas, Meetsma, de Boer and Palstra21).
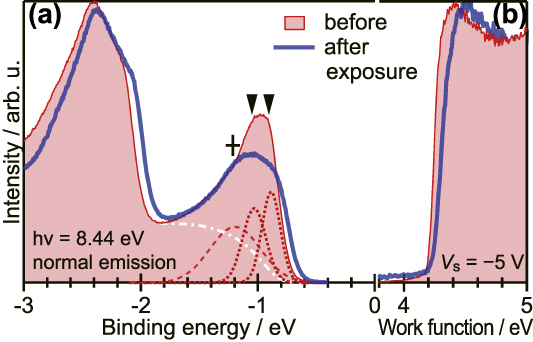
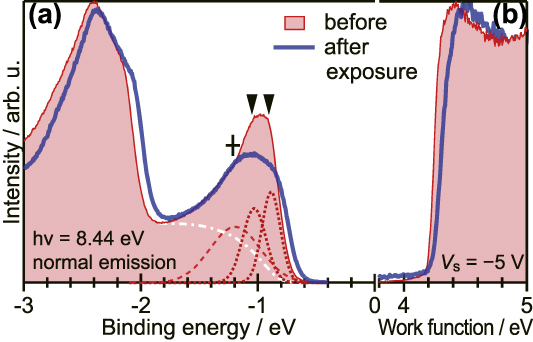
Figure 3(a) shows the normal emission UPS spectrum of a Pn-SC sample before and after exposure to air. For the unexposed sample, a peak derived from the HOMO (BE ∼ −1 eV) could be separated into two components as indicated by dotted curves. There are two inequivalent pentacene molecules in a unit cell of Pn-SC, and accordingly, the HOMO of pentacene develops two valence bands. These two spectral components are therefore attributed to the valence bands of the Pn-SC. An additional broad component (+mark) at the deep BE side of the twin valence bands may be ascribed to electrons having experienced inelastic scattering due to impurities, as discussed later.Reference Nakayama, Mizuno, Hikasa, Yamamoto, Matsunami, Ideta, Tanaka, Ishii and Ueno13 Exposure to air caused broadening of the spectral profile corresponding to the valence bands and shifted the right onset of the valence band peak toward the Fermi level (E F) by 0.08 eV. Meanwhile, the cutoff energy of the secondary electron emission—which corresponds to the work function (i.e., vacuum level position) of the specimen—also revealed a small shift to the right after ambient exposure, as can be seen in Fig. 3(b). This indicated that the vacuum level position of Pn-SC was pushed up by a surface electric double layer of surface-negative charges formed due to the attachment of electrophilic oxygen to pentacene molecules on the surface. In other words, we assume hole doping of the Pn-SC by surface oxides, which brought the upper edge of the valence bands closer to E F, as observed. However, decline in the slope of the secondary electron emission implied that the adsorption of oxygen was not uniform over the whole Pn-SC sample. The surface potential became inhomogeneous after exposure to air, which may explain the broadening of the valence band peak. This comparison shows that the unexposed Pn-SC samples, if not perfectly free from impurities, allowed for the resolution of the valence band structures more clearly than previous studies.
(a) Normal emission UPS spectra of the Pn-SC sample before and after exposure to air. For the unexposed sample, the least-square fit curves attributed to two valence bands of Pn-SC and scattered photoelectrons are displayed as dotted and dashed lines, respectively, where an assumed background is shown as the white dashed-dotted curve. Peak positions are indicated as downward wedge marks and a cross mark. (b) UPS spectra in the secondary electron cut-off region indicating the work functions of samples. The vertical scale of (b) is normalized by the maximum height of each curve.
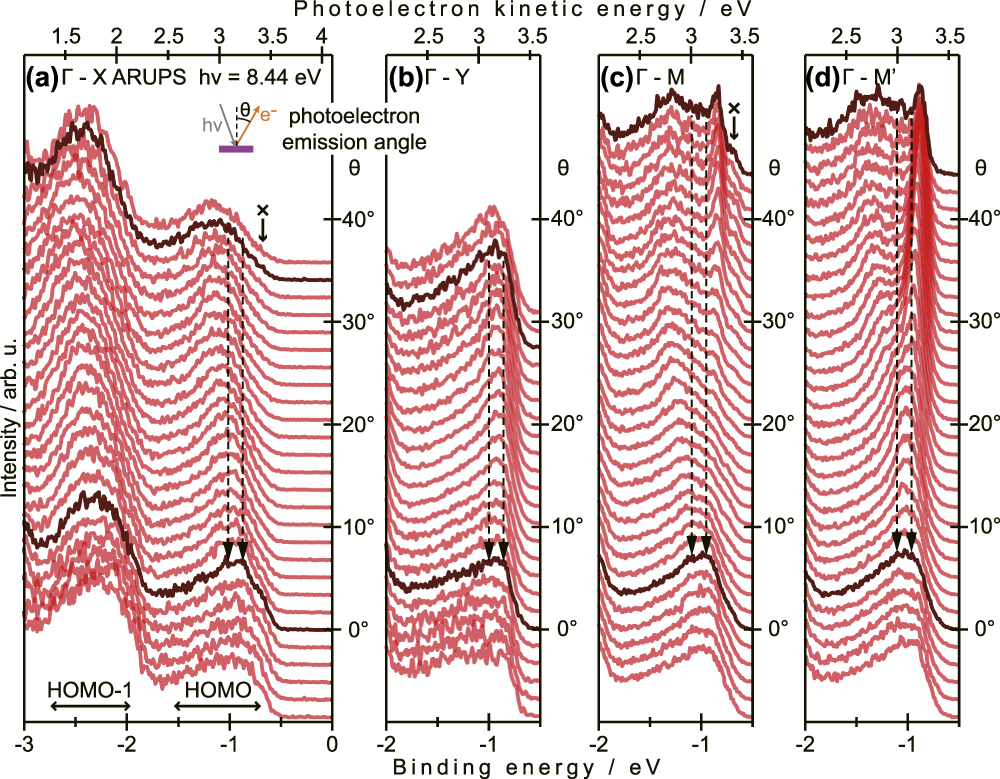
Figures 4(a)–4(d) show ARUPS spectra of unexposed Pn-SC taken at four azimuthal angles corresponding to the four symmetry directions of SBZ. The measurement directions in the real space are illustrated in Fig. S1. In the present experiments, the ARUPS data in the Γ–X direction [Fig. 4(a)] were collected after measurements in the Γ–Y direction [Fig. 4(b)] on an identical Pn-SC sample, while the data in the Γ–M direction [Fig. 4(c)] were obtained on another sample after the measurements in the Γ–M′ direction [Fig. 4(d)]. In all graphs, an individual spectrum at each photoelectron emission (polar) angle θ is vertically offset by the respective θ (right axis), and the spectra approximately corresponding to the center (Γ point) and boundaries (X, Y, M, or M′ point) of SBZ are highlighted in dark color. In the Γ–X direction, the valence band components exhibited a continuous shift to the deeper BE side when approaching the SBZ boundary, as can be seen in Fig. 4(a). This indicated that the two valence bands dispersed farther away from E F as moving from Γ to X. On the other hand, the peak position did not show any apparent shift in the Γ–Y direction [Fig. 4(b)], which meant small energy dispersion widths, if any, of the valence bands in this direction. For both Γ–M and Γ–M′ directions, the energy splitting of the two valence bands was wider at the SBZ boundaries than that at the Γ point; namely, one of the two valence bands dispersed to the shallower BE side toward E F when moving from the Γ point to either the M or M′ point. An additional component [indicated as × marks in Figs. 4(a) and 4(c)] appearing on the shallower BE side of the main peak of the valence bands was not assigned to any intrinsic states of Pn-SC but to secondary factor(s) induced by irradiation damage of the sample because it became significant as the measurements were repeated (Supplementary Material Fig. S2).
ARUPS spectra of Pn-SC in (a) Γ–X, (b) Γ–Y, (c) Γ–M, and (d) Γ–M′ directions. Each spectrum is vertically offset by the photoelectron emission angle. The bottom axes are in the BE scale with respect to E F, while the measured photoelectron kinetic energies are also displayed as top axes. Dashed arrows indicate the energy positions of two valence band components at the Γ point.
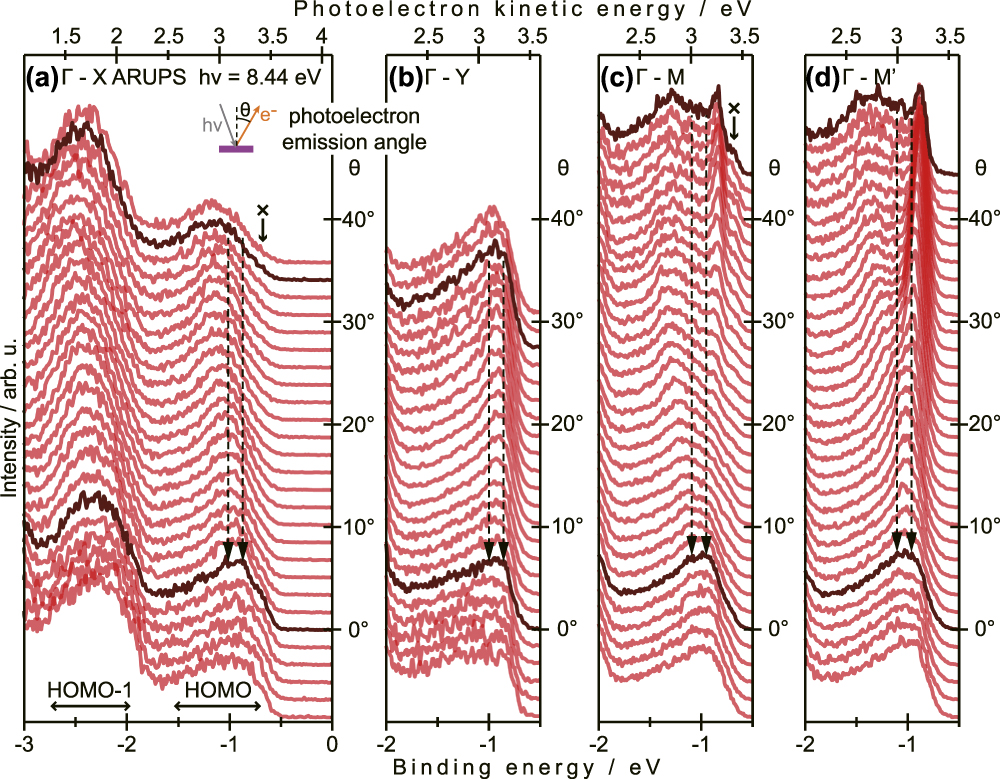
Trends of valence band dispersion unveiled in Fig. 4 indicate that the VBM of Pn-SC at which conductive holes are induced is not located at the X, Y, or Γ point. Since electronic coupling of pentacene molecules to the surface normal direction is not efficient, the energy dispersion in the Γ–Z direction (c* direction) should be negligible, which was actually predicted theoretically.Reference Yoshida and Sato7,Reference Haddon, Chi, Itkis, Anthony, Eaton, Siegrist, Mattheus and Palstra29 Therefore, to characterize the transport behavior of Pn-SC, the valence band structures in Γ–M and Γ–M′ directions are analyzed below.
The surface parallel components of the electron momentum were conserved throughout the photoemission events, and thus the electron wave number parallel to the surface K ‖ can be retrieved from the photoelectron kinetic energy E k and emission angle θ as
 $${K_{\parallel} } = {{\sqrt {2{m_0}{E_{\rm{k}}}} } \over \hbar }\sin \theta = 5.12\sqrt {{E_{\rm{k}}}} \sin \theta \quad ,$$
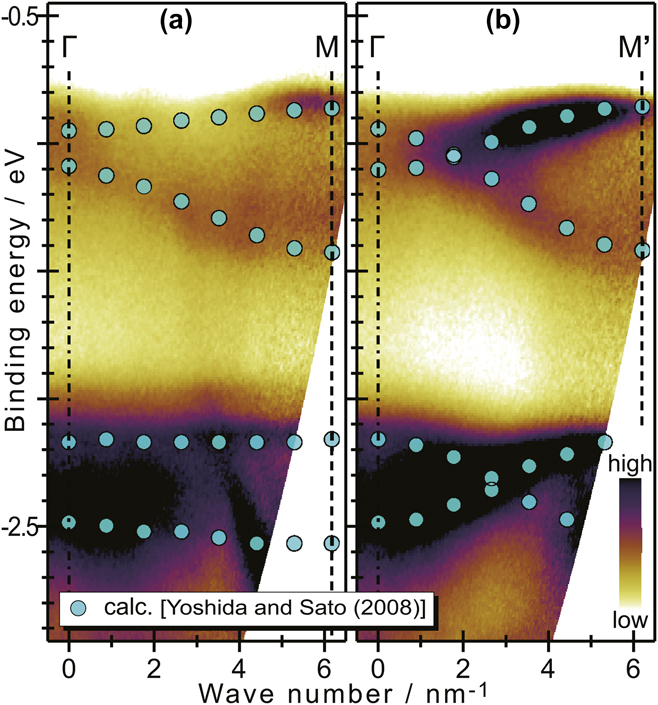
where m 0 is the electron rest mass, and the units of K ‖ and E k are nm−1 and eV, respectively, for the right side of this equation. Using Eq. (1), the ARUPS spectra measured in the Γ–M and Γ–M′ directions are replotted in the E–K ‖ plane, as shown in Figs. 5(a) and 5(b), respectively. The band structures calculated by Yoshida and SatoReference Yoshida and Sato7 are also plotted on these graphs for comparison, while the energy (vertical) scales are arbitrarily shifted and are extended by 16.3% to meet the experimental valence band dispersions. The present experimental results qualitatively reproduced the theoretical prediction excellently in terms of trends of E–K ‖ dispersion relations in both Γ–M and Γ–M′ directions and ratio of dispersion widths to energy gap between the HOMO-derived valence bands and HOMO-1 bands.
(a) Γ–M and (b) Γ–M′ ARUPS spectral images mapped on the E–K ‖ plane. The band calculation results,Reference Yoshida and Sato7 the energy scales of which are extended by 16.3% with respect to those of the experimental spectra (left axis), are also plotted as circle marks on the images.

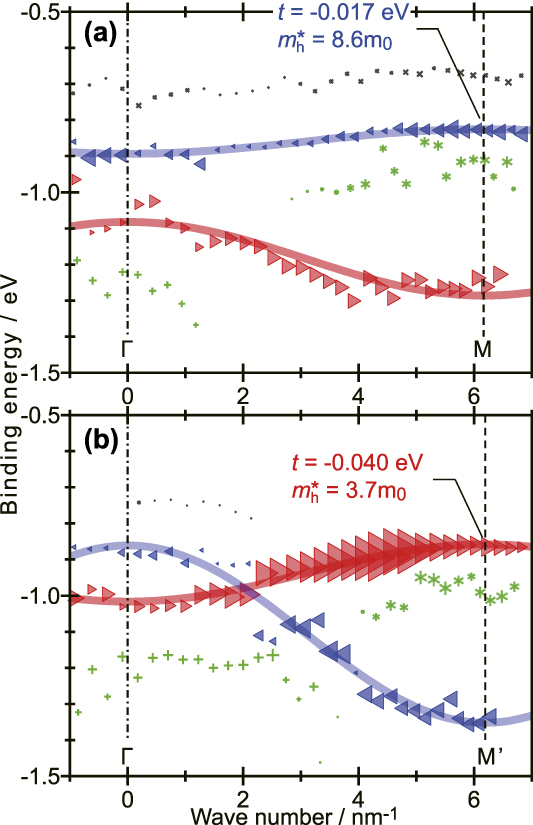
The HOMO-derived valence band region (BE = −2 to −0.5 eV) of individual ARUPS spectra for electron emission angles at every 0.35° were separated into four components by least-squares fitting, and the energy position of each component is mapped as a function of corresponding K ‖ in Figs. 6(a) and 6(b) in the Γ–M and Γ–M′ directions, respectively. A small component of the shallowest BE (× marks) was ascribed to the irradiation damage of Pn-SC samples, as mentioned previously, and thus is excluded from further discussion. The intense two components (marked with leftward and rightward triangles) of the other three were attributed to the two valence bands split by 0.12 (±0.01) eV at the Γ point. Possible origins of the third component (+ or * marks) are discussed later. In the two valence bands, the shallower one at the Γ point (H-band) dispersed upward to E F while going to the M point, and it appeared close to E F at the boundary of SBZ. By contrast, in the Γ–M′ direction, the deeper one at the Γ point (L-band) moved upward to approach E F at the boundary, whereas the H-band dispersed in the opposite direction: namely, the two valence bands intersected each other, as can be seen in Fig. 6(b). No significant differences in energy position were found between the H-band at the M point and the L-band at the M′ point. This means that conductive holes of Pn-SC are located at the M and M′ points.
BE positions of the spectral components of ARUPS spectra taken in the (a) Γ–M and (b) Γ–M′ directions plotted as a function of the electron wave number parallel to the surface. The components attributed to the two valence bands (H band and L band) are indicated as triangle marks (leftward and rightward, respectively), while those ascribed to some secondary factors (see text) are shown as ×, +, and * symbols. The size of each marks represents the intensity of the component.

IV. DISCUSSION
The electric conduction of pentacene as a p-type semiconductor molecule is the transport of electrons in the shallowest occupied states. In the case of Pn-SC, the characters of electronic structures at VBM dominate transport behaviors, e.g., magnitude and anisotropy of charge carrier mobility. Transport mechanisms in organic semiconductor solids are generally explained using the Marcus electron transfer model (so-called “hopping” transport) and Drude model (“band” transport).
The former treats charge carriers and their transport as molecular ions and continual charge transfer reactions between ion species and adjacent neutral molecules, respectively. The charge carrier mobility μM is therefore given asReference Kera, Yamane and Ueno30
 $${\mu _{\rm{M}}} = {{e{L^2}} \over {{k_{\rm{B}}}T}}{k_{{\rm{ET}}}}\quad ,$$
where L is an intermolecular distance, k B is the Boltzmann constant, T is the temperature, and k ET is the Marcus electron transfer rate constant. k ET is expressed as a function of T, a reorganization energy λ, and the intermolecular transfer integral t, as
 $${k_{{\rm{ET}}}} = {{2\pi } \over \hbar }\sqrt {{1 \over {4\pi \lambda {k_{\rm{B}}}T}}} {{\rm{e}}^{ - {\lambda \over {4{k_{\rm{B}}}T}}}} \times {t^2}\quad .$$
Therefore, μM is expressed as
 $${\mu _{\rm{M}}} = {{e{L^2}} \over \hbar }\sqrt {{\pi \over {\lambda {{\left( {{k_{\rm{B}}}T} \right)}^3}}}} {{\rm{e}}^{ - {\lambda \over {4{k_{\rm{B}}}T}}}} \times {t^2}\quad .$$
In the Marcus model, charge carriers are assumed to be localized within a single molecule. By contrast, the Drude model regards charge carriers as delocalized quasiparticles of effective mass m*, which are accelerated by the electrostatic force and halted repeatedly by scattering events. The charge carrier mobility μD is written as
 $${\mu _{\rm{D}}} = {{e\tau } \over {{m^ * }}}\quad ,$$
where τ is a carrier relaxation time (τ−1 corresponds to the frequency of scattering events). The energy-time uncertain relation restricts the lower limit of τ asReference Fröhlich and Sewell31
 $$\tau \, \gtrsim \,{{2\hbar } \over {3{k_{\rm{B}}}T}}\quad ,$$
because the mean kinetic energy of the carrier is given as  ${3 \over 2}{k_{\rm{B}}}T$. The effective mass of charge carriers m* is inversely proportional to the curvature of the E–K dispersion relation as
 $${1 \over {{m^ * }}} = \pm {1 \over {{\hbar ^2}}}{{{{\rm{d}}^2}} \over {{\rm{d}}{K^2}}}E\left( K \right)\quad ,$$
where the positive and negative signs are given for electrons and holes, respectively. Intermolecular electronic coupling in van der Waals solids is generally smaller than in covalent/ionic crystals, and thus the electronic structures of organic semiconductor crystals can be described by assuming tight-binding (TB) models. Under the simplest one-dimensional TB (1D-TB) approximation, the E–K dispersion relation is written as
 $$E\left( K \right) = {E_{\rm{c}}} + 2t\cos \left[ {{K \over {{L^ * }}}} \right]\quad ,$$
where E c corresponds to the band center and L* is the distance between reciprocal-lattice points. In the present case, charge carriers that should be considered are holes, and these are located at boundaries of the SBZ (M and M′ points) as discussed above. The curvature of the 1D-TB band at the band edges (K = πL*) is approximated as
 $${{{{\rm{d}}^2}} \over {{\rm{d}}{K^2}}}E\left( K \right) \simeq {{2t} \over {{L^{ * 2}}}}\quad .$$
Substituting Eqs. (7) and (9) for Eq. (5), μD of conductive holes in the Pn-SC is expressed as a function of τ, L*, and t, as
 $${\mu _{\rm{D}}} = - {{2e\tau } \over {{\hbar ^2}{L^{ * 2}}}}t\quad .$$
Inequality (6) gives the lower-limit of μD as
 $${\mu _{\rm{D}}} \, \gtrsim - {{4e} \over {3\hbar {L^ {* 2}{k_{\rm{B}}}T}}}t\quad .$$
It is worth noting that both μM and μD given in the above discussion should be regarded as ideal values; the actual mobility in practical devices has to be somewhat diminished by extrinsic factors (e.g., structural defects and charge carrier traps) relative to the ideal values.
Equations (4) and (10), and inequality (11) indicate that the intermolecular transfer integral t is a common parameter dominating the charge carrier mobility at RT regardless of transport model, i.e., either hopping transport or band transport. As shown in Fig. 6, the present results of E–K dispersion relations could be reproduced fairly well by the 1D-TB approximation. The magnitudes of t were estimated to be −0.017 eV for the H-band in the Γ–M direction and −0.040 eV for the L-band in the Γ–M′ direction, which correspond to the hole effective masses m h* of 8.6m 0 and 3.7m 0, respectively, at the VBM. The latter values of t and m h* agree with the previous results on Pn-SC after ambient exposure.Reference Nakayama, Mizuno, Hikasa, Yamamoto, Matsunami, Ideta, Tanaka, Ishii and Ueno13 This implies that the impact of exposure on valence band structures of Pn-SC was insignificant.
Variations in t depending on crystallographic direction leads to anisotropy of charge carrier mobility. The present results revealed that t in the Γ–M′ direction was about 2.3 times greater than that in Γ–M. This means that, if one simply assumes that the other parameters were independent of direction, the anisotropy of the hole mobility of the Pn-SC was at least a factor of ∼2.3 for band transport or (2.3)2 ≈ 5.3 for the hopping transport framework. It has to be noted that the largest and smallest curvatures of E–K dispersion at the VBM may not be along the Γ–M′ and Γ–M directions, respectively, but in other directions (e.g., X–M and Y–M directionsReference de Wijs, Mattheus, de Groot and Palstra4). Thus the above magnitude of anisotropy should be considered as the lower-limit. Furthermore, the present 1D-TB treatments could be oversimplified to accurately reproduce the two-dimensional properties of charge carrier transport in Pn-SC. Nevertheless, the present anisotropy values agree with theoretical predictions.Reference de Wijs, Mattheus, de Groot and Palstra4,Reference Ishii, Kobayashi and Hirose32–Reference Canola, Pecoraro and Negri34 As an experimental work, Lee et al. reported that the field effect mobility in an FET device consisting of a single piece of Pn-SC varied from 0.65 cm2/(V s) to 2.3 cm2/(V s) depending on the measurement direction,Reference Lee, Roth and Park14 which corresponded to an anisotropy of ∼3.5. Although the crystallographic orientation was undefined in their study, the expected anisotropy from the present results reasonably reproduced this experimental magnitude.
The formation of dispersive electronic bands is not a sufficient condition for the occurrence of band transport. The energy dispersion has to be wide and m* has to be sufficiently light to enable charge carriers to delocalize out of individual molecules. In fact, the transport characteristics between these two models were experimentally demonstrated in FET devices of Pn-SC.Reference Uemura, Yamagishi, Soeda, Takatsuki, Okada, Nakazawa and Takeya35 In the framework of hopping transport, μM at RT in the Γ–M and Γ–M′ directions are expected to be 0.45 cm2/(V s) and 2.4 cm2/(V s), respectively, from the present results, where λ is assumed to be 0.12 eV according to the previous data on crystalline thin-films of pentacene.Reference Yamane, Nagamatsu, Fukagawa, Kera, Friedlein, Okudaira and Ueno36,Reference Kera, Hosoumi, Sato, Fukagawa, Nagamatsu, Sakamoto, Suzuki, Huang, Chen, Wee, Coropceanu and Ueno37 From inequality (11), the lower limits of μD in the Γ–M and Γ–M′ directions are estimated to be 1.4 cm2/(V s) and 3.2 cm2/(V s), respectively, at RT. In both cases, the experimental mobility values cited above were between the ideal μM and the lower limit of μD. Some of the reported field effect mobility values were around the expected μM in the Γ–M direction,Reference Butko, Chi, Lang and Ramirez38–Reference Kimura, Niwano, Ikuma, Goushi and Itaya41 whereas others surpassed the lower limit of μD in the Γ–M′ direction.Reference Takeyama, Ono and Matsumoto42,Reference Arabi, Dong, Mirza, Yu, Wang, He and Jiang43 Altogether, the present results suggest that both hopping and band transport frameworks contribute to electric conduction in Pn-SC. This is contrasting to the case of single crystal rubrene (5,6,11,12-tetraphenylnaphthacene) in which a lighter m h* of 0.65m 0 was demonstratedReference Machida, Nakayama, Duhm, Xin, Funakoshi, Ogawa, Kera, Ueno and Ishii23 and the charge carrier transport can simply be described in the framework of band transport as a consequence.Reference Podzorov, Menard, Borissov, Kiryukhin, Rogers and Gershenson44–Reference Li, Podzorov, Sai, Martin, Gershenson, Di Ventra and Basov47 It is noteworthy that the total width of the valence bands of the single crystal pentacene, that is derived to be 0.48 (±0.02) eV from the energy split of the two valence bands at the M and M′ points, is comparable or even greater than that of the single crystal rubrene [0.44 (±0.03) eVReference Machida, Nakayama, Duhm, Xin, Funakoshi, Ogawa, Kera, Ueno and Ishii23,Reference Nakayama, Uragami, Machida, Koswattage, Yoshimura, Setoyama, Okajima, Mase and Ishii48 ]. The relatively heavy m h* of the Pn-SC in spite of the wide bandwidth is ascribed to a narrow energy dispersion in the upper parts of the valence bands; in fact, m h* of the H-band exhibits a lighter value (1.2m 0) at the Γ point in the Γ–M′ direction, which gives a hypothetical μD of over 10 cm2/(V s) at RT if the VBM of the Pn-SC is located at the center of the SBZ rather than the boundaries. This discussion implies that the transport properties of the molecular crystals are drastically changed by a delicate balance of the intermolecular orbital overlap via E–K dispersion behaviors.
Finally, the “third” component that was separated from the two primary components—consisting of valence bands—is discussed briefly. Around the Γ-point, this component appeared at the deepest BE side below the valence bands, as indicated with + marks in Figs. 3(a) and 6. This feature was also found in previous work on Pn-SC and was ascribed to electrons having experienced inelastic scattering.Reference Nakayama, Mizuno, Hikasa, Yamamoto, Matsunami, Ideta, Tanaka, Ishii and Ueno13 A similar feature was persistently observed in the ARUPS results on single crystal rubrene.Reference Machida, Nakayama, Duhm, Xin, Funakoshi, Ogawa, Kera, Ueno and Ishii23,Reference Nakayama, Uragami, Machida, Koswattage, Yoshimura, Setoyama, Okajima, Mase and Ishii48–Reference Bussolotti, Yang, Yamaguchi, Yonezawa, Sato, Matsunami, Tanaka, Nakayama, Ishii, Ueno and Kera50 While the spectral profiles near the SBZ boundary were reproduced by merely two components of the valence bands in the previous work,Reference Nakayama, Mizuno, Hikasa, Yamamoto, Matsunami, Ideta, Tanaka, Ishii and Ueno13 the third component (star marks) was clearly resolved between the two valence band components at both M and M′ points in the present results. The energy splitting between this component and the uppermost band (namely, the H-band around the M point or the L-band around the M′ point) was 0.12 eV on average, which was close to the reorganization energy λ of solid state pentacene as mentioned above. It has been theoretically predicted that the HOMO-derived bands of molecular crystals are cut at the vibrational energies by electron–phonon coupling.Reference Fratini, Mayou and Ciuchi51 Accordingly, although the origin(s) of this third component could not be defined at the present stage, this may be relevant to electron–phonon coupling in Pn-SC. It should be emphasized that this structure could be resolved only for the Pn-SC samples without ambient exposure, i.e., this feature was presumably overwhelmed by the main bands in exposed Pn-SC samples in the previous work because of peak broadening.Reference Nakayama, Mizuno, Hikasa, Yamamoto, Matsunami, Ideta, Tanaka, Ishii and Ueno13 This suggests that the impurity-free clean surface of the Pn-SC will open a route for comprehensive identification of transport phenomena via accurate characterization of valence band structures.
V. CONCLUSION
In this study, Pn-SC samples were prepared without exposure to the ambient atmosphere and their surface chemical conditions and valence band structures along four symmetry directions in the SBZ were demonstrated by means of XPS and ARUPS. XPS results revealed that the surface oxidation of Pn-SC could be suppressed to reduce oxygen abundance (to less than 0.5% to the carbon). A series of ARUPS spectra from the center (Γ-point) to the four symmetry points (X, Y, M, and M′) of SBZ evidenced that the VBM of Pn-SC was not located at the Γ-point, but the valence bands approached E F while moving toward M and M′ points. The E–K dispersion relationships of valence bands in the Γ–M and Γ–M′ directions were reasonably reproduced under the 1D-TB approximation. The intermolecular transfer integral t was derived to be −0.017 eV and −0.040 eV in the Γ–M and Γ–M′ directions, respectively. These values led to anisotropy of charge carrier mobility of 2.3 for the band transport framework or 5.3 for hopping transport, which agreed with experimental studies on FET mobility reported previously.
Supplementary Material
To view supplementary material for this article, please visit https://doi.org/10.1557/jmr.2018.315.
ACKNOWLEDGMENTS
This work was supported by Joint Research by IMS [Proposal Nos. 28-620 and 29-604] and was conducted under approval of PF Program Advisory Committee [Proposal No. 2015G141]. Financial supports from JSPS-KAKENHI Grant Nos. JP15H05498, JP16K14102, and 26248062, The Precise Measurement Technology Promotion Foundation, Iketani Science and Technology Foundation, and Futaba Electronics Memorial Foundation are gratefully acknowledged.