1 Introduction
This paper presents EPG (electropalatography) data from Central Arrernte, an Australian language rich in coronal consonant contrasts. Data are presented based on the traditional Reading-style palate (Hardcastle Reference Hardcastle1972, Gibbon & Nicolaidis Reference Gibbon, Nicolaidis, Hardcastle and Hewlett1999) and on the newer Articulate-style palate (Wrench Reference Wrench2007), which has been designed to address the main problems with the older Reading palate while retaining the 62-electrode layout.
The purpose of this paper is two-fold: firstly, it will provide comprehensive lingual contact data from two speakers of a language rich in coronal place contrasts and, secondly, it will provide raw data and standard EPG summary measures for the older and newer style artificial palates, thereby facilitating comparisons between studies using these two different palates.
1.1 Central Arrernte
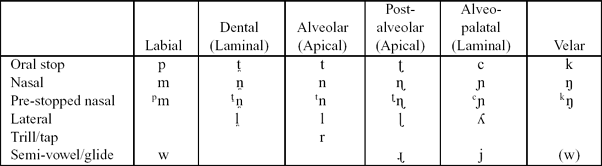
The consonant system of Central Arrernte (Arandic, Pama-Nyungan – spoken in and around Alice Springs in Central Australia) is given in Table 1 (see Breen & Dobson Reference Breen and Dobson2005 for an overview of Central Arrernte phonology). It can be seen that Central Arrernte has a ‘long, thin’ consonant inventory, typical of many Australian languages (Butcher Reference Butcher, Harrington and Tabain2006), that is, it has many contrasts in place of articulation, but no voicing contrasts in oral stops and no fricatives in the manner category. However, it does contrast six places of articulation, including four coronal places of articulation. The coronals are subdivided into laminals (dental, and alveo-palatal – henceforth simply ‘palatal’) and apicals (alveolar and post-alveolar, the latter more commonly termed ‘retroflex’). Notably, these four coronal contrasts are present across the oral stop, nasal, pre-stopped nasal and lateral manners of articulation.
The consonant phonemes of Central Arrernte. In addition to the consonants listed here, some older speakers have a velar semi-vowel/glide /ɰ/, but this is not the case for the speakers of the present study. Note that the trill/tap /r/ is not included in the present analysis, due to difficulty capturing its rapid movements using EPG.

The laminal articulations are characterized by a broad band of contact between the tongue and the palate, and the apicals by a more narrow band of contact (Dart Reference Dart1991, Butcher Reference Butcher1995a). In Central Arrernte, as in many Australian languages, the apical contrast is not clear in all positions in the word (Butcher Reference Butcher and Lewis1995b, Evans Reference Evans and Goldsmith1995, Tabain Reference Tabain2009): the contrast is neutralized in initial position, but is clearest following the vowel of a metrically stressed syllable.Footnote 1 In other positions in the word, by contrast, there is a high degree of variability in production, with place of articulation variable even within repetitions of the same word. The most prototypical retroflex articulation shows forward movement of the tongue during acoustic closure, beginning at a post-alveolar place of articulation, and releasing into an alveolar place (see Ladefoged & Maddieson Reference Ladefoged and Maddieson1996: 21–30). The most prototypical alveolar articulation, by contrast, does not show forward movement of the tongue, and both closure and release occur at the alveolar place. These prototypical articulations are found following the metrically stressed vowel. However, in other positions of the word, the tongue may or may not move forward during acoustic closure, and closure and/or release may occur at a position intermediate between alveolar and post-alveolar. Tabain (Reference Tabain2009) provides extensive data on these variable apical articulations. By comparison, the laminal articulations have been less well studied, with Tabain, Fletcher & Butcher (Reference Tabain and Breen2011) presenting some EPG data for the different palatal manners of articulation in Central Arrernte and the neighbouring language Warlpiri; and Butcher (Reference Butcher1995a) presenting some static palatographic data for both dentals and palatals in different Australian languages.
It should also be noted that velar consonants in back and central vowel contexts are significantly further back in Australian languages, both articulatorily and acoustically (i.e. F2 locus), than are velars in European languages (Butcher & Tabain Reference Butcher and Tabain2004). Although the precise reasons are not clear, it is thought that this more back articulation is due to the large number of coronal contrasts in Australian languages: the greater velar coarticulation results in more level F2 transitions for the velar, thereby making these transitions more distinct from the various coronal F2 transitions.
Finally, it should be noted that Central Arrernte has a small vowel inventory. It is generally analysed as a three-vowel system /i ə a/ with the high vowel /i/ being of very low frequency, except in word-initial position where it is relatively frequent. Rounding is considered a property of the consonant that may be transferred onto the vowel, resulting in surface [u] in certain cases; this surface [u] is represented in the orthography (see Henderson Reference Henderson1998 for further details). Tabain & Breen (Reference Tabain and Breen2011) provide extensive acoustic data for the Central vowels of Central Arrernte, including data on consonant effects (both leftwards and rightwards) on the vowel formant targets.
1.2 Electropalatography
Electropalatography (EPG) is a technique which measures contact between the tongue and the (hard) palate. It provides information on tongue–palate contact in both the sagittal (as columns in the data) and the coronal planes (as rows), and may therefore provide an excellent snapshot of the different manners and places of articulation in a language such as Central Arrernte. Indeed, the dynamic nature of EPG has made it useful in studying the notoriously difficult apical contrast in this language, since it can capture the forward movement of the tongue during consonant closure for retroflex consonants (Tabain Reference Tabain2009). There is an extensive literature on EPG research, and the beginner reader is referred to Hardcastle (Reference Hardcastle1972), Hardcastle, Gibbon & Jones (Reference Hardcastle, Gibbon and Jones1991), Hardcastle, Gibbon & Nicolaidis (Reference Hardcastle, Gibbon and Nicolaidis1991), Fletcher (Reference Fletcher1992), Byrd, Flemming, Muller & Tan (Reference Byrd, Flemming, Muller and Tan1995) and Gibbon & Nicolaidis (Reference Gibbon, Nicolaidis, Hardcastle and Hewlett1999). However, it should be noted that EPG cannot provide information on which part of the tongue is being used – this is of relevance for a language which contains apical and laminal articulation, as Central Arrernte does.
This paper presents data using the Reading-style palate, as well as the newer Articulate palate. The defining characteristic of both of these palates is that they contain 62 electrodes arranged in eight rows: each of the rows contains eight electrodes, except for the front row, which contains six electrodes. The Reading palate was originally used in Europe (Hardcastle et al. Reference Hardcastle, Gibbon and Jones1991), but is now being used in other parts of the world. Two other types of palate were previously in common use: the Kay palate, which was used mainly in the United States (Fletcher Reference Fletcher1992); and the Rion palate which was used mainly in Japan (Shibata, Ino, Yamashita, Hiki, Kiritani & Sawashima Reference Shibata, Ino, Yamashita, Hiki, Kiritani and Sawashima1978). However, manufacture of both of these palate types has been discontinued. Wrench (Reference Wrench2007) provides an excellent overview of the history of these different palate types, with illustrations.
In the traditional Reading palate (see Figure 1), row 8 is the back row, located at the juncture between the hard and soft palates; and row 1 is the front row, located just behind the central incisors. Generally, rows 1 and 2 are considered alveolar, rows 3 and 4 post-alveolar, row 5 pre-palatal, row 6 palatal, row 7 post-palatal, and row 8 pre-velar (Gibbon & Nicolaidis Reference Gibbon, Nicolaidis, Hardcastle and Hewlett1999).Footnote 2
The traditional Reading palate (left) and the new Articulate palate (right) for speaker MT. The traditional Reading palate was made in 1997, and the new Articulate palate was made in 2010.

There have been several important criticisms of the traditional Reading-style palate, most importantly related to the location of the contact electrodes. More precisely, compared to the Kay palate, the traditional Reading palate gives relatively little information on contact in the velar and dental regions – in particular, given the significantly larger number of electrodes, the Kay palate was able to provide much better information on contact in these regions (Fougeron, Meynadier & Demolin Reference Fougeron, Meynadier and Demolin2000).
Other criticisms of the traditional Reading palate could also be applied to the Kay and Rion palates: the cost of each individual palate is relatively high, due both to the cost of components and to the time needed to manufacture the palate; and the palate was uncomfortable for many speakers. The traditional Reading palate is made of acrylic resin, and is held in place by stainless steel clasps around the teeth. The fine wires which are soldered to the electrodes are collected into two bundles, each sealed in flexible plastic tubing; the flexible tubes then exit the mouth around the back of the rear molars. Figure 1 shows the traditional Reading palate on the left, and the newer Articulate palate on the right – the two palates are from the same speaker (myself, MT).
The new Articulate palate was designed to address these main criticisms of the traditional Reading palate. Primarily, the first row of contacts has been moved forward by about 1 mm onto the base of the central incisors, rather than posterior to the central incisors as was the case with the traditional Reading palate. In addition, the last row of the Articulate palate is placed straight across the soft palate, aligned with the rear molars and perpendicular to the mid-sagittal line. According to Wrench (Reference Wrench2007), this position is 7–12 mm behind the border of the hard and soft palates mid-sagittally, and provides coverage similar to the Kay palate. Wrench advises that the fourth row should be placed on the posterior rugae in what is nominally a post-alveolar position, and that this should ideally be about one-third of the distance between the first and last rows. The second and third rows are then placed evenly between the first and fourth rows, and rows 5, 6 and 7 are placed evenly between the fourth and last rows; ideally, row 7 should align with the mid-sagittal boundary of the hard and soft palate. It can be appreciated, however, that as a result of these guidelines, there may be some variation in the placement of the fourth row, and hence in the placement of the remaining rows: thus, although the traditional Reading palate and the newer Articulate palate should have similar placements of the fourth row, there may be subtle differences in interpretation of the guidelines by the dental technician, with a resulting difference in the location of this row for different artificial palates for the same speaker. This difference in location of the fourth row can be seen in Figure 1, where the fourth row is further forward for the Articulate palate than it is for the traditional Reading palate. However, it can also be seen in this figure that the front row of contacts is noticeably further forward for this speaker on the Articulate palate, and as a result, rows 2 and 3 are also further forward. It can additionally be seen that the back row is noticeably further back, with more subtle differences in placement for rows 5 to 7 as a result. The reader is referred to Wrench (Reference Wrench2007) for more extensive details on the Articulate palate, and in particular to Figures 4 and 5, and Tables 1 and 2, which give further information on placement of the rows for the Reading vs. Kay palates, on mean spacing between the electrodes for the Reading palate, and on the assignment of electrodes to the various articulatory regions for the Kay, Reading and Articulate palates. In this final respect, it may be noted that the Reading palate assigns zero contacts to the dental region, while the Articulate palate assigns 6; the Reading palate assigns 14 contacts to the alveolar region, whereas the Articulate palate assigns 8; both palates assign 16 contacts to the post-alveolar region; the Reading palate assigns 24 contacts to the palatal region while the Articulate palate assigns 16; and the Reading palate assigns 8 contacts to the velar region, whereas the Articulate palate assigns 16.
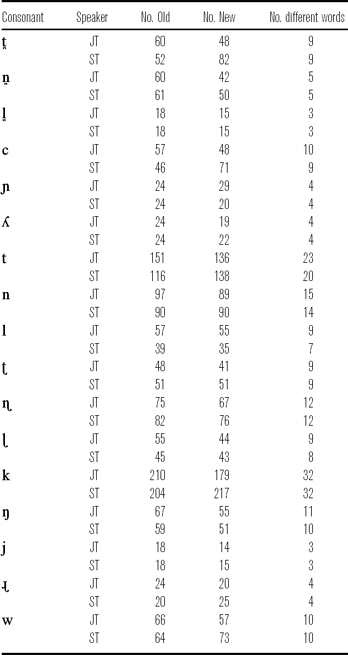
Number of tokens in Old (Reading) and New (Articulate) databases, and the number of different words in the databases (the words are the same in the two databases).

The additional changes made for the Articulate palate relate to comfort and cost. The new Articulate palate is thermoformed using a thin laminated acrylic material, and the wires exit the mouth at the front teeth (see Figure 1). The thermoformed palate covers the teeth, and is much more flexible and much more comfortable than the traditional Reading palate. It is also much thinner than the traditional palate: it is about 1mm thick over the teeth, and about 0.5 mm thick in the palatal arch – this contrasts with the traditional Reading palate which is usually 1.5 mm thick, but sometimes 2.5 mm thick around the rugae of the alveolar region. With the slimmer fit, speakers adjust to the presence of the palate much more quickly.
Although the cost of component parts is comparable for the Reading and Articulate palates, a reduction in the time needed for labour (3–4 hours for the Articulate palate, compared to 12–16 hours for the Reading palate) leads to significant end-cost reductions. These reduced costs will facilitate the use of EPG for both research and clinical purposes.
2 Method
2.1 Speakers and recordings
Two female native speakers of Central Arrernte participated in these recordings – Sabella Turner (ST) and Janet Turner (JT), who are mother and daughter, respectively. Both are teachers of Arrernte language in Alice Springs.
The first set of recordings, using the standard Reading palate, took place at the Speech, Hearing and Language Research Centre at Macquarie University in Sydney, in December 2004. The speakers were seated in a dentist chair facing a computer screen on which the words were presented. A recording technician and myself (MT) were also present. EPG and acoustic data were recorded simultaneously via a UNIX machine. EPG data were sampled at 200 Hz, and acoustic data at 20 kHz.
The second set of recordings, using the new Articulate palate, took place at the Institute for Aboriginal Development in Alice Springs, in September 2008. The speakers were seated in a desk chair facing a laptop on which the same words were presented. A specialist in Arrernte grammar (Gavan Breen) and myself (MT) were also present, and a technical assistant was available as required. EPG and acoustic data were recorded simultaneously onto a PC laptop computer running the Articulate Assistant software (http://www.articulateinstruments.com/, Articulate Instruments Ltd 2007), with an external recording-quality soundcard to ensure accurate articulatory–acoustic synchronization. EPG data were sampled at 200 Hz, and acoustic data at 22.05 kHz.
For both sets of recordings, the speakers wore the artificial palate for several minutes before the recording began, participating in normal conversation during recording set-up, etc. However, on inserting the new Articulate palate before the second set of recordings, both speakers immediately commented on the greater comfort of the new palate, compared to the traditional Reading palates they had previously worn. Equally importantly, there was no noticeable effect on their conversational English speech when they inserted the artificial palate – this is in contrast to the traditional Reading palate, where even the most experienced users have a period of distorted speech before becoming re-accustomed to the palate.
A picture of the Articulate palates for speakers JT and ST is given in Figure 2.Footnote 3
The new Articulate palates for Central Arrernte for speakers ST (left) and JT (right).

2.2 Stimuli
The stimuli for this study were real words from Central Arrernte (see Appendix 1). The word-list was designed for use in EPG recordings by Andy Butcher and John Henderson (see also Henderson & Dobson Reference Henderson and Dobson1994). Within phonotactic and lexical limits, the word-list aimed to present each coronal consonant (stop, nasal, pre-stopped nasal, lateral and rhotic) and each velar consonant (stop, nasal and pre-stopped nasal) in the language in word-initial, word-medial and word-final position. Nasal–stop clusters were also illustrated in this way. Wherever possible, other consonants in the word were labial, in order to minimize lingual coarticulatory influences. However, some words were included precisely in order to study lingual coarticulatory effects between the various coronal places of articulation, and between coronals and velars: however, coarticulatory effects are not studied in the current paper.
The stimulus words were presented in standard Arrernte orthography. For the first set of recordings, the speakers repeated each word three times in a row, and read through the list twice (the second time in reverse order). Words were uttered in isolation, rather than in a carrier phrase. There were thus, potentially, six repetitions of each word in the list by each speaker. For the second set of recordings, the speakers repeated each word either five or six times in a row, and only read through the list once – this choice was made due to technical problems with the software during the second set of recordings.
When the speaker did not recognize a word, I prompted with an English gloss. This only happened for one or two words that were not in current use. If the speaker then felt that she was able to produce the word, she did so; otherwise she moved on to the next word.
2.3 Data analysis
Data were labelled using the EMU Speech Database system (http://emu.sourceforge.net, Cassidy & Harrington Reference Cassidy and Harrington2001), and all data analysis was done using this system interfaced with the R Statistical Package (http://cran.r-project.org/, R Development Core Team 2003). The epgdisplay package, which is an optional part of the EMU system, was used to explore the EPG data.
The acoustic data were labelled by a paid labeller using standard labelling criteria and checked by myself [MT] during the data analysis stage. Acoustic criteria were used to define the consonant onset and offset, except for word-initial and word-final tokens, whose onset and offset, respectively, were located using EPG closure and release.
Disfluent utterances were discarded; such utterances were relatively infrequent for both speakers, but relatively more common for speaker ST in the first set of recordings.
2.4 EPG measures
Five commonly used EPG measures were used to describe the data from the two sets of recordings. A good discussion of these various measures can be found in Chapter 7 of Harrington (Reference Harrington2010). In the formulae given below, ‘R’ is used to denote rows, and ‘C’ is used to denote columns:
(i) Anteriority Index (AI). This measures contact across the first five rows of the palate, and gives an exponentially higher weighting for the front rows (Recasens & Pallarès Reference Recasens and Pallarès2001). It varies between zero and one:

(ii) Centrality Index (CI). This measure is comparable to the AI measure, but it is applied to the four pairs of columns, rather than to the first five rows. This measure gives an indication of the width of the central channel.Footnote 4
(iii) Dorso-palatal Index (DI). This measures the proportion of contact in the three back rows of the palate (i.e. rows 6 to 8). Since it is a proportional value (i.e. n contacts divided by 24 possible contacts), it varies between zero and one.
(iv) Total contacts (Sum). This varies between zero and 62, which is the number of electrodes on the artificial palate.
(v) Centre of Gravity (COG). This measures contact across the entire palate, and gives a linearly higher weighting as the rows become more forward (Hardcastle, Gibbon & Nicolaidis Reference Hardcastle, Gibbon and Jones1991; Gibbon, Hardcastle & Nicolaidis Reference Gibbon, Hardcastle and Nicolaidis1993). The value of COG varies between 0.5 if the entire back row of electrodes is contacted, and 7.5 if the entire front row of electrodes is contacted.
Note that in this version of the EPG COG formula, there is no adjustment made for the fact that the front row has fewer electrodes than the other rows.
For all of these measures, data were sampled at the temporal midpoint of the consonant. The temporal midpoint was chosen in order to maintain consistency across the different consonant types examined here, which were located in different positions within the word, and with different adjacent segmental contexts (e.g. adjacent vowel vs. adjacent consonant).
Duration values were also calculated for each consonant, in order to make sure that any differences in the EPG measures were not due to differences in speaking rate across the Old and New recordings.
2.5 Data selection and statistical analysis
In order to be useful for comparative purposes, data from the two sets of recordings needed to be as similar as possible. To this end, data were taken only from words which were repeated in both sets of recordings. In some cases, a speaker produced a word in one set of recordings, but not in the other; for instance, speaker ST produced the word atne /atn/ [atnə] ‘faeces’ in the first set of recordings, but not the second set. In this case, the word atne was not used in the analysis of speaker ST's data, although it was used for speaker JT, who repeated it in both sets of recordings. A list of the words that were used in the analysis is given in Appendix 1. This list groups the words according to target consonant; as a result, a particular word may appear more than once on the list if it contains more than one lingual consonant.
An additional problem for purposes of analysis was that the number of tokens varied for each speaker and for each word, due to discarded tokens, extra repetitions, and the differences already mentioned between the first and second set of recordings. As a result, for each of the five EPG measures listed above, a single mean value was calculated for each word for each speaker. For instance, speaker JT produced three different words which contained the lateral dental lh / / – alherreme, arlpelhe and lhere. However, in the first set of recordings, she produced six repetitions of each word, and in the second set of recordings, she produced five repetitions of each word. For the purposes of statistical analysis, a single mean value was calculated for each of AI, CI, DI, Sum and COG for each of the three different words, in both the first and second set of recordings (henceforth ‘Old’ and ‘New’ recordings).
The mean values for each word in the Old and New recordings were then subjected to a paired t-test using the R Statistical Package (e.g. three mean values were input for each of the Old and the New data for speaker JT's lateral dental //). Data were grouped according to consonant, and the two speakers were treated separately in the statistics. Significance was set at p < .05, with a trend defined at p < .10.Footnote 5
Table 2 gives the number of tokens for each consonant for each speaker, for both the Old and the New data. It also gives the number of different words used for each consonant for each speaker – the number of different words is the same for both the Old and the New data, and these different words are listed in Appendix 1, as already noted.
Note that data for the trill/tap /r/ will not be presented here. Despite an EPG sample rate of 200 Hz, contact was not always visible for this particular consonant.
3 Results and discussion
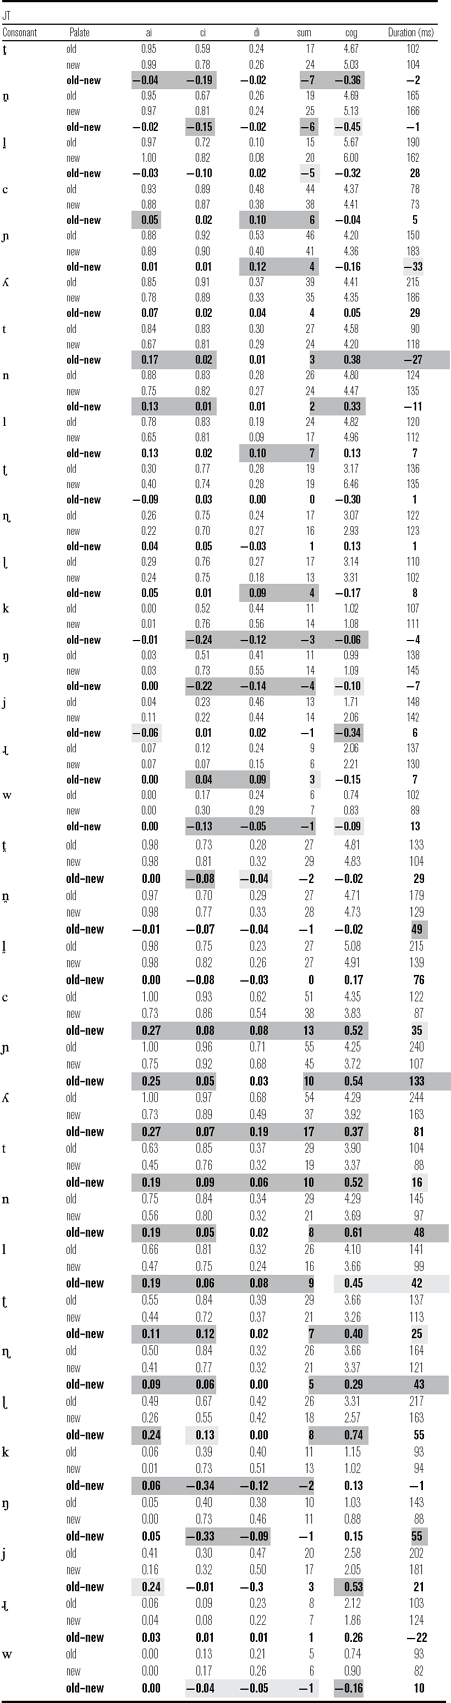
Figure 3 (a–q) gives averaged palatograms of all of the 17 consonants analysed in this study, for both speakers (JT left, ST right). The Old (Reading) data are on the left, the New (Articulate) data are on the right. Darker shading of a cell denotes more frequent contact of that electrode, and lighter shading denotes less frequent contact, as automatically generated by the epggs function of the epgdisplay package in EMU/R. Mean AI, CI, DI, Sum, COG and Duration values are presented in Table 3 for both the Old and New data, as well as the differences between the Old and New values. Note that the mean values in this table are based on the mean values for each word, and are not calculated across all tokens produced. Significant differences are shaded dark grey, and differences which show a trend are shaded light grey. The full statistical results for these significant differences and trends are given in Appendix 2.
Averaged palatograms for the 17 consonants studied here. Data are presented for each speaker (JT left, ST right) from both the Old (left) and New (right) data. Darker shading of a cell denotes more frequent contact, and lighter shading denotes less frequent contact. The dental region is at the top of each palatogram, and the velar region at the bottom.

Mean values for the five EPG measures for two speakers (JT and MT) examined in this study. Values are listed for each consonant, for both the Old (traditional Reading-style) palate, and the New (Articulate-style) palate. Values are also given for the mean value of the New palate subtracted from the mean value of the Old palate (these values are printed in bold for ease of presentation). Where the difference in the means is significant at p < .05 based on a paired t-test, the cell is shaded dark grey; and where the difference in the means shows a trend at p < .10, the cell is shaded light grey.

ai = Anteriority Index, ci = Centrality Index, di = Dorso-palatal Index, sum = Total Contacts, cog = Centre of Gravity
Broadly speaking, it can be seen that for the dental consonants /
 /, speaker JT has contact mainly at the first row for the Old data, and at both the first and second rows for the New data. Speaker ST generally has a broader band of contact, with relatively few differences between the Old and New data. It may also be noted that speaker JT has more extensive gaps on the right and left edges of her palate for the lateral consonant than does speaker ST; for speaker ST, it is likely that the lateral airflow was between the tongue and the teeth.
The statistical results confirm that speaker JT has more significant differences between the Old and New data than does speaker ST. For the dental stop, speaker JT's AI, CI, Sum and COG values are all higher for the New data, whereas for speaker ST's dental stop, only the CI value is higher, with a trend for DI to be higher as well. Speaker JT also shows higher CI and Sum values, and a trend for a higher COG value, for the New data for the dental nasal; she also shows a trend for a higher Sum value for the lateral nasal, so that overall, it can be said that this speaker has much greater contact for the dental using the New palate. It is important to note that the dental consonants in Arrernte are laminals, which tend to show a large amount of contact (see Butcher Reference Butcher1995a, Reference Butcher and Lewisb). It is therefore reasonable to expect that even the New EPG palate does not capture the full amount of contact for these consonants.
Striking differences may also be observed for the palatal consonants. Indeed, if one was unaware that these were palatograms of the same speakers producing the same words on different occasions, one might conclude that quite different speech sounds were involved in the two sets of data, in particular for speaker ST. In the Old data, the first row of the palate is routinely contacted, whereas in the New data, this is not the case. The effects on the EPG measures are extensive, particularly so for speaker ST. Both speakers show lower AI, DI and Sum values for the New palatal stop data, and speaker ST additionally shows lower CI and COG values. Both speakers show lower Sum values for the palatal nasal, and speaker ST also shows lower AI, CI and COG values, while speaker JT shows lower DI values for this consonant. Speaker ST also shows lower values for all of the EPG measures using the New palate for the lateral palatal, while speaker JT has no significant effects at all for this consonant (although the difference in values goes in the same direction as for speaker ST). It is clear that the New palate has a large effect on the EPG measures for the palatal consonants. Although the palatals are also a laminal articulation in Arrernte,Footnote 6 it appears that both the Old and the New EPG palates are well designed to capture the full extent of their articulation, but they give different ‘pictures’ of the articulations.
We turn now to the apical sounds – alveolar and retroflex. These sounds are notoriously variable in production – an overview of this variability can be found in Tabain (Reference Tabain2009). The extreme level of variability in the production of the apicals is reflected in the palatograms, with lighter shading across the entire palate, particularly for speaker ST's alveolars.Footnote 7 Part of the reason for this variation lies in the fact that the two apicals do not always contrast – as mentioned in Section 1.1, the apical contrast is clearest following the metrically stressed syllable, neutralized in (phonetically) word-initial position, and highly variable elsewhere.
Perhaps the best indication of the differences between the Old and New palates can be seen in speaker JT's alveolar data. With the Old palate, the first row routinely shows contact; with the New palate, the first row rarely shows contact. The New palate, therefore, more accurately captures the difference between the alveolar and dental articulations for these two speakers of Central Arrernte – the dental articulations have consistent contact on the first and second rows, whereas the alveolars do not have contact on the first row. For the alveolars, both speakers routinely show higher values for the New palate for all of the EPG measures of these consonants, although speaker ST has a greater number of significant results than speaker JT – out of 15 possible significant results for the alveolar (5 EPG measures × 3 consonants), speaker JT has 10 significant results, and speaker ST has 13 significant results and one trend.
The picture for the retroflexes is a little less clear, but it can generally be said that there is a pattern for values for the EPG measures to be higher using the Old palate. Speaker ST shows 11 significant results and one trend – it is notable that only DI, which measures contact in the back region of the palate, does not have a significant difference for this speaker. Speaker JT shows only two significant results and one trend for the retroflexes. Like the alveolar articulations, the retroflex articulations are generally highly variable, as indicated by the lighter shading of the cells in the palatograms.
As might be expected, the differences between the Old and New palates are very clear for the velars, given that the back row of the artificial palate was placed further back in the New Articulate palate. On the palatograms, it can be seen that the back row is contacted much more often using the New palate, and the EPG measures are affected accordingly. Values are routinely and significantly higher for CI, DI and Sum for both speakers using the New palate (though Sum is not significant for speaker ST). The AI and COG values show opposite tendencies for the two speakers – they are generally higher for the New palate for speaker JT, and lower for the New palate for speaker ST. However, these differences are usually not statistically significant for these measures. One may tentatively conclude that neither of these EPG measures is useful for velar consonants – although this is to be expected for AI, which only takes the first five rows of the palate into account, it is perhaps a little more surprising for COG, which takes all of the rows into account.
Finally, we will consider the glides/semi-vowels. Broadly speaking, the results are more sporadic for the palatal /j/ and the rhotic /ɻ/ – in fact, the speakers showed opposite trends for the COG measure. Results are a little more consistent between the two speakers for the labial-velar /w/, with both speakers showing higher CI, DI, Sum and COG values for the New palate – the CI, DI and Sum results for /w/ are comparable to the results for the velar nasal and velar stop. Clearly, the more posterior location of row 8 on the artificial palate leads to increased contact in the back region of the artificial palate. There is no difference in AI for either speaker for /w/.
One word of caution is needed here. Speaker ST had five significant results for duration, and four trends. In all cases, consonant durations were longer in the Old set of recordings. By contrast, speaker JT had only one significant result and one trend, and in both cases, the durations were longer in the New set of recordings. My impression is that speaker ST was much more comfortable in the New set of recordings, and that her speech style was much more natural (less didactic). This greater comfort may have been due to a more comfortable artificial palate, or to the fact that this was her second experience of articulatory recordings. Given that speaker ST's data showed broadly similar patterns to speaker JT's data, I do not expect that these durational differences played an important role in the results for her EPG measures. However, the reader is advised to keep the durational differences in mind when examining the raw data presented in the palatograms.
4 Conclusion
The new Articulate palate offers more coverage of dental and velar articulations. For a language such as Central Arrernte, the difference between dental and alveolar articulations is more clearly captured with the new Articulate palate than with the traditional Reading palate; however, not even the Articulate palate can fully capture the extent of the laminal contact for the dental articulation (see static palatograms in Butcher Reference Butcher1995a for an indication of the extent of the dental contact), and for this reason, even the new Articulate palate may not be able to fully capture subtle variations in articulation due to coarticulation and prosodic factors. In addition, this greater dental and velar contact information comes at the expense of slightly poorer resolution for articulatory contact in the alveolar and palatal regions.
As regards the velar articulations, the new Articulate palate gives a better picture of these sounds, which involve a large amount of dorsal contact (it also gives a better picture of the dorsal contact for /w/, although this contact is not as extensive as for /k/ and /ŋ/). The reader is reminded that velar articulations are generally further back in back and central vowel contexts in Australian languages, and that therefore the extent of contact for velar articulations in European languages should be much greater using either style of artificial palate. For this reason, the new Articulate palate may be expected to provide much more useful information for coarticulatory and prosodic studies involving velars in a wide range of languages.
There is an important difference in how the various EPG measures are affected by the Old- and New-style palates. Broadly speaking, for the dental and velar articulations, the AI, CI, DI, Sum and COG measures all show higher values for the new Articulate palate than for the traditional Reading palate. By contrast, for the other places of articulation, the measures are all lower for the new Articulate palate. Thus, if one were unaware of the differences between the two types of palate, one might conclude that the dental and velar articulations are further forward on the palate and/or show greater contact if the data were captured using the new Articulate palate; and one might conclude the opposite for the alveolar, retroflex and palatal places of articulation. The notable exceptions involve the palatal and post-alveolar semi-vowels/glides: in this case, there are no consistent differences between the two styles of artificial palate.
A clear picture of the difference between the two styles of artificial palate can be seen in Figure 4: this figure shows the COG measure time-averaged across 103 tokens of /ɳ/ for speaker JT. The data are all taken from ˈVCV sequences, and therefore represent the most prototypical retroflex articulation (i.e. following a stressed vowel). It can be clearly seen that across the whole token, the COG value is higher using the old Reading palate, as compared to the new Articulate palate. Thus, if the researcher were unaware that two different palate types had been used to gather these two sets of data, they might conclude that the speaker with the new Articulate palate had a more posterior placement of the tongue throughout the consonant closure.
Time-normalized and averaged trajectories of the COG measure for the post-alveolar retroflex nasal articulation in intervocalic position, following a stressed vowel. Data are from 103 tokens. ‘rn’ is the orthographic form of /ɳ/. Data are from speaker JT.

Perhaps more importantly for the clinician and for the researcher looking at the raw data, the different placement of the rows in the two types of palate may lead to the perception of different articulations: this is most noticeable for the palatal consonants. It is also important to note that neither of the currently available palates provide a complete picture of tongue-palate contact patterns, and also that there are notable differences between speakers. The present results therefore serve as a reminder that technological sampling methods influence our assumptions and knowledge about speech production: any articulatory data we gather provide only a small insight into the entire speech production process.
Users of both the traditional Reading palate, and the new Articulate palate, are therefore advised to familiarise themselves with the typical contact patterns for the different sounds which they wish to investigate, and it is hoped that this paper has provided some data for them to do so.
Acknowledgements
I would like to thank Richard Beare, Gavan Breen, Denis Burnham, Chris Callaghan, Linda Cupples, Kristine Rickard, Janet Turner and Sabella Turner for their assistance with this work, as well as three anonymous reviewers for their comments. This research was supported by a MARCS Auditory Laboratories internal grant, and by two grants from the Australian Research Council (DP0663825 and F00105978).
Appendix 1. Words used in the current study, grouped according to the target consonant
The orthographic form of the word is given in the left column. In the right column, the target consonant and immediately adjacent segments/boundaries are given in IPA, where # denotes a word/phrase boundary. Note that where # denotes a final boundary, the speaker may have chosen to produce a final non-phonemic vowel, which varies in quality between [a] and [ə] – however, whether or not this vowel was produced is not indicated in this table (see Tabain & Breen Reference Tabain and Breen2011).
Where a word was used in the analysis of only one speaker's data, this is noted in the left column (e.g. ‘JT only’ for the word ntyeme under category /c/).

Appendix 2. Full statistical results for the paired t-tests
In the Measures column, results significant at p < .05 are given in bold, and results which show a trend at p < .10 are given in non-bold.