The spring 2009 novel H1N1 pandemic strained many hospitals owing to record numbers of emergency department (ED) visits compounded with fewer hospital workers reporting for duty. More than a 50% surge in patient volume was seen in many adult EDs, and many pediatric EDs reported more than twice the volume of visits.1Reference Maugh2Reference Perez-Padilla, de la Rosa-Zamboni and Ponce de Leon3Reference Fiore4 Overall, a 32% jump in New York City (New York) ED visits has been reported since the onset of the H1N1 pandemic.Reference Hartocollis5 The National Center of Medical Intelligence expects infection rates of 50% for H1N1 and 20% for the seasonal flu this season.6 The Advisory Committee on Immunization Practices identified health care workers (HCWs) and people with certain medical conditions as priority groups for H1N1 vaccination.7 The financial strains placed on the economy owing to HCWs not reporting for duty during a pandemic may be high. For example, in a model illustrating the impact of an unmitigated influenza pandemic lasting 120 days with a serological infection rate of 25% resulted in approximately 3.4 hours lost in productivity per employee and cost $7.3 million in lost productivity in HCWs in the District of Columbia metropolitan region.
It is estimated that vaccinating only the priority groups identified by the Advisory Committee on Immunization Practices could save 81% of the total cost of lost productivity.Reference Yee, Brown and Cooley8 To optimize the health care workforce during a pandemic and prevent nosocomial spread, the World Health Organization announced on July 13, 2009, that HCWs in all countries should be vaccinated against H1N1 flu virus as a first priority. On August 13, 2009, the Emergency Order was filed in New York State mandating health care facilities to immunize persons employed by or affiliated with a facility against influenza.9
In the first phase of the current study, the impact of the H1N1 pandemic on employee health outcomes before vaccination was analyzed. The parameters used to assess employee health were laboratory-confirmed H1N1 data, laboratory-confirmed influenza A data, and employee sick hours records. Absenteeism rates were determined by departmental unit and by employee position. Peak absenteeism rates were also compared in time with the peak of H1N1 infections in the community. The second phase of this study will assess the impact of mandatory vaccination on HCW absentee rates and identify potential cases in which laboratory-confirmed H1N1 developed in HCWs who obtained the H1N1 vaccine. This article addresses the first phase of this study.
Health care workers in certain departments are at an increased risk for transmission of H1N1. For example, because transmission of H1N1 is effective in respiratory and aerosol transmission,Reference Fabian, McDevitt and DeHaan10Reference Carrat, Vergu and Ferguson11Reference Mubareka, Lowen, Steel, Coates, García-Sastre and Palese12 ED personnel, intensivists, and anesthesiologists may be at an increased risk owing to the many aerosol-producing procedures that they perform. Also, complying with universal precautions in certain departments may be difficult because of time restraints, the large degree of patient contact, and the simultaneous management of multiple patients.
A study has shown that in a large hospital setting, a major break in compliance among ED personnel was seen in 33.6% of all observed procedures, with improper or inadequate mask use occurring in 32% of the procedures.Reference Evanoff, Kim and Mutha13 Furthermore, physicians and nurses may be at an increased risk of H1N1 transmission as opposed to other hospital employees who are not directly involved in patient care. A study done in 5 European hospitals found that nurses' high degree of contact with potentially infectious persons places them at higher risk than the general population for infection during an influenza pandemic.Reference Bernard, Fischer, Mikolajczyk, Kretzschmar and Wildner14 The study showed that 129 nurses reported a median of 40 contacts per day (85% work-related), whereas 129 control subjects reported 12 contacts per day (33% work-related). The control subjects were recruited from the general population by an independent market research group and were matched in age, sex, and day of data collection with the nurses.
METHODS
We reviewed and analyzed the absentee records of HCWs of the NewYork-Presbyterian Hospital (New York, New York) system for a 3-month period from April through June 2009, and, for comparison, we used the absentee records during the same periods in 2008 and 2007. Computerized absentee records from the human resources department of 6,093 employees from 2 university medical centers, a freestanding pediatric hospital, a community hospital, and a behavioral health facility were analyzed. The mean sick hours for all employees during April through June were determined for 2007, 2008, and 2009. Data for 2007 were analyzed broadly across all employee categories. For 2008 and 2009, we compared the differences in mean sick hours from April through June for 6 different employee positions and 7 different employee departments.
The 6,093 employees were categorized into 6 general employee positions: physicians and medical personnel (n = 506), nurses and clinical technicians (n = 1634), social workers and counselors (n = 294), housekeeping and food service (n = 295), security and patient transportation personnel (n = 77), and administrative and technical support services (n = 3287). The authors were interested in studying absenteeism in 7 departmental units: adult ED (n = 52), pediatric ED (n = 20), pediatrics (n = 353), workforce health and safety (WHS; n = 21), ambulatory care (n = 504), intensive care units (n = 195), and anesthesiology (n = 45). Although there are many other departments in the hospital (internal medicine, surgery, dermatology, rheumatology, immunology, pathology, radiology, etc.) the authors only studied the absentee rates and infection rates in these 7 departments since we identified them as being at a higher risk for H1N1 transmission. Therefore, the total sample size for the 7 employee departments studied equals 1190 while the total sample size for the 6 employee positions equals 6093.
The absentee records from the human resources department were used to calculate the mean sick hours per employee. The mean sick hours represent the total unpaid and paid leave time owing to illness. They do not include leave time for personal reasons and, thus, are not a measure of total leave. To calculate the mean sick hours for the April-June period, we divided the total sick hours during this period by the total number of employees for a given category. To calculate the mean sick hours for the month of June alone, we divided the total sick hours for that month by the total number of employees for a given category. After employees were divided into categories, the mean sick hours per employee for each category was determined for the months of April through June (2008 and 2009) and for the individual months of April, May, and June (2008 and 2009).
The mean sick hours for all employees during the individual months of April, May, and June 2009 were compared with those for 2007 and to 2008 using a paired 2-tailed t test. The mean sick hours for all employees during April through June 2009 were compared with those for April through June 2007 and for April through June 2008, using a paired 2-tailed t test. Mean sick hours were analyzed according to the 6 employee positions and 7 departmental units for 2008 and 2009. We were interested in studying the change in mean sick hours between the nonpandemic years (2007 and 2008), and we analyzed the mean sick hours for each employee during the individual months of April, May, and June and during the entire April through June period using a paired 2-tailed t test. We considered a P value of .05 to be significant. We analyzed data using StatPlus:Mac for the Beta version of Microsoft Excel 2008 (Microsoft Corporation, Redmond, Washington).
Laboratory-confirmed case reports from computerized hospital records were obtained from the WHS Department. The 123 laboratory-confirmed cases were categorized according to the following employee positions: physicians and medical personel (n = 34), nurses and clinical technicians (n = 36), social workers and counselors (n = 3), administrative and support (n = 39), food services and housekeeping (n = 8), and security (n = 3). The laboratory-confirmed cases were also categorized according to the following departmental units: adult ED (n = 15), pediatric ED (n = 5), pediatrics (n = 19), ambulatory care (n = 8), WHS (n = 3), intensive care units (n = 8), and anesthesiology (n = 5). As mentioned earlier, although there are many other departments in the hospital besides these 7 departments, the authors chose to study these departments since we identified them as being at a higher risk for H1N1 transmission. Sixty-three out of the total 123 cases that were diagnosed during this time period occurred in these 7 departments. The remaining cases were thinly spread across many other hospital departments. Data were omitted from other departments since these cases were isolated infections. Infection rates were calculated as the number of infected cases per category divided by the number of employees in that category.
Specimens for employees with possible H1N1 were obtained using a nasopharyngeal swab within the first 72 hours of onset of symptoms and no later than 5 days after onset of symptoms. Flexible, fine-shafted aluminum swabs were used to obtain the nasopharyngeal samples. Remel M4RT (no refrigeration necessary) or Remel M4 (requires refrigeration) liquid transport medium was used to transport the nasopharyngeal swab to the microbiology laboratory for reverse transcriptase–polymerase chain reaction testing for H1N1 or Rapid Influenza Diagnostic Testing (RIDT) for influenza A. The Remel M4RT and Remel M4 media are produced by Remel, a division of Thermo Fisher Scientific (Lenexa, Kansas). The Rapid Influenza Diagnostic Test used was the QuickVue Influenza Test manufactured by Quidel Corp (San Diego, California).
RESULTS
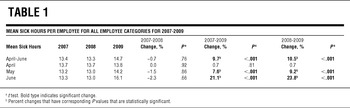
The comparison of mean sick hours for all employee categories for 2007 through 2009 is shown in Table 1. Before the mandatory distribution of the H1N1 vaccine to all HCWs, sick hours increased by 10.5% (P< .001) during April through June 2009, compared with 2008 and by 9.7% (P< .001) compared with 2007. During June 2009, mean sick hours for all HCWs increased by 23.7% (P < 001) compared with 2008 and by 21.1% (P < .001) compared with 2007. During May 2009, mean sick hours increased by 9.2% (P < .001) compared with 2008 and by 7.7% (P < .001) compared with 2007. During April 2009, mean sick hours increased by 0.1% (P = .88) compared with 2008 and by 0.1% (P = .81) compared with 2007. These results indicate that there was a small, insignificant difference in mean sick hours between 2007 and 2008, but a statistically significant increase in mean sick hours during the spring 2009 pandemic compared with 2008 and 2007. However, at the beginning of the pandemic, in April 2009, there was no statistically significant increase in mean sick hours if analyzed for all employee positions and departments.
Mean Sick Hours per Employee for All Employee Categories for 2007-2009

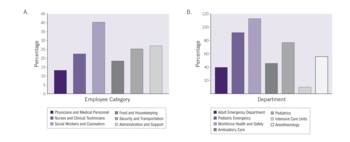
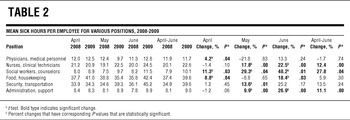
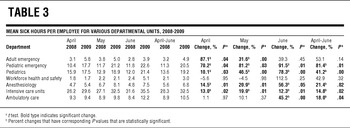
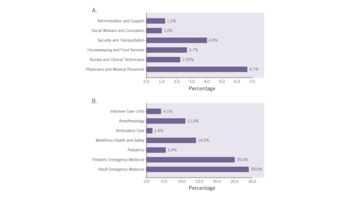
Table 2 and Table 3 show the comparisons of the mean sick hours by position and department during the spring 2009 pandemic with records from 2008. The increase in sick hours for all categories in June 2009 is compared with the previous year in Figure 1. Mean sick hours for physicians and medical personnel decreased for April through June, month of June alone increased. For all other employee groups, sick hours increased for April through June and in June alone. The individual department categories also had increased sick hours in April through June and in June alone.
Percentage increase in sick hours, 2009 vs 2008, calculated as follows: (June 2009 Mean Sick Hours − June 2008 Mean Sick Hours)/June 2008 Mean Sick Hours. A, Various employee positions. B, Various departments.

Mean Sick Hours per Employee for Various Positions, 2008-2009

Mean Sick Hours per Employee for Various Departmental Units, 2008-2009

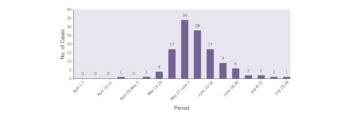
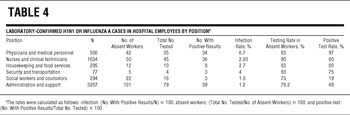
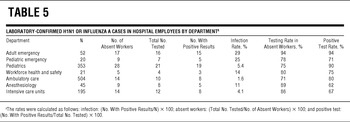
A total of 123 laboratory-confirmed cases of H1N1 in employees were found in the 5 hospitals studied. The distribution of cases across all categories, the testing rate in absent workers, the infection rate, and the positive test rate are shown in Table 4 and Table 5 for each employee category. A comparison of the infection rates for all categories is shown in Figure 2. The incidence of laboratory-confirmed cases of H1N1 in HCWs during the spring 2009 pandemic was plotted in 1-week periods (Figure 3). Two thirds of the laboratory-confirmed cases occurred during June alone.

The incidence of laboratory-confirmed H1N1 or influenza A cases in health care workers during the spring 2009 H1N1 pandemic.

Laboratory-Confirmed H1N1 or Influenza A Cases in Hospital Employees by Positiona

Laboratory-Confirmed H1N1 or Influenza A Cases in Hospital Employees by Departmenta

DISCUSSION
Like many other hospitals, the EDs of the NewYork-Presbyterian Hospital system received an increased surge of patients with influenzalike symptoms during the H1N1 pandemic. In the current study, about 49% of the reported cases of H1N1 in HCWs occurred in a population that constitutes less than 20% of the total HCW population. (Emergency medicine, pediatrics, ambulatory care, intensive care units, and anesthesiology made up 19.1% of the total HCW population studied.) The adult EDs on a day-to-day basis may experience a 10% flux in patient volume, but during the spring pandemic, the adult EDs of the hospitals studied experienced a 10% to 20% sustained increase in patient volume. The pediatric ED, which usually sees many fewer patients than the adult ED, experienced 3 times the normal patient volume. Not surprisingly, the pediatric ED experienced the highest statistically significant increase in sick hours during June 2009 compared with June 2008. The largest proportion of HCWs infected with H1N1 in the 7 departmental units studied was from the pediatrics department at 30% (19/63), the adult ED closely followed behind at 24% (15/63). The adult ED had the highest infection rate (15/16 [29%]; see Table 5) compared with other department categories.
An interesting point is that for June 2008 vs June 2009, social workers had the highest increase in sick hours per position (40.2%), but represented a minority of the HCWs who were infected by H1N1 (2.4%) and had the lowest infection rate (1.0%). Although in this study the mean number of sick hours used by social workers and counselors was lower than any of the other employee positions, their increase in mean sick hours during the H1N1 pandemic was higher than the other positions.
The percentage increase in mean sick hours is the variable of interest in the study. Employees in different professions vary in how much time they take for sick leave; what we are concerned with is how this varied year to year. In our study, the t test statistics for all months were statistically significant for the social worker and counselor category, which indicates that there was a distinct difference in mean sick hours between 2008 and 2009.
Because the social worker and counselor category had the highest increase in mean sick hours during the pandemic but the lowest infection rate, employees in this category were taking sick leave but were not infected with H1N1 or were not being tested for H1N1. In the latter case, social workers may not have gone to the WHS Department for testing because they are not directly involved in clinical care. In the former case, social workers may have taken sick leave although they were not infected to care for loved ones at home or perhaps to avoid becoming infected. Further studies that survey social workers and counselors on their reasons for taking sick leave during the H1N1 pandemic could test for the former situation. To test for the latter situation, we calculated the testing rate for H1N1 in absent workers across all employee categories (see Table 4). Because the testing rate for H1N1 was similar across all employee categories, we can effectively rule out discrepancies in testing rate as a lurking variable.
A similar study conducted by the Centers for Disease Control and Prevention during April and May used detailed information on 26 cases of H1N1 in health care personnel reported from 11 states. Job type was available for 25 HCWs: 5 registered nurses (20%), 4 nursing assistants (16%), 4 physicians (16%), and 12 staff in 10 other occupations. The department was also available for 25 HCWs: 10 outpatient (40%), 8 inpatient/acute care facility (32%), 2 long-term care facility (8%), and 2 ED (8%).Reference Harriman, Rosenberg and Robinson15 The distribution of H1N1 infection in this study was similar to that in our study, but it is difficult to compare the 2 studies because our study differed in several important aspects: (1) The Centers for Disease Control and Prevention used a sample of 26 cases from 11 states, whereas our study had a sample of 123 from 1 city. (2) Our study categorized EDs and inpatient departments into pediatrics and adult subcategories. (3) A higher proportion of patients in New York City may go to the EDs for care compared with other regions in the country. The Centers for Disease Control and Prevention reported that 40% of the HCWs infected were from ambulatory care clinics, whereas we found that only 6.5% of the cases were from ambulatory care clinics. Furthermore, our study reported a much higher proportion of cases from ED personnel (32% vs 8%). The lower rates of infection in ambulatory care clinics together with the higher rates of infection in the EDs in our study may have occurred because more people are likely to seek treatment in the ED as opposed to a primary care site in an urban setting.Reference Mandelberg, Kuh and Kohn16Reference Sun, Burstin and Brennan17
Another interesting result from this study was that the peak of infection in HCWs lagged slightly behind the peak of infection in the community. According to a New York City Department of Health telephone survey, the peak of the pandemic occurred during the first 3 weeks of May when about 7% percent of New Yorkers reported influenzalike symptoms.18 Based on virologic testing, the researchers knew that most of that influenzalike illness was due to the novel H1N1 strain. From this survey, the city estimated that 750,000 to 1 million people had “swine” flu in the spring of 2009. On June 12, 2009, the New York City Department of Health issued a statement that said H1N1 transmission appeared to be on the decline because fewer people were going to hospital EDs with influenzalike symptoms. Although citywide the rate of H1N1 transmission was on the decline during the first 2 weeks of June, in the current study population of HCWs, infection rates were still at their peak during this period. Figure 3 shows that the peak of H1N1 transmission in HCWs occurred from May 27 to June 9, 2009.
There are several important limitations of this study that should be addressed. First, differences in observed absenteeism rates among HCWs could have been attributed to other factors besides H1N1 infection. Other confounding variables such as differences in leave policies and income may have affected the ability of an employee to stay home when sick. The Family and Medical Leave Act of 1993 is applicable to all eligible faculty and staff of NewYork-Presbyterian Hospital.19 Under this act, employees must provide documentation by a health care provider to take sick leave. The department keeps track of the leave as sick hours taken by the employee per month and shares that information with the human resources department. Although all employees must provide documentation by a health care provider to take sick leave, not all employees may have taken sick leave if they were infected with H1N1. For example, previous studies have shown that employees with more senior and responsible positions take fewer sick leaves.Reference Jacomo, Sartor, Zandotti, Atlan-Gepner and Drancourt20Reference Sartor, Zandotti and Romain21 Thus, it is likely that people in positions such as senior attending physician, executive hospital administrator, and departmental director took fewer hours of sick leave than did employees in lesser ranked positions.
Also, differences in job schedule flexibility may have been an additional confounding factor. People in certain positions may have the advantage of scheduling their own work hours, whereas people in other positions may have a fixed schedule. Employees who can rearrange their schedules may not have taken formal sick leave because they may have scheduled the days when they were sick as personal days off. For example, people who are paid on an hourly basis as opposed to a salary basis may be less likely to have flexible schedules. As a result, there may be an overrepresentation in sick hours in certain administrative personnel, food and housekeeping personnel, and security personnel compared with personnel who are paid on a salary basis.
Another lurking variable that may exist is the unequal likelihood of HCWs from all departments to be tested for H1N1. If discrepancies in testing rates between employee positions exist, it is possible that HCWs involved in direct patient care may have been more likely to be tested for H1N1 than other employees who are not directly involved in patient care. For example, if social workers were less likely to be tested for H1N1 as opposed to physicians or nurses, the low incidence of confirmed H1N1 cases among social workers may not necessarily be attributed to more “worried well” cases in this category. To assess this potential bias caused by discrepancies in testing rates, we compared the positivity and testing rates in different employee categories. Table 4 shows the percentage of absent workers who were tested for 2009 H1N1 in each group. Because the testing rate in absent workers was similar among the different employee positions, it is unlikely that differences between employee categories were due to this bias. Also, the positive test rate in social workers and counselors was much lower than the other employee categories, which indicates that a smaller percentage of employees in this category who went to the WHS Department for H1N1 testing were infected with H1N1 compared with the other employee positions.
When comparing the percentage increase in mean sick hours in June 2009 with June 2008, the P values for the following categories were not statistically significant, although all experienced an increase in mean sick hours in at least one of the months: physicians and medical personnel (May and June), security and transportation (April and June), adult ED (June), and WHS (April, May, and June). The sample size could have been a contributing factor to the lack of statistical significance in some of these categories. For example, WHS (n = 21) and security and transportation (n=77) had the smallest samples for their respective categories. Although WHS experienced the highest increase in sick hours (May, 112.5%), the difference for this category was not statistically significant (P = .25). A large degree of variation in sick hours in the categories of adult ED and physicians and medical personnel may have explained the lack of statistical significance in these categories.
For example, the differences for physicians and medical personnel were not statistically significant for May and June, although the category experienced a 13.3% increase in sick hours during June and had the highest infection rate (6.7%) of laboratory-confirmed H1N1. The lack of statistical significance can be explained by the large degree of variation in sick hours within the category. For example, during of May, physicians and medical personnel had a 21.8% decrease in mean sick hours. Also, physicians and medical personnel had the lowest increase in sick hours during June (13.3%) compared with the other employee categories. These factors suggest that although there were many cases of infection within the physicians and medical personnel category, a sufficient proportion of the employees still reported to duty and may have worked despite illness during this period.
A similar finding can be seen with the adult ED, in which the difference for June was not statistically significant despite a 39.3% increase in mean sick hours. The adult ED experienced the peak in mean sick hours early in the pandemic, which suggests that ED personnel were at the forefront of the pandemic and wereinfected at the same time as the community. That the adult ED had the highest infection rate of H1N1 of all the employee categories suggests that although there were personnel in the adult ED who were infected, a sufficient proportion of the personnel reported to duty or perhaps worked despite illness as the pandemic continued.
We hope that the results of this study will be valuable for medical directors in identifying HCWs vulnerable to H1N1 infection. The issue of mandatory vaccination of HCWs is sensitive in public health. More studies are needed that identify populations of HCWs who should have priority for vaccination during vaccine shortages. Phase 2 of this study will be conducted after the mandatory administration of the seasonal flu vaccine and the H1N1 vaccine to compare employee health outcomes before and after vaccination. We believe studies illuminating the practical impact of mandatory vaccination on employee health will serve as essential tools in guiding ethical decision making during a pandemic.
Funding/Support: Dr Robert Bristow and Dr Jaclyn Vorenkamp are salaried by NewYork-Presbyterian Hospital and Cynthia Santos receives financial support for her research through stipends by Weill Cornell Medical School.