Introduction
With the emergence of drones in the last years, new problems arise especially concerning the sharing and the safety of the airspace. Thus, the detection and the localization of aircraft by unmanned aerial vehicles are essential to avoid collisions. The Automatic Dependent Surveillance-Broadcast (ADS-B) surveillance technology is more and more used by aircraft to broadcast periodically some information like their position to the air traffic control stations and/or to other aircraft. It is above all a cheap, simple, and reliable alternative to using expensive Radar technologies to locate aircraft from the ground. The position of aircraft is no more calculated and approximated from the Radars data but send by the aircraft themselves from embedded Global Positioning System. Nevertheless, the transmitted unscrambled information like location can be easily received and used by non-targeted users like drones or radio-amateurs.
Within the framework of the 21st French National Microwaves Days (JNM) at Caen (France) in 2019, a student contest was organized to highlight the best miniature receiving antenna for drones dedicated to the detection, localization, and avoidance of airliners by the use of ADS-B signals. During this contest, different antennas were tested and the most efficient was defined as the one, which has detected the farthest aircraft.
The signal processing needed to parse ADS-B messages and locate the aircraft during this competition was processed thanks to the Software Defined Radio (SDR) solution presented in [Reference Ferre, Tajan and Ghiotto1, Reference Laporte-Fauret, Tajan and Ferré2].
This paper presents the winning antenna, which is a compact array of four three-dimensional Planar Inverted-F Antenna (PIFA). According to the constraints imposed by the contest organization, this antenna is fully passive, has a maximal size inferior or equal to 80 mm × 80 mm × 20 mm, placed above the center of a 200 mm × 150 mm reflector plan emulating the top of a drone and connectable through a female SMA connector. This miniature antenna is tuned to be effective in the ADS-B band used in Europe, which is around 1090 MHz. It also has nearly circular polarization, a high aperture angle of 97° and a gain of +3.7 dBi.
Proposed antenna design
For the detection of ADS-B signals, patch and quasi-omnidirectional antennas are generally used. In [Reference Ferre, Tajan and Ghiotto1], a circularly polarized patch antenna by corner cut dedicated to ADS-B systems is presented. In [Reference Babani, Khamis, Bala and Mohammed3], this is a compact T-Slot patch antenna, which is presented for the same application. In order to detect the farthest aircraft, a quasi-omnidirectional and circularly polarized antenna seemed to us the appropriate choice. Moreover, the designed antenna should have good efficiency and a gain as high as possible. Thus, the proposed design consists of an array of four PIFA. Thanks to the compactness of each PIFA, it is possible to place four of them in the specified area and, thus, increase the global gain of the array. For instance, the design of a PIFA array with circular polarization for Nanosatellite application is proposed in [Reference Kurnia, Nugrobo and Prasetyo4]. Its size is about 100 mm × 100 mm and has a gain of +4.78 dBi at 2.35 GHz.
Antenna design
First, a single PIFA was simulated and optimized with HFSS software. Its geometry in Fig. 1 consists of a radiating element short-circuited to a ground/reflector plane (RP) by a shorting pin and a feeding point placed between the two planes (and close to the shorting pin). The RP size and position were chosen according to the contest size requirements. It has a dimension of 150 mm × 200 mm and the antenna size (without reflector) should not exceed 80 mm × 80 mm with a maximum height of 20 mm above the reflector.
Configuration of the antenna with single PIFA.

The antenna was designed on a FR4 substrate (thickness: 0.8 mm, dielectric constant: 4.4, dielectric loss tangent: 0.02). Table 1 shows the dimensions of the designed single PIFA that is not centered on the ground plane, thus anticipating the mounting position in the antenna array.
Geometrical parameters of a single PIFA antenna

The position of the feed point is controlled to have an input impedance of 50 Ω at the targeted frequency. The measured reflection coefficient as a function of the frequency plotted in Fig. 2(a) shows a good matching with less than −15 dB at 1.09 GHz. As seen in the radiation pattern in Fig. 2(b), the maximum gain of +4 dBi at 1.09 GHz was obtained for an elevation angle of 60° or equivalently for θ = 30°; where theta is the angle relative to the Oz-axis that is perpendicular to the antenna plane (i.e. the horizontal or xOy plane).
(a) Simulated reflection coefficient and (b) radiated pattern of a single PIFA antenna (xOz/φ = 0° cut – blue solid line – and yOz/φ = 90° – orange dash line –).

An array of four PIFA was designed by adding three other identical single PIFA at each corner of the FR4 substrate as presented in Fig. 3. Circular polarization was obtained with the relative phases of 0°, 90°, 180°, and 270° at the source ports.
Isometric and bottom view of the array PIFA antenna.

With previous parameters depicted in Table 1, the antenna array does not operate at the targeted frequency. Moving the feeding point at the center of each single patch surface (radiating plane), allows reaching a good matching at 1.09 GHz. The radiating surface has also been modified to a square (W 3 = L 3 = λ/4).
Figure 4(a) shows the reflection coefficient of the array of PIFA at each input port. The port 1 and 3 with a respective excitation of 0° and 180° give the same simulated value of the reflection coefficient while the ones at the port 2 (90°) and port 4 (270°) are the same.
(a) Simulated reflection coefficient at each port of the antenna; (b) the radiation pattern of the PIFA antenna array in two vertical planes: xOz/φ = 0° (blue solid line) and yOz/φ = 90° (orange dash line).
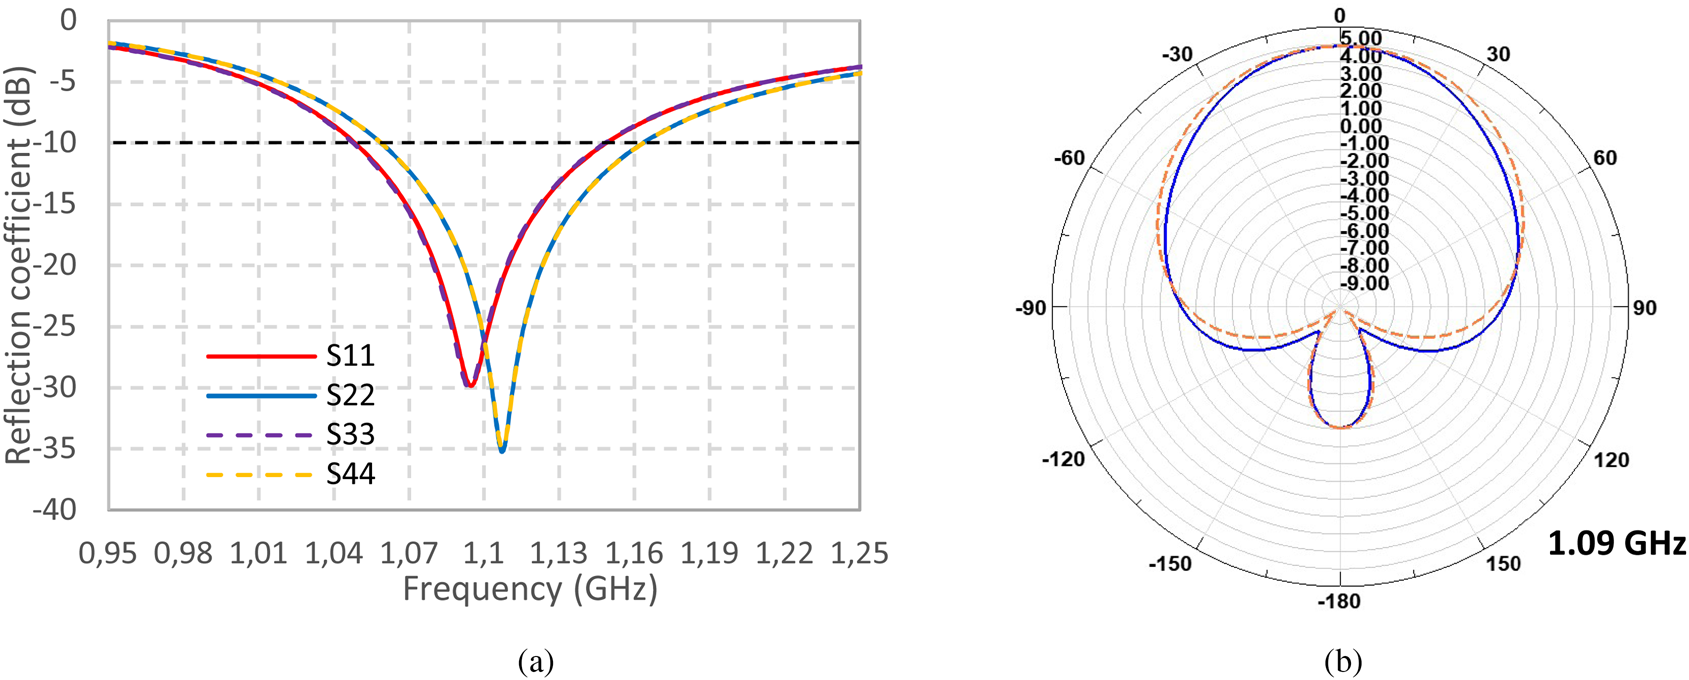
As depicted in Fig. 4(b), the miniature antenna array with quadrature feed can reach a maximum gain of +4.85 dBi oriented over the Oz-axis that is perpendicular to the antenna plane.
The rotation of the antenna array above the RP has an important impact on the axial ratio (AR). As a result of an optimization process, we found that the rotation of the array about 40° on the RP improves the most the AR. As seen in Fig. 5(a), the antenna has an AR bandwidth (AR < 3 dB) about [−50°; 50°].
(a) Variation of the axial ratio as function of the antenna rotation angle at φ = 0° and 1.09 GHz; (b) antenna rotation angle with the respect to the reflector.

Feed network
Instead of using four ports to feed the four PIFA, we decide to design a feed network (FN) based on the circuital model represented in Fig. 6. It was designed to have equal 6 dB power splitting and create 90° phase shift between each output signal.
Circuit model of the feed network.

Different structures of the feeding network are proposed in the literature. The system designed in [Reference Mohammadi, Piroutiniya and Rasekhmanesh5] is a combination of Wilkinson power dividers and two branch-line couplers in the 2.5 GHz band. Another design is proposed in [Reference Akbari, Farahbakhsh and Sebak6], consists of three T-junction in phase power dividers for 30 GHz frequency band. It exists a sequential rotation network (SRN) too, which could answer to our constraints [Reference Jazi and Azarmanesh7]. Figure 7 shows the chosen layout of the feeding network. It consists of a combination of transmission lines with different characteristic impedances and lengths connected by using a T-junction. They are used as an impedance transformer and a 90° phase shifter. Additionally, microstrip meander lines were used for the compactness in order to respect the specified area. Advanced Design System (ADS) Keysight software was used for the design, the simulation, and the optimization of this circuit. For accurate simulation, a Momentum simulation was performed. As presented in Fig. 7, the length of 50 Ω line was adjusted to λ/4 to allow the targeted phase shift between each antenna port. Z o corresponds to the equivalent impedance of the connected antenna in the port (50 Ω).
Layout and photograph of the fabricated quadrature feed network.

The FN was fabricated on Duroïd substrate (substrate thickness: 0.787 mm, relative permittivity: 2.3 and loss tangent: 0.0012) to allow lower losses. For the measurement, the four end-line ports were connected to a 50 Ω load to replace the impedance of the miniature antenna.
The input reflection coefficient of the circuit is presented in Fig. 8. The agreement between measurement and simulation is very good and the input reflection coefficient is less than −15 dB for the targeted frequency.
(a) Simulated (line) and measured (dashed line) of the reflection coefficient (at the input of the feed port); (b) The phase delay between port 1 and each of the others.

The measured power division/split shown in Table 2 is approximatively equal to 6 dB at each output port. The slight difference is mainly due to the compact size of the feeding network that does not allow a fully optimized design in the targeted area that is mainly identical with the maximum allowed surface (according to the JNM contest) for our antenna array (80 mm × 80 mm × 20 mm).
Measured power split and phase at each port of the feed network at 1.09 GHz

The port 4 with the lowest phase was chosen as the port reference of the FN. As depicted in Table 3, the FN satisfies a progressive 90° phase delay for other ports. The maximum phase error obtained is about +16.5° for the port 2. This difference is due to the last line connected to port 2, which is not exactly equal to λ/4.
Measured phase difference between output ports of the feed network at 1.09 GHz

Experimental results and discussion
A prototype of the array of PIFA with the F was manufactured and characterized (Fig. 9). The FN is placed at the top of the RP to have a compact prototype. In order to place the SMA connector and to avoid the short-circuit of the feeding point and the ground plane, a small gap was added between the RP and the circuit. With its RP and FN, the antenna array weighs approximately 145 g.
(a) Designed antenna on HFSS Software; (b) Photograph of the manufactured antenna.

As seen in Fig. 10(a), a good correlation of the S 11 between simulation and measurement was obtained with a frequency shift of only 30 MHz.
(a) Measured (dashed line) and simulated (continuous line) reflection coefficient at the input of the feed port of the PIFA array; (b) the simulated (continuous line) and measured (dashed line) gain for three vertical cut planes (φ = 0°, φ = 45°, and φ = 90°).

The measured gain presented in Fig. 10(b) was performed in an anechoic chamber. The φ angle corresponds to the cut plane of the RP. Φ angle equal to 45° means that the PIFA array without RP is perpendicular to the xOz plane. The measured result shows that the antenna has a maximum gain of +2.44, +3.7, and +1.94 dBi respectively, at φ = 0°, φ = 45°, and φ = 90°.
Comparing to the state of the art, the design proposed in this paper is a compact antenna array that worked at 1.09 GHz band with the highest gain. The antenna in [Reference Laporte-Fauret, Tajan and Ferré2] work at higher frequency (2.35 GHz) and have approximately the same size (100 mm × 100 mm) with a gain of +4.56 dBi. A compact circular polarized antenna of 0.11⋅λ0 × 0.11⋅λ0 × 0.02⋅λ0 at 1.21 GHz is presented in [Reference Ali, Saadh, Pathan and Biradar8] but with a low gain of +0.1 dBi.
Contest measurement results
Functional tests of the manufactured miniature PIFA (array) antenna were performed during the contest at the JNM conference in Caen with a radio software described in [Reference Ferre, Tajan and Ghiotto1]. This section presents the result of the detection global system (no ADS-B signal transmission) with the proposed manufactured antenna. An Universal Software Radio Peripheral (USRP) is used to process real ADS-B signals sent by the aircraft. Then, by using MATLAB and the algorithms presented in [Reference Laporte-Fauret, Tajan and Ferré2], we are able to decode in real-time the ADS-B baseband signals. In addition, we developed a MATLAB code that allows displaying the aircraft trajectories over a figure using an open street map. To validate the decoded trajectories, we can compare the results with the trackers available on the Internet (for example http://www.flightradar24.com). The USRP model employed during the challenge was a USRP B100. This USRP provides up to 16 MHz of bandwidth and it has a Xilinx Spartan 3A-1400 FPGA. However, the demodulation can be implemented on other SDRs. More details about the ADS-B standard and the decoding algorithm can be found in [Reference Laporte-Fauret, Tajan and Ferré2].
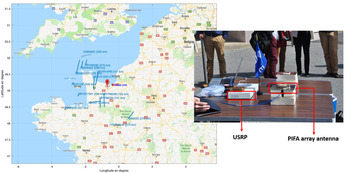
Figure 11 displays in real-time on a map, the trajectories of air traffic over the actual position with different airliners detected during the test. The maximum range of detection with the PIFA array antenna was 437 km.
Real-time trajectory on the map of the detected aircraft and a photo of the antenna during tests at the contest.

Conclusion
In this work, a miniature antenna consisting of an array of four PIFA antenna above a RP for the detection of airliners through the demodulation of ADS-B communications was proposed. The reflector emulates the top side of a drone. A quadrature FN was proposed, designed, and manufactured to achieve circular polarization of the array of PIFA.
The proposed antenna array is more compact than standard circular polarized patch antennas. Measured results demonstrate that the antenna provides a gain about +3.7 dBi with an AR under 3 dB. The performance of the antenna was validated with an adequate USRP receptor for ADS-B signal during the functional tests performed for the JNM’2019 antenna design contest and the maximum detection range of airliners was 437 km.
Acknowledgement
The authors wish to acknowledge the organizers of the JNM design contest. IEEE-MTT, AP France and Rogers Corporation supported this contest.
 Alassane Sidibe was born in Dakar, Senegal, in 1994. He received the M. Sc. degree in electronics of embedded system and telecommunications from the University Paul Sabatier of Toulouse in 2018. He is currently pursuing a Ph.D. degree in communication engineering with the French company Uwinloc. He has authored seven research articles and his current research interests include wireless power transmission and energy harvesting for battery-free tags.
Gael Loubet was born in Toulouse, France, in 1994. He received the Engineer Diploma in Electronics and Automation Engineering from the National Institute of Applied Sciences, Toulouse, in 2017, where he is currently pursuing his Ph.D. degree in micro- and nano-systems for wireless communications. He has authored three articles in refereed journals. His research interests include communicating materials paradigm, electromagnetic wireless power transfer, wireless communication for the Internet-of-Things applications, and wireless sensor networks for structural health monitoring applications.
 Alexandru Takacs (M’12) was born in Simleu Silvaniei, Romania, in 1975. He received the Engineer Diploma in electronic engineering from the Military Technical Academy, Bucharest, Romania, in 1999, and the master's and Ph.D. degrees in the microwave and optical communications from the National Polytechnic Institute of Toulouse, Toulouse, France, in 2000 and 2004, respectively. From 2004 to 2007, he was a Lecturer with the Military Technical Academy, and an Associate Researcher with the Microtechnology Institute, Bucharest. From 2008 to 2010, he occupied a postdoctoral position with the Laboratory for Analysis and Architecture of Systems (LAAS), National Center for Scientific Research (CNRS), Toulouse. During 2011, he was a Research and Development RF Engineer with Continental Automotive SAS France, where he was in charge of antenna design and automotive electromagnetic simulation. Since 2012, he has been an Associate Professor with the University Paul Sabatier, Toulouse, where he performs research within LAAS–CNRS. He has authored or co-authored five international patents, 30 papers in refereed journals, one book, one book chapter, and over 90 communications in international symposium proceedings. His research interests include the design of microwave and RF circuits, energy harvesting and wireless power transfer, small antenna design, electromagnetic simulation techniques, and optimization methods.
 Guillaume Ferré (Member, IEEE) graduated in electronic and telecommunication engineering (ENSIL) from the University of Limoges, France, in 2003. He received the Ph.D. degree in digital communications and signal processing from the Limoges University of Technology, Limoges, in 2006. From 2006 to 2008, he was a Post-Doctoral Researcher of the Limoges XLIM laboratory and the Laboratoire de l'Intégration du Matériau au Système (IMS), Bordeaux, France. Since 2008, he has been an Associate Professor with the Ecole Nationale Supérieure d'Electronique, Informatique, Télécommunications, Mathématique et Mécanique (ENSEIRB-MATMECA), an engineering school of Bordeaux INP. After several administrative responsibilities at the Telecommunications Department of ENSEIRB-MATMECA, he is currently the Director of industrial relations. He carries out his research activities at the IMS Laboratory, Signal and Image Team. These fields of research concern the circuits and systems for digital communications, including signal processing and digital communications for 5G, IoT, digital enhancement for wideband power amplifiers, and time-interleaved analog-to-digital converters. He is the author of more than 100 papers in international conferences. He is also the author of seven patents. He currently supervises five Ph.D. students with a significant part of industrial research activities. He is the Principal Investigator (PI) of many national and international projects. At the local level, he is responsible for two research activities related to the Internet of Things, including one to investigate on the smart campus. Dr. Ferré is a member of several technical program committees, including ICC, Globecom, ICT, and ICECS. In the IMS Laboratory, he holds the position of Vice-President of the Scientific Council. In 2019, he received as the author the Best Paper Award at the IEEE International Symposium on Personal, Indoor, and Mobile Radio Communications (IEEE PIMRC 2019), Track 4, entitled “An Enhanced LoRa-Like Receiver for the Simultaneous Reception of Two Interfering Signals.”
 Anthony Ghiotto (S’05–M’09–SM’15) was born in Aubenas, France, in 1982. He received the M.Sc. and Ph.D. degrees (Hons.) in optics, optoelectronics, and microwave engineering from the Grenoble Institute of Technology, Grenoble, France, in 2005 and 2008, respectively. From 2009 to 2012, he has held a postdoctoral research associate position at the Polytechnique Montréal, Montreal, QC, Canada. In 2012, he joined the Department of Electronics, ENSEIRB-MATMECA Engineering School, Bordeaux Institute of Technology, University of Bordeaux, Talence, France, and the Laboratory of Integration from Materials to Systems (IMS), University of Bordeaux, where he is currently an Associate Professor (with Full Professor habilitation). In 2016 and 2017, he has been a Guest Professor with the University of Pavia, Pavia, Italy. His current research interests include analysis, design, and integration of microwave and millimeter wave passive and active circuits in PCB [including substrate integrated waveguide (SIW) and air-filled SIW], dielectric waveguide, and BiCMOS and complementary metal-oxide-semiconductor (CMOS) technologies. Dr. Ghiotto was an Organization Committee Member of the 2015 European Microwave Week and the 2015 French National Microwave Days. He is a member of the Technical Coordinating Committee (TCC), the MTT-8 Filters and Passive Components Technical Committee, and the MTT-15 Microwave Field Theory Committee of the IEEE Microwave Theory and Technique Society (MTT-S). He was a recipient of the Young Scientist Award of the International Union of Radio Science in 2008, the Post-Doctoral Fellowship from the Merit Scholarship Program for Foreign Students of the Fonds Québécois de la Recherche sur la Nature et les Technologies of Québec in 2009, and the IEEE SPI Young Investigator Training Program Award in 2016 and 2017. Since 2017, he has been the Chair of the IEEE MTT French Chapter. He is the TPC Chair of the 2019 European Microwave Conference. He is an Associate Editor of the EuMA International Journal of Microwave and Wireless Technologies. He is a Technical Reviewer of the IEEE TRANSACTIONS ON MICROWAVE THEORY AND TECHNIQUES, the IEEE TRANSACTIONS ON ANTENNA AND PROPAGATION, the IEEE MICROWAVE AND WIRELESS COMPONENTS LETTERS, and the IEEE ANTENNAS AND WIRELESS PROPAGATION LETTERS. Since 2013, he has been the Counselor of the IEEE Student Branch of Bordeaux: the BEE Branch, and the Advisor of the MTT and AP BEE Branch Chapters.