Introduction
Drinking water scarcity is a major and increasing problem in both developing and developed nations. However, seawater and brackish water are abundant. Reverse osmosis (RO) desalination—the process of forcing seawater through a semipermeable membrane to remove salt ions and other contaminants—is one of the most promising routes toward large-scale freshwater reclamation.
Current commercial thin-film composite RO membranes are made from polymeric materials (typically polyamide), but there is great scope to develop advanced nanostructured RO membranes to mitigate energy and capital costs. These include nanoporous membranes built on ceramic–inorganic or metal–organic frameworks (such as zeolites), graphene membranes with precisely controlled porosity, biological membranes (e.g., aquaporin proteins), and membranes comprising aligned nanotubes (NTs). Reference Lee, Arnot and Mattia1
In this article, we focus on water flow through NTs, because of their high reported pure water permeabilities and controllable selectivity. The high flow rates arise from the smooth (low friction) inner surfaces of the NT material. For example, the internal surface/water friction of a carbon nanotube (CNT) has been found to decrease with decreasing diameter: the friction is graphene-like for CNT diameters D ≳ 20 nm, but falls to almost zero for D = 0.8 nm. Reference Falk, Sedlmeier, Joly, Netz and Bocquet2 The selectivity of ions and other dissolved material is also sensitive to the NT diameter, with near 100% salt ion rejection occurring for CNTs with a diameter of ∼0.8 nm, decreasing rapidly to 0% when the diameter increases to ∼2 nm. Reference Thomas and Corry3
Research into flows through NTs of different materials—such as carbon, boron nitride, and silicon carbide—is now just more than a decade old, but commercial membranes of aligned NTs are still not available. This is mainly due to the difficulty in manufacturing these membranes inexpensively in as close to their ideal form as possible—aligned, pristine NTs encapsulated in a robust, defect-free matrix, with a strictly controlled pore entrance chemistry and pore-size distribution, and a large active pore density.
Flows through NT membranes: A multiscale modeling challenge
Computational modeling of flows through NT membranes is a challenging problem; however, when combined with experiments, it can play a vital role in this materials research area. Simulations can provide useful scientific insights, for instance, into the large disparity in experimental results. They can also be used to quickly explore a much larger parametric space than would be feasible using experiments (e.g., various materials, operating pressures, NT diameters, and membrane thicknesses). Additionally, membrane simulations enable new ideas and concepts to be tested before launching complex experimental campaigns (e.g., modifying the NT inlet/outlet pore chemistry to control performance).
The major challenge in modeling flows through NT membranes is that conventional fluid models break down at nanometer-length scales (D ≲ 2 nm). For example, using the no-slip Hagen–Poiseuille (HP) fluid equation to calculate the flow rate through a NT has been found to underpredict experimental results for NTs by two to five orders of magnitude;
Reference Majumder, Chopra, Andrews and Hinds4–Reference Qin, Yuan, Zhao, Xie and Liu7
there is a substantial NT flow increase above what is expected. The “flow enhancement factor,” E, is often used to compare the observed flow rate,
 $\dot m$
, with conventional predictions:
 $$E = {{\dot m} \mathord{\left/ {\vphantom {{\dot m} {{{\dot m}_{{\rm{HP}}}}}}} \right. \kern-\nulldelimiterspace} {{{\dot m}_{{\rm{HP}}}}}},$$
where the no-slip HP flow rate is:
 $${\dot m_{{\rm{HP}}}} = {{{\rm{\pi }}{D^4}{\rm{\rho \Delta }}P} \over {128{\rm{\mu }}L}}.$$
Here, D is the NT diameter, ρ is the fluid density, ΔP is the overall applied pressure drop, μ is the fluid viscosity and L is the length of the NT. The large flow enhancement observed in NTs is thought to be due to the different molecular and non-continuum flow behavior when water is highly confined within sub-2-nm diameter tubes, including slip at the tube walls, molecular ordering, and nonlocal viscosity—all of which may also be diameter dependent. Even with adjustments for fluid slip (e.g., the Navier slip equation), the HP model of Equation 1 still does not operate well for D ≲ 2 nm, as it fails to capture these crucial non-continuum phenomena. Reference Holland, Lockerby, Borg, Nicholls and Reese8
Molecular dynamics (MD) simulations, in which the movements and interactions of all the NT and fluid molecules are tracked in time and space, produce higher fidelity results. However, the NTs used in membrane experiments are generally μm–mm long, with active areas a few μm2. Reference Holt, Park, Wang, Stadermann, Artyukhin, Grigoropoulos, Noy and Bakajin5 These dimensions are too large to be treated by simulations alone, even using the fastest supercomputers.
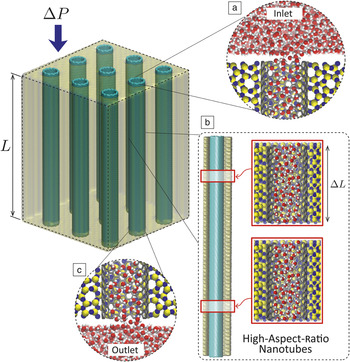
Multiscale flow modeling is an economical and accurate alternative that exploits smaller and computationally less expensive molecular simulations to solve larger problems in time and space. Reference Lockerby, Duque-Daza, Borg and Reese9–Reference Borg, Lockerby and Reese11 Figure 1 shows an example of how an ideal NT membrane of laboratory dimensions can be treated using a multiscale technique. The key is to identify features of the membrane that are scale-separated in both time and space and do not require molecular simulation. This enables the molecular resolution to be reduced; fewer molecules and time steps are needed in the simulation overall, so large computational savings can be achieved.
Schematic of multiscale model of a filtration membrane comprising aligned carbon nanotubes within a silicon nitride matrix, similar to the experimental setup in Reference Reference Holt, Park, Wang, Stadermann, Artyukhin, Grigoropoulos, Noy and Bakajin5. The major contributors to pressure losses (ΔP) in this ideal system are (a) membrane inlets, (b) friction in high-aspect-ratio nanotubes, and (c) membrane outlets. L is the length of a nanotube and ΔL is a representative streamwise length of the molecular dynamics subdomain of the nanotube.

An individual NT is a high-aspect-ratio conduit. Non-continuum fluid effects mainly occur across the cross section of the tube, and these are scale-separated from variations in the flow direction. Macroscopic streamwise pressure and velocity change gradually along the NT and are much slower processes than the microscopic agitation of molecules that are costly to resolve by MD. The flow through the NT can, therefore, be modeled without much loss in accuracy, by representing the NT itself as smaller MD sections of length ΔL (as shown in Figure 1), that are coupled with one-dimensional (1D) equations of fluid mass continuity and momentum conservation applied in the streamwise direction alone.
This multiscale treatment is called the internal-flow multiscale method (IMM), Reference Borg, Lockerby and Reese11–Reference Patronis, Lockerby, Borg and Reese13 and has been created in order to deal with high-aspect-ratio flows that are characteristic of liquids in NTs, rarefied microgas applications (such as MEMS pumps, Reference Lockerby, Duque-Daza, Borg and Reese9,Reference Lockerby, Patronis, Borg and Reese10 lubricating bearings, Reference Patronis, Lockerby, Borg and Reese13 and microcrack flows Reference Docherty, Borg, Lockerby and Reese14,Reference Docherty, Borg, Lockerby and Reese15 ) and other systems. In the IMM, the coupling between microscopic MD and macroscopic (1D fluid) models occurs during the simulation. The macroscopic model assigns the local pressure gradients to each MD subdomain via microscopic forces. These then produce individual flow rates in the MD subdomains that correct the governing continuity and momentum equations, which, in turn, supply new forces back to the MD subdomains. This process repeats until, in steady state, the flow through all MD subdomains is exactly the same. The result is the solution to the problem.
The key advantage of a multiscale formulation such as this is that it is free of any of the constitutive or boundary approximations Reference Kevrekidis, Gear, Hyman, Kevrekidis, Runborg and Theodoropoulos16 that make other computational methods invalid. The downside is that the spacing between the MD subdomains needs to be found by trial and error—although this would correspond to the grid- and time-dependency studies that are required to ensure accurate conventional computational fluid dynamics (CFD) solutions. For water flowing along a NT, the strong hydrogen bonds in water ensure incompressibility, even when molecules pass single-file along the tube (i.e., when D = 0.81 nm); so usually only one MD subdomain is needed to accurately describe any length of NT conveying water. This results in enormous computational savings of ∼L/ΔL, where L ∼ μm–mm is the length of the NT (or the thickness of the aligned NT membrane) and ΔL ∼ nm is the representative streamwise length of the MD subdomain in the NT. The computational savings over a full MD simulation of the entire NT can be as high as a factor of ∼106. Reference Lockerby, Patronis, Borg and Reese10,Reference Borg, Lockerby and Reese11
Thinner NT membranes (i.e., shorter NTs) experience relatively large pressure losses at the inlet and the outlet of the membrane. Reference Nicholls, Borg, Lockerby and Reese17 In these multiscale simulations, the inlet/outlet regions (see Figure 1a,c) need to be resolved using MD as well, and connected seamlessly within the IMM, for better prediction of the overall mass flow rate. Reference Borg, Lockerby and Reese18,Reference Ritos, Borg, Lockerby, Emerson and Reese19 The inlet’s inclusion in the multiscale model is in any case needed in order to capture the molecular detail of the steric hindrance that is the basis of the membrane’s filtration capabilities.
The simulation results we present here assume steady water flow in ideal membranes with perfectly aligned and distributed NTs of equal diameter; our results are for just one NT taken from a section of the membrane, which is sufficient to make flow predictions for the whole membrane. The IMM technique can also be applied to nonideal scenarios, including gradual variations in the cross section of the nanoscale conduit, Reference Borg, Lockerby and Reese12 unsteady/time-dependent flows, Reference Lockerby, Patronis, Borg and Reese10,Reference Borg, Lockerby and Reese11 conduits with local wall defects, Reference Borg, Lockerby and Reese18 general networks of connected and bifurcating channels, Reference Stephenson, Lockerby, Borg and Reese20 as well as vacancy defects distributed along the NT. Reference Nicholls, Borg, Lockerby and Reese21
Flow results for NTs of different materials
In a multiscale flow simulation, the necessary coupling between the MD simulation and the continuum fluid formulation can be of three forms—concurrent (i.e., the MD simulations run continually with the continuum simulation), Reference Borg, Lockerby and Reese11,Reference Ritos, Borg, Lockerby, Emerson and Reese19 sequential (i.e., MD presimulations first generate flow data as multidimensional libraries/interpolants, which are then used by subsequent continuum simulations), Reference Holland, Lockerby, Borg, Nicholls and Reese8,Reference Walther, Ritos, Cruz-Chu, Megaridis and Koumoutsakos22 or adaptive sequential/concurrent (i.e., using machine learning to switch optimally between the concurrent/sequential approaches). Reference Stephenson, Kermode and Lockerby23
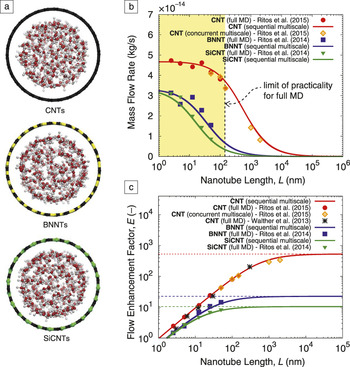
We now present multiscale results from both concurrent and sequential simulations of pressure-driven water flows through NTs of different materials, but with fixed pressure drops and similar diameters: Reference Ritos, Borg, Lockerby, Emerson and Reese19,Reference Ritos, Mattia, Calabrò and Reese24 CNTs with D = 2.034 nm, boron nitride nanotubes (BNNTs) with D = 2.072 nm, and silicon carbide nanotubes (SiCNTs) with D = 2.062 nm (see Figure 2a). In the absence of reliable experimental results, full MD simulations are used as benchmark solutions for NTs up to around L = 150 nm, beyond which MD is too computationally expensive to be practical.
Molecular dynamics (MD) and multiscale simulations of pressure-driven water flow in nanotubes (NTs) of three different materials. (a) Cross sections of the water molecules in carbon nanotubes (CNTs), boron nitride nanotubes (BNNTs), and silicon carbide nanotubes (SiCNTs). Reference Ritos, Mattia, Calabrò and Reese24 Simulation results for (b) mass flow rate and (c) flow enhancement with varying NT length (i.e., membrane thickness). Full MD results are presented up to L = 150 nm. Multiscale methods enable thicker membrane sections to be simulated, and are indicated here by solid lines (for sequential coupling results) and open symbols (for concurrent coupling results). Reference Ritos, Borg, Lockerby, Emerson and Reese19,Reference Walther, Ritos, Cruz-Chu, Megaridis and Koumoutsakos22,Reference Ritos, Mattia, Calabrò and Reese24

Figure 2b shows mass flow rate results for a single NT, with increasing NT length L up to around 1 mm. There is generally good agreement between the MD comparison simulations (filled symbols) and the multiscale simulations (lines and open symbols) for the three NT materials. As these three cases are for NTs of nearly the same diameter, Figure 2b also indicates clearly that the NT material plays an important role in the flow behavior. CNTs seem to exhibit the lowest internal surface/water friction, which is evident from the higher flow rates and the persistent tail in the flow rate curve as the membrane gets thicker. BNNTs and SiCNTs, however, have higher surface/water friction. This is possibly due to the “rougher” interaction energy landscape experienced by water in contact with a mixed chemical species NT, as opposed to the CNT, which is a single chemical species. Reference Falk, Sedlmeier, Joly, Netz and Bocquet2 This behavior has also been demonstrated in the variation of the flow enhancement factor with NT length (i.e., membrane thickness), shown in Figure 2c. In all three materials, the losses within the NT are minimal for the thinner membranes (L ≲ 20 nm), and the dominant losses occur at the inlet—so the enhancement factor increases steadily with tube length. For the thicker membranes typical of experiments and lab prototypes, the small but finite friction in the tubes generates most of the pressure losses, so the main pressure loss shifts gradually from the inlet of the NT to the central part of the tube as the NT lengthens. This explains the leveling off of the flow enhancement factor at an upper limit (the horizontal dotted lines in Figure 2c). Reference Ritos, Borg, Lockerby, Emerson and Reese19,Reference Walther, Ritos, Cruz-Chu, Megaridis and Koumoutsakos22 This upper limit is the same as for a flow in an infinitely long NT (i.e., with no inlet/outlet considered) and is the largest possible enhancement that can be achieved for a given D.
The benefit of these multiscale simulations over full MD now becomes clear. Full MD simulations of NTs of laboratory lengths are computationally intractable, while smaller periodic MD simulations representing “infinitely long” NTs only provide the maximum E (they do not provide information about the variation of E with L, or of
 $\dot m$
with L). Only by using a multiscale simulation is it possible to provide insight into the performance of a particular membrane configuration (i.e., with a given NT material of diameter D and length L, and with known inlet/outlet topography and chemistry), and to determine whether it is operating at its maximum flow enhancement or not. Our maximum predicted enhancement factors are: E = 530 for CNTs when L ≳ 10 μm, E = 22 for BNNTs when L ≳ 2 μm, and E = 10 for SiCNTs when L ≳ 0.7 μm.
Comparison with experiment
Experiments to date have been carried out predominantly on pressure-driven flows through CNT membranes, mostly because CNTs offer the largest flow enhancement of all synthesized NT materials, while resisting biofouling and bacterial adhesion at the same time. Reference Baek, Kim, Seo, Kim, Lee, Kim, Ahn, Bae, Lee, Lim, Lee and Yoon25,Reference Lee, Baek, Lee, Jeong, Lee, Yoon and Kim26 The range of measured flow enhancement factors is staggering; there are two to five orders of magnitude in E between CNTs of similar diameters, with no particular evidence of correlation between these experiments. This disparity in the experimental data has been a source of considerable debate over the past decade, with many open questions about the quality of—and possible errors in—the experiments. Reported flow enhancements predicted by MD are less scattered, but differences can be caused by the choice of intermolecular force fields Reference Liu and Patey27 and temperature-control parameters. Reference Thomas and Corry28 Multiscale simulations rely on MD to provide the molecular detail and can suffer the same drawbacks.
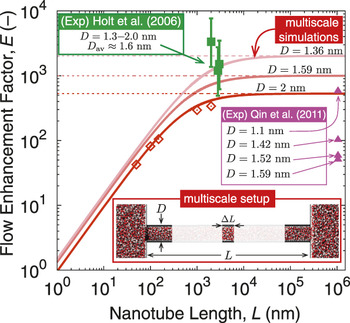
Figure 3 shows multiscale simulation results of the flow enhancement varying with CNT length for three CNT diameters: D = 1.36 nm, D = 1.59 nm, and D = 2.034 nm. These diameters were chosen because of their prospective importance in water filtration. Qin et al. Reference Qin, Yuan, Zhao, Xie and Liu7 and Holt et al. Reference Holt, Park, Wang, Stadermann, Artyukhin, Grigoropoulos, Noy and Bakajin5 are the only reported experiments that seem to exist within this diameter range. Multiscale simulations now enable us to make direct comparisons with these experiments, whereas full MD simulations would be far too time-consuming. Qin et al. conducted an experiment with a 1-mm-long NT. Comparing these results with one data point from MD would take around three centuries on the fastest supercomputer. Our concurrent multiscale simulation, however, required only 16 weeks Reference Ritos, Borg, Lockerby, Emerson and Reese19 —a factor of 1000 saving in computation time. The multiscale simulations for Figure 3 used MD subdomains with water/carbon potentials calibrated from independent experiments of droplets on graphitic surfaces. Reference Ritos, Dongari, Borg, Zhang and Reese29 These multiscale results agree reasonably well with the experiment of Holt et al. Reference Holt, Park, Wang, Stadermann, Artyukhin, Grigoropoulos, Noy and Bakajin5 However, the results of Qin et al. (e.g., see D = 1.59 nm) do not agree with the multiscale simulations (or the results of Holt et al. either) by at least two orders of magnitude; there is no understanding currently of why there is such a large discrepancy in these data.
Comparison of sequential (solid lines) and concurrent (open symbols, D = 2 nm) multiscale results for the flow enhancement factor with the experimental data of Holt et al. Reference Holt, Park, Wang, Stadermann, Artyukhin, Grigoropoulos, Noy and Bakajin5 (squares) and Qin et al. Reference Qin, Yuan, Zhao, Xie and Liu7 (triangles) for carbon nanotubes with diameters as noted. Inset: schematic of the multiscale setup.

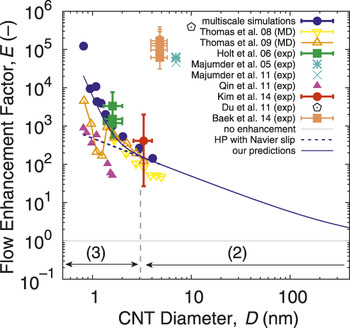
Figure 4 Reference Majumder, Chopra, Andrews and Hinds4–Reference Qin, Yuan, Zhao, Xie and Liu7,Reference Ritos, Borg, Lockerby, Emerson and Reese19,Reference Baek, Kim, Seo, Kim, Lee, Kim, Ahn, Bae, Lee, Lim, Lee and Yoon25,Reference Kim, Fornasiero, Park, In, Meshot, Giraldo, Stadermann, Fireman, Shan, Grigoropoulos and Bakajin30–Reference Thomas and McGaughey33 shows the influence of CNT diameter on the flow enhancement for thick membranes (i.e., L → ∞; maximum E for any D), including data from molecular dynamics, experiments, and sequential multiscale simulations. The clear trend in Figure 4 is that the flow enhancement E increases with decreasing CNT diameter D, with three regimes observed: (1) no flow enhancement (E = 1) for D ≳ 1 μm (not shown in Figure 4), and the no-slip HP flow model is applicable; (2) flow enhancement varies proportionally to ∼ 1/D, for 3 nm ≲ D ≲ 1 μm, and the HP model with Navier slip at the walls is applicable provided the slip length is known (∼60 nm for graphene and for CNTs with large D); and (3) flow enhancement increases rapidly for D ≲ 3 nm, and the Navier slip condition with a fixed slip length is no longer valid.
Comparisons of maximum flow enhancement with carbon nanotube (CNT) diameter between various molecular dynamics (MD), Reference Thomas and McGaughey32,Reference Thomas and McGaughey33 multiscale, Reference Ritos, Borg, Lockerby, Emerson and Reese19 and experimental results. Reference Majumder, Chopra, Andrews and Hinds4–Reference Qin, Yuan, Zhao, Xie and Liu7,Reference Baek, Kim, Seo, Kim, Lee, Kim, Ahn, Bae, Lee, Lim, Lee and Yoon25,Reference Kim, Fornasiero, Park, In, Meshot, Giraldo, Stadermann, Fireman, Shan, Grigoropoulos and Bakajin30,Reference Majumder, Chopra and Hinds31 Flow regimes (2) and (3) inside the nanotube are also indicated. Note: HP, Hagen–Poiseuille.

This last regime is pivotal to the success of next-generation RO membranes, but requires knowledge of the unconventional behavior of the slip length as well as the inlet/outlet losses; only multiscale simulations and experiments can provide this insight up to laboratory and prototype scales. The solid blue line in Figure 4 represents results from the established models for regimes (1) and (2), with results from our multiscale simulations in regime (3). While there is reasonable agreement between our multiscale simulations and the experimental results of Kim et al. Reference Kim, Fornasiero, Park, In, Meshot, Giraldo, Stadermann, Fireman, Shan, Grigoropoulos and Bakajin30 and Holt et al., Reference Holt, Park, Wang, Stadermann, Artyukhin, Grigoropoulos, Noy and Bakajin5 and qualitative agreement in trends with Qin et al., Reference Qin, Yuan, Zhao, Xie and Liu7 it is still unclear why there exists such a substantial difference between these and the subset of experimental results Reference Majumder, Chopra, Andrews and Hinds4,Reference Du, Qu, Xia, Feng and Dai6,Reference Baek, Kim, Seo, Kim, Lee, Kim, Ahn, Bae, Lee, Lim, Lee and Yoon25,Reference Majumder, Chopra and Hinds31 clustered in the top part of Figure 4.
Summary
The future of materials for filtration technologies looks bright. Lower costs could be achieved by developing membranes with a high density of aligned NTs and high water flow rates, Reference Elimelech and Phillip34 with evidence pointing toward carbon as the front-runner material. In this article, we have described how advances in multiscale flow modeling mean we can now start to understand the flow of water in NT membranes of different materials, pore diameters, and thicknesses. Our multiscale simulations indicate that the flow enhancement through the NTs (a) increases with NT length until it levels off at a limit (for a given diameter) dependent on the NT material, and (b) increases with decreasing diameter of long carbon NTs in three identifiable regimes.
There is still considerable uncertainty in current experimental and molecular simulation results. In molecular simulations, questions remain about the correct intermolecular potential models to use in high confinement, and the actual slip length of water inside NTs. The wide variance in empirical results means that experiments should be repeated many times in the future, across a wider range of NT diameters, with protocols in place to ensure the NTs are pristine and that the flow rate being measured is that through the actual tubes. What is certain, however, is that multiscale methods have the potential to produce useful results with molecular specificity in both time and space, at a fraction of the computational cost of full MD simulations. Multiscale modeling not only offers a radical and practical opportunity to contribute to the structural and materials design of future membranes, but it can also guide future experimental campaigns for a range of other micro-/nanoflow systems.
Acknowledgments
This research is financially supported in the UK by the Engineering and Physical Sciences Research Council under Grant Nos. EP/K038621/1 and EP/N016602/1, and an ARCHER Leadership Grant. Supporting data are available open access at: http://dx.doi.org/10.7488/ds/1475.

Matthew K. Borg is a lecturer in mechanical engineering at The University of Edinburgh, UK. He obtained his B.Eng. degree in engineering from the University of Malta, and his PhD degree in 2010 from the University of Strathclyde, UK, in nanoscale fluid dynamics. His research interests focus on designing next-generation micro-/nanoflow technologies using state-of-the-art computational models with molecular fidelity but low computational cost. Borg can be reached by phone at +44(0) 131 650 5965 or by email at matthew.borg@ed.ac.uk.

Jason M. Reese has been Regius Professor of Engineering at The University of Edinburgh, UK, since 2013. He is a graduate of both Imperial College London and the University of Oxford, UK. He was formerly a lecturer at the University of Aberdeen, and in King’s College London, UK. In 2003, Reese joined the University of Strathclyde, UK, as Weir Professor of Thermodynamics and Fluid Mechanics. His research focuses on non-continuum fluid dynamics, particularly at the micro- and nanoscales. He is a Fellow of the Royal Academy of Engineering and the American Physical Society. Reese can be reached by phone at +44(0)131 651 7081 or by email at jason.reese@ed.ac.uk.