Technological developments have increased citizens’ ability to directly contact elected officials in recent years. According to US Congress reports, the volume of constituent communications has grown dramatically in recent decades. The number of emails and letters received by Congress quadrupled from 1994 to 2005,Footnote 1 and around half of all US voters report having contacted one of their members of Congress in the past five years.Footnote 2 This development is also seen in other contexts,Footnote 3 and points to the importance of studying how politicians respond to citizen-initiated direct contacts.
Most studies on politicians’ responses to citizen-initiated contacts have been conducted in the US context thus far.Footnote 4 Butler and BroockmanFootnote 5 and BroockmanFootnote 6 send emails from fictitious citizens to US legislators and find that responses are dependent on the personal background (race) of both the sender and the receiver. Using a similar experimental design, Butler, Karpowitz and PopeFootnote 7 ask actual individuals to send letters to American legislators and find that representatives are more likely to respond to service requests than to requests for changed policy. HardenFootnote 8 comes to a similar conclusion about US politicians’ willingness to respond to service requests, based on online survey experiments in which legislators describe how they would respond to citizen-initiated email contacts. In one of the few non-US studies, Richardson and JohnFootnote 9 study the UK system by measuring how local politicians respond to lobby groups. Their results show that local UK politicians put more effort into their responses when emails contain rich information, from which they conclude that more resourceful groups are met with greater seriousness.Footnote 10
Although these studies provide useful insights into the candidate-centered US system,Footnote 11 and although there are examples of studies outside the US context, there is still much to be explained regarding the determinants of responsiveness in party-centered systems. Most importantly, the role of political parties for politicians’ responsiveness is under-studied. In party-centered systems, politicians have to balance citizens’ views not only against their own views, but also against their party’s positions. We know little about how politicians balance these potentially conflicting wishes when deciding how to respond to citizen-initiated contacts.
We also need to learn more about how politicians respond to policy requests as opposed to service requests.Footnote 12 In democratic states with comprehensive welfare state systems, which are common in party-focused Europe, civil servants are expected to attend to most service requests from the public. Requests to political candidates can therefore be expected to be relatively more policy oriented, and understanding responses to policy requests is crucial for understanding representation in those contexts.
Finally, we need to carry out research that explores different ways in which politicians respond to citizen requests. Research that only examines whether or not a politician responds to a letter or email may miss other important steps that a legislator takes. This is especially important in party-centered systems, where politicians may focus their efforts on trying to encourage change within the party structure. If we only look at how they respond directly to citizens, we may underestimate politicians’ level of responsiveness.
This article aims to provide new insights into processes of political responsiveness in party-centered systems. Unlike previous studies on responsiveness, we focus on the party as an actor that likely impacts the extent to which (and how) representatives act responsively. Furthermore, since previous research has focused mainly on direct and formal responses to citizen contacts, we identify the need to understand how politicians are also responsive in indirect and informal ways. A representative can work behind the scenes and be indirectly responsive by trying to influence the party. Our study aims to capture such complexities embedded in the process of responsiveness by focusing on what happens when politicians in a party-centered system learn that citizens agree with them on a policy that is not in line with their party’s position. We gained unique insights by conducting a large-scale survey experiment with 2,547 Swedish politicians elected to local-, regional- and national-level positions. We presented scenarios to the politicians that involved citizens making contact to request shutting down a school. School shutdowns are frequent in the Swedish political context, and constitute situations in which politicians, voters and parties can have different policy positions in different cases. By using a fictitious school shutdown as a scenario, we can credibly vary the party’s position, the politician’s opinion, and whether or not his or her own voters initiate contact. In addition to contributing a theoretical focus on the interplay between the party, the individual politician and the contacting citizens, we define policy responsiveness more broadly than is common in the empirical literature. We measure both adaptive and communicative responsiveness, more specifically (and following the reasoning of Esaiasson, Gilljam and Persson),Footnote 13 the politicians’ willingness to adapt, listen and explain.
Politicians’ Incentives to Respond to Citizen-Initiated Contacts
The calculations made by politicians who want to respect the party, take their own convictions into consideration and be responsive to citizen requests are most likely quite complicated. In the wider literature on political representation, these different devotions are often studied as separate phenomena rather than as a complex interplay between sometimes contradictory and/or complementary incentives to behave responsively. One common approach is to study individual representatives independently of the party they represent.Footnote 14 Individual politicians are in this case single-minded seekers of personal re-election, therefore the party’s position should not significantly influence how they respond to public opinion. Instead, their own convictions – and the likelihood that the citizens will vote for the individual politician – influence how politicians act.Footnote 15 Such a candidate-centered approach neglects the fact that in party-centered systems, and in situations in which the party and the citizen disagree, a politician’s personal re-election is likely dependent on his or her sticking to the party position.Footnote 16 What is more, representatives, certainly in party-centered systems, tend to want to represent the party’s position, and not just the position of the citizens or their own opinion.Footnote 17
Another common theoretical point of departure in the literature on political representation is that parties are coherent units with members who are always motivated by party victory.Footnote 18 Individual politicians’ responses to citizens depend in this case on the party’s position on the issue and on whether their response will increase the likelihood of getting the party elected. Such a party-centered approach does not take into account that membership in parliament is granted to individuals, not to parties, and that decisions in parliaments are made by individuals, not by parties. Moreover, even though the party has the final say in a representative’s political career in many political systems, personal contacts and support in the electorate positively affect the likelihood of being placed high on the party list.Footnote 19
A more reality-based perspective is to assume that different factors play a role when politicians decide how to respond to citizen requests. It is likely that the party’s position, the politician’s own opinion and the contacting citizens all influence the politician’s response. We should also assume that these incentives interact with (and depend on) each other.
The Concept of Responsiveness
There are different ways for a politician to respond to citizen-initiated contacts. A classical interpretation of democratic responsiveness is that representatives adjust their political decisions to the views of the public. On the aggregated level, this means that public opinion in some sense should leave its mark on the output of the political system.Footnote 20 On the individual level, in the relationship between the citizen and her representative, such adaptive responsiveness means that the representative votes, writes motions or in other ways acts to affect decisions in accordance with the view of the represented.Footnote 21
However, the adaptive form of responsiveness is a narrow view of how representatives interact with citizens. ‘Congruence’ and ‘incongruence’ between citizens and representatives does not capture all aspects of how representatives respond to citizen requests. Nor does it comply with commonly applied normative theories that underline that the views of the represented do not always go hand in hand with the interests of the represented. Representatives are not normatively obliged to adapt to the views of contacting citizens. Instead, where there is a conflict, political representatives should provide a good explanation of why the wishes of the represented are not in accord with the interests of the same.Footnote 22 This normative demand to communicate the reasons why an action is not in accordance with the wishes of the people highlights the concept of communicative responsiveness.Footnote 23 Communicative responsiveness can mean that the contacted politician listens closely and tries to understand what the citizen is expressing before making a decision. It can also mean that the politician takes time to explain the views of the party or of herself/himself in order to ensure that the citizens understand the arguments behind the decision. In line with this reasoning, Esaiasson, Gilljam and PerssonFootnote 24 propose a threefold theoretical approach to the notion of responsiveness that takes into account both adaptive and communicative responses: Politicians can be responsive by (1) listening and finding out more about the wishes of the public, (2) explaining and developing their own position to the public and (3) adapting and trying to meet the wishes of the public.
Such a multifaceted understanding of responsiveness should be useful in all studies of the effects of citizen-initiated contacts, but maybe especially so in studies of party-centered systems. It seems likely that the complex relationship between the party, the politician and the citizen gives the politician incentives to be responsive in other ways than just adapting to views expressed when the contact is made.
So far, little empirical work has been done on communicative responsiveness related to citizens’ policy requests. In a general sense, it seems reasonable to understand communication as a less costly response than adaptation. Studies comparing adaptive policy responsiveness and service responsiveness find that representatives see the latter as easier than the former. Dealing with policies involves the risk of clinching with the party and upsetting other voter groups, while providing a service is a smoother way to show interest and engagement.Footnote 25 Similarly, it should be less demanding to communicate with citizens than to adapt to their views, in terms of both the effort involved and the potential clinch with the party and personal opinions.
Research Questions
This article studies politicians’ willingness to give adaptive and communicative responses to citizen-initiated policy-focused contacts in a party-centered system and, more specifically, investigates situations in which the party says one thing and the contacting citizens say something else. We ask two more specific questions: (1) How is a politician’s willingness to give adaptive and communicative responses to citizen-initiated policy-focused contacts affected if his or her party disagrees with the citizen proposal? (2) How is the effect of the disagreeing party on adaptive and communicative responsiveness mitigated by politicians having strong personal incentives to be responsive?
Study Design
Recent research on representation has applied an experimental design to the study of politicians’ responsiveness.Footnote 26 We took inspiration from these designs and conducted an online survey experiment in which we randomly assigned politicians to scenarios in which citizens make contact. In this section of the article, we describe the Swedish context in which the survey was conducted. We also describe the Panel of Politicians survey, which provides a unique sample of party representatives who are likely to have experienced, or will experience, similar situations to the ones we ask about. Next we describe the design of the experiment and our stimuli (party position, politicians’ opinion and contacting group). The section ends with a description of how our dependent variables – communicative and adaptive responsiveness – are operationalized.
A few words about the context: Sweden is a fairly typical party-centered system in which it is likely that the party plays a significant role in the direct relationship between voters and representatives. Constitutionally, Sweden has strong and influential political parties that function in a parliamentary system with a low degree of separation of powers. Party cohesion is strong, and members of local and national assemblies tend to be loyal party representatives.Footnote 27 That said, the personal relationship between the candidate and the voters is formally encouraged via a possibility to cast a personal vote for someone on the party list. Previous elite surveys of Swedish politicians support the claim that politicians have complementary loyalties to the party, their own opinions and the voters. Since 1985, the Swedish Parliamentary Study has regularly asked Swedish Members of Parliament (MPs) to describe who they personally think is important to represent.Footnote 28 Judging from these investigations, with an average response rate of over 90 per cent, ‘promote the policies of your own party’, ‘promote the interest of individual voters’ and ‘promote views you personally consider important’ are all of great importance. On average, 79 per cent of the Swedish MPs testify that all three objectives are important. The assessments have been stable for twenty-five years (the proportion has never fallen under 75 per cent).Footnote 29
Description of the Survey: Panel of Politicians
The Panel of Politicians is an online panel of Swedish politicians from the local, regional and national levels. It was initiated in 2010 by the Laboratory of Opinion Research (LORE) at the University of Gothenburg. The respondents were recruited in different steps. In a first step, around 1,800 email addresses were collected from local and regional parliament websites. In a second step, respondents were recruited to the panel via two different surveys: the Comparative Candidates Survey (CCS) 2010 and the Municipal and Regional Parliament Survey 2012 (Kommun- och landstingsfullmäktigeundersökningen, KOLFU). Respondents of both surveys were asked whether they were willing to participate in an online panel survey about their work as a representative on a regular basis (or whether they were already signed up as participants). The email addresses they provided were then used to send out surveys from the Panel of Politicians. Both the CCS and the KOLFU were directed to the total population of politicians they aimed to survey. The CCS was sent to all parliamentary candidates in the 2010 national election (N=4,000, including the Feminist Party that did not enter Parliament), and got a response rate of 45 per cent. The KOLFU was sent to all members of all local and regional parliaments during the fall of 2012 (N=13,361) and got a response rate of 79 per cent. In a third step, respondents of the Panel of Politicians were recruited by existing panel members. The panelists were asked if they were willing to recommend other colleagues to participate in the panel, and some did so.
When our study was performed, the panel consisted of around 3,600 politicians, which included as many as 35 per cent of the country’s MPs. All individuals elected to local, regional and national parliamentary positions during 2010–12 were contacted, as were all candidates for the 2010 national parliamentary election. The response rate for the survey used in this article was 70 per cent. In total, 2,547 politicians participated in the experiment. Taken together, our survey captures an unusual diversity of politicians from the investigated context, which makes it possible to perform a survey experiment on an unusually large sample of representatives.
Experimental Manipulation and Questions
The vignettes were formulated as follows (see Table A1 in the Appendix for a summary of the eight groups this design yields):
It happens that different groups of citizens contact politicians with political propositions. Imagine a situation where you just received an email from a group of citizens you know voted for you in the last election/a group of citizens. They oppose a proposition from the civil servants to close a school in your municipality. You agree with the proposition that they make/[no mention of own position]. The proposal goes against your party’s position on the issue/[no mention of party position]. How likely is it that you do one of the following things?’
The respondents use a seven-point scale (1=‘not at all likely’ and 7=‘very likely’) to rate the likelihood that they would respond in each of the following six ways: ‘1. Answer email and develop your position on the matter’, ‘2. Answer email and explain your party’s position on the matter’, ‘3. Ask them to send additional information’, ‘4. Suggest a personal meeting’, ‘5. Take the question further and try to get others in your party to listen to their arguments’ or ‘6. Take the question further and try to get the media interested in the cause’.
Hence, we measure two types of responses that aim to explain (explaining one’s own opinion and explaining the party’s position, Cronbach alpha 0.59) and two measures of listening responses (asking for more information and suggesting a personal meeting, Cronbach alpha 0.64). For adaptive policy responsiveness, we identify two arenas in which the politician can act to fulfill the citizens request: the internal party arena and the external media arena (Cronbach’s alpha 0.72).
It is not easy to find an issue and scenario that all politicians can realistically relate to. We discussed different policy areas with politicians prior to the experiment and chose school and education, since it has potential to engage citizens, parties and politicians at the local, regional and national levels. A subject that can lead to different policy positions from case to case, making it possible to write a scenario that credibly varies the politicians’ own positions, their voters’ positions and their party’s positions. Moreover, school closures are common reason for citizens to become engaged in Sweden. From 1991 to 2010, about 1,200 schools were proposed for full or partial closure, and almost 60 per cent of these proposals led to a real decision. Thus one-fourth of Swedish schools have been threatened with full or partial closure in recent decades.Footnote 30 To test how well we succeeded in choosing a relevant scenario, we included a question after the experiment that asked the respondents to state to what extent they recognized the situation that we asked them to consider. They answered on a seven-point scale from 1 (‘I don’t recognize it at all’) to 7 (‘I truly recognize it’). The mean for all eight treatment groups was 4.6. None of the groups was below the midpoint 4.0. Our interpretation is therefore that we succeeded reasonably well in making the scenarios similar to actual situations.
Our questions were embedded in the third wave of the Panel of Politicians performed in February 2013. The rest of the survey (which took around ten minutes to complete) was dedicated to questions related to other projects – the politicians’ views on current political issues, their views of opinion polls and how they saw their future in politics. The respondents did not gain economically from contributing to the panel, but they were thanked for contributing to research on democracy and received a report on the results that lets them compare the views of citizens with the views of politicians for some of the variables.Footnote 31
Results
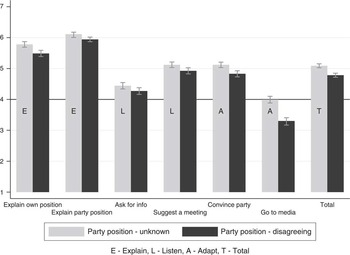
How is politicians’ willingness to give adaptive and communicative responses to citizen-initiated policy-focused contacts affected by the party disagreeing with the citizen proposal? Figure 1 divides the respondents into whether or not the party’s position is mentioned as being in disagreement in the vignettes they read. The gray bars represent a scenario in which the party’s position is not mentioned in the vignettes; the black bars indicate that the party was said to be in disagreement with the contacting group. As described, we point out six different ways a politician can be responsive in our study. The bars marked ‘E’ illustrate the willingness to respond to a contacting group by explaining one’s own position and the position of the party. The ‘L’ bars represent the mean willingness to ask for more information and suggest a meeting, that is, listen. The ‘A’ bars tell us the mean for the willingness to try to convince the party and go to the media, that is, adapt. The six different response options are merged and presented in the ‘T’ (for total) bar.
Politicians’ willingness to respond when the party disagrees with the citizen proposal Note: the scale runs from 1 to 7 (1=it is ‘not at all likely’ that the respondent will respond in the way formulated in the question; 7=it is ‘very likely’ that they will). Error bars represent significance at 0.05. All effects are significant at 0.05, five are significant at 0.01; details are found in the text.

Figure 1 shows that the party’s disagreeing position has a constraining effect on responsiveness in all six responsiveness measures; five are significant at the 0.01 level and one, ‘ask for info’, is significant at 0.05. Hence, the tendency to reduce responsiveness when the party disagrees is found not only for the adaptive responses, but also for what could be assumed to be the less costly communicative responses. The total mean (shown in the T bars) decreases from 5.09 to 4.78 (t-value=6.47, p=0.000).
Figure 1 also indicates that the willingness to be responsive depends on what kind of responsiveness politicians are asked about. Explaining a position is the most preferred way to be responsive. The mean for explaining one’s own position when the party’s position is not mentioned is 5.78, and when the party’s position is mentioned as being in disagreement it is 5.49 (t-value=4.27, p=0.000). The mean for explaining party position is 6.11 when the party position is not mentioned, and 5.94 when the party’s disagreeing position is mentioned (t-value=3.30, p=0.001).
The least likely alternative for politicians is to contact the media. The mean for ‘contact media’ is 3.30 when the party is in disagreement and 3.99 when the party position is not mentioned (t-value=8.97, p=0.000). Thereafter comes ‘ask for info’, which has a mean of 4.44 when the party’s position is not mentioned and 4.27 when the party is in disagreement (t-value=2.24, p=0.025). ‘Convince the party’ has a mean of 5.12 when the party’s position is not mentioned and 4.83 when the party is in disagreement (t-value=4.28, p=0.000). The mean for ‘suggest a meeting’ when the party position is not mentioned it is 5.12 and when the party is in disagreement it is 4.92 (t-value=2.88, p=0.004).
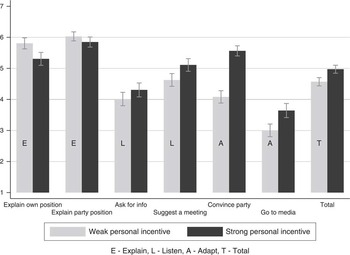
Let us move to our second question: How is the effect of the disagreeing party on adaptive and communicative responsiveness mitigated by politicians having strong personal incentives to be responsive? Figure 2 illustrates a comparison between situations when a politician has strong and weak personal incentives to respond. In both cases, the party is against the proposal. Weak personal incentives to respond are defined here as being contacted by an anonymous group of citizens, and that the vignette does not mention the respondent’s own position (experimental group 8, see Table A1). Strong personal incentives to respond are defined here as being contacted by a group of citizens that ‘you know voted for you in the last election’ and to personally agree with the proposal (experimental group 5, see Table A1).
When the party says no: How willing are politicians to respond to citizen-initiated contacts? Note: results are divided into politicians with weak and strong personal incentives to respond. The scale runs from 1 to 7 (1=it is ‘not at all likely’ that the respondent will respond in the way formulated in the question; 7=it is ‘very likely’ that they will). Error bars represent significant level at 0.05.

The results show that, in general (see the ‘T’ bars in Figure 2), strong personal incentives do mitigate the effect of the disagreeing party on politicians’ willingness to respond (the mean for weak personal incentive is 4.57, and the mean for strong personal incentive is 4.97, t-value=−4.26, p=0.000). However, the importance of strong incentives varies depending on what kind of responsiveness we are looking at. We cannot conclude that politicians who agree with the proposal and are contacted by their own voters are consistently more responsive than those with weaker personal incentives to respond.
Notably, politicians’ willingness to clarify their own position decreases from 5.81 to 5.31 when they have strong personal incentives to respond and the party is in disagreement (t-value=3.57, p=0.000). There is also a tendency, not significant though, for respondents to become less willing to develop the position of the disagreeing party when their own voters make contact and they personally agree with the proposal brought forward by the voters, from 6.03 to 5.85 (t-value=1.64, p=0.102). Hence, it seems that the politicians are reluctant to explain to contacting groups that they are in conflict with their party, especially when the contacting group consists of likely voters. This conclusion is strengthened by the fact that when the party’s position is not mentioned, politicians with strong personal incentives are more willing to explain their own positions than are politicians with weak incentives (not shown in the figure). The mean for strong incentives is then 5.93 and the mean for weak incentives is 5.54 (t-value=−2.94, p=0.003). The same numbers for explaining the position of the party when it is not mentioned is 6.19 for strong incentives and 6.02 for weak incentives (t-value=−1.73, p=0.08).
For the listening and adaptive responses, however, those with strong personal incentives are more responsive across the board than those with weak personal incentives (see Figure 2). When politicians are asked about their willingness to listen and to adapt when the party disagrees, personally agreeing and contact with voters have positive effects. The mitigating effect of strong personal incentives is most evident in the case of adaptation, especially for the readiness to ‘convince party’ (the mean for strong incentives is 5.56 and the mean for weak incentives is 4.04, t-value=−11.26, p=0.000). Strong incentives are also important for politicians’ readiness to address the media (the mean for strong incentives is 3.64 and the mean for weak incentives is 3.00, t-value=−4.11, p=0.000). The willingness to ‘ask for information’ increases from a mean of 4.01 to 4.31 when the politicians have strong personal incentives to respond (t-value=−1.86, p=0.063). Similarly, the respondents are more willing to ‘suggest a meeting’ when they have strong incentives to respond (the mean for strong incentives is 5.11 and the mean for weak incentives is 4.63, t-value=−3.29, p=0.001).
Conclusions
Citizens have become more active in contacting their representatives between elections. This article has discussed and shown empirical support for the complexity of the calculations that politicians in party-centered systems make before responding to citizen-initiated contacts. First, we conclude that a disagreeing party is a restraining factor for politicians’ willingness to respond to contacting citizens. Politicians are less willing to respond when the party disagrees with the contacting citizen, regardless of which of the six types of responses we ask about. The willingness to give communicative responses, which should be seen as less costly in terms of creating conflict with the party, also significantly diminishes when the party disagrees. Our study thereby supports a claim that when studying how and to whom politicians in party-centered systems are responsive, we should take the parties and their positions into account.
Secondly, we conclude that strong personal incentives to respond to citizen-initiated policy contacts (defined here as agreeing with the proposal and being contacted by one’s own voters) have different effects on different types of responsiveness when the party disagrees with the contacting citizens. When the party disagrees, politicians are more willing to listen and to adapt, but less willing to explain when they have strong personal incentives to respond. Hence, the effect of strong personal incentives is negative for explaining responses when the party disagrees. Furthermore, the personal incentives to respond have a stronger effect on the adaptive responses than on the listening responses. The restriction on the willingness to listen that the disagreeing party causes is thus less mitigated by personal incentives than is adaptive responsiveness.
These results can be interpreted as strengthening the conclusions that the party plays an important role in politicians’ responsiveness to citizen-initiated contacts in party-centered systems. A politician with strong personal incentives is willing to take action and convince her party to change its position. However, the conflict with the party seems to be an issue between the party and the politician rather than between the politician and the voter. The respondents in our survey are not keen to expose differences between themselves and the party in emails with voters, but are willing to be open about it inside the party structure. This seems to be especially true for responses aimed at explaining, which leads us to a third and general conclusion related to future research: responsiveness in the form of explaining one’s own position needs to be analyzed separately from other types of responses, at least in party-centered systems. We cannot expect politicians’ willingness to explain themselves to citizens to follow the same pattern as their willingness to adapt to and listen to their views. Instead, individual politicians who experience party pressure and have personal incentives to respond might choose to act or listen silently instead of responding by openly explaining their own position.
Experimental studies of this kind tend to focus on one or a few policy areas, and our article is no exception. By investigating the scenario of a school closure, we focus on an issue with the potential to engage voters, parties and representatives in most political systems. In this scenario, the representative is offered a chance to ‘bring pork’ to the constituents, which is relevant to many representative processes. However, politics is often also ideological and value based. Important future comparisons are policy issues that are part of ideological political dimensions such as the left-right dimension, on which the actors clearly base their actions on ideological values.
Summing up, the results from this study show that important dynamics have been missing in previous research on representation. When politicians in party-centered systems are confronted with contradictory interests between their party, their voters and their own convictions, responsiveness may take indirect forms behind the scenes. Politicians with high personal incentives to respond are not more likely to directly respond to the constituent with explanations of either their own position or the party’s position. Instead, they work to try to convince fellow party members to change their views. Hence, individual-level representation in party-centered systems means that politicians are responsive to voters not only via direct response, but by working to persuade the party from within.