Implications
Multielemental stable isotope ratio (SIR) analysis was used in lamb plasma, erythrocytes and muscle to detect the switch from a pasture- to a concentrate-based diet. Lambs that were moved from a pasture to a concentrate diet were discriminated from those fed exclusively pasture or concentrate. The carbon and oxygen SIR in plasma were among the most reliable parameters able to discriminate the dietary treatments. This highlights the possibility of using blood as a noninvasive substrate, alternative to muscle, for traceability purposes.
Introduction
In the past few decades, efforts have been made to identify objective tools to trace the dietary background of animals directly from their products (Prache et al., Reference Prache, Cornu, Berdagué and Priolo2005). The great interest in pasture-based feeding systems (as opposite to stall feeding) lies in its implication for organic and sustainable production systems, as well as for the health properties of products. Several potential markers have been evaluated as tracers of pasture feeding in ruminants: carotenoid pigments (Prache and Theriez, Reference Prache and Theriez1999), terpens and other volatile compounds (Vasta and Priolo, Reference Vasta and Priolo2006), fatty acids (Aurousseau et al., Reference Aurousseau, Bauchart, Calichon, Micol and Priolo2004), vitamin E isomers (Röhrle et al., Reference Röhrle, Moloney, Black, Osorio, Sweeney, Schmidt and Monahan2011) and stable isotopes (Moreno-Rojas et al., Reference Moreno-Rojas, Vasta, Lanza, Luciano, Ladroue and Priolo2008). However, one of the main problems in tracing the animal dietary background in milk and meat products is that, in common practice, the animals during their life are exposed to different feeding systems. Typically, for meat production, finishing diets are based on concentrates even for those animals that previously were kept on pasture. The detection of the change from a pasture- to a concentrate-based diet has been investigated in few studies that focused on carotenoid pigments (Prache et al., Reference Prache, Priolo and Grolier2003) and on fat volatiles (Priolo et al., Reference Priolo, Cornu, Prache, Krogmann, Kondjoyan, Micol and Berdagué2004).
The SIR of the bioelements C, N, H, O and S (13C/12C, 15N/14N, 2H/1H, 18O/16O and 34S/32S) in animal tissues or products (muscle, hooves, hair, blood, milk, etc.) is dependent on the isotopic composition of the plants and water ingested by the animals (Kornexl et al., Reference Kornexl, Werner, Rossmann and Schmidt1997; Bahar et al., Reference Bahar, Monahan, Moloney, O'Kiely, Scrimgeour and Schmidt2005; Perini et al., Reference Perini, Camin, Bontempo, Rossmann and Piasentier2009). Moreover, the isotopic composition of tissues reflects dietary variations and the rate of change depends on the specific turnover rate of each tissue, with muscles having a lower turnover rate compared with blood plasma and liver (Phillips and Eldridge, Reference Phillips and Eldridge2006). Consequently, in the case of animals grown at pasture and finished on concentrates, it is reasonable to expect that SIR may be affected by both the length of the finishing period and the animal tissue.
Therefore, the aims of this study were to assess the possibility of using C, N, H, O and S SIR analysis of different animal tissues (muscle, plasma and erythrocytes) to detect the change from herbage- to concentrate-based diets and to identify the most suitable animal tissue and isotope ratio.
Material and methods
Animal management
The study was conducted in a farm located in southern Italy (38°38′N, 16°04′E) from December 2008 to March 2009. Thirty-eight single male Italian Merino lambs were fed maternal milk and received a commercial weaning concentrate starting from the 35th day of age. At 60 ± 10 days of age, lambs were weaned and divided into four groups consisting of nine or 10 lambs each. During the 18-day transition period, lambs were gradually adapted to the experimental diets by receiving a decreasing amount of the weaning concentrate, 100 g/day of natural pasture hay and increasing proportions of the experimental diet. Starting from day 1 of the experimental feeding trial, and for the whole 89-day experimental period, animals were fed pasture (group P), pasture followed by an abrupt switch to concentrate in the stall for either 14 days (i.e., pasture for 75 days and stall for 14 days; group P-S14) or 37 days (i.e., pasture for 52 days and stall for 37 days group P-S37) or concentrate in the stall (group S).
Each day, the lambs in the P group and those in the P-S37 and P-S14 groups (during the pasture feeding phase) were allowed to graze from 1000 h to 1600 h on a natural nonfertilized pasture (80% Gramineae and 20% Leguminosae, approximately, with a C3 metabolism) in accordance with a continuous grazing system. In the remaining hours of the day, the lambs were kept indoors in multiple boxes without receiving any feed supplementation. For the whole experimental period, the lambs in the S group were individually penned and were fed a concentrate (64% barley, 34% chickpea and 2% mineral and vitamin mix; the seeds were roughly ground and mixed) and natural pasture hay in a ratio of 80/20 of the diet on an as-fed basis. After the period spent at pasture, the lambs in the P-S37 and P-S14 groups were individually penned and were fed the same diet as the S group. All the animals were weighed weekly and feed allowances for the S lambs were adjusted to obtain similar growth rates compared with the animals from the P group. The daily ration for animals in the S treatment and for those in the P-S14 and P-S37 groups (during the stall phase) was distributed once a day in the morning. All the animals had an ad libitum access to water exclusively in the stall. All the experimental procedures, both in vivo and at slaughtering, were approved by the University of Catania.
Feed, blood and muscle sampling
Hay and concentrate were sampled four times during the trial. One pooled sample was used for the analysis because a unique batch of hay and concentrate was used for the whole trial. Seven samples of pasture (≈2 kg each) were collected throughout the experimental period (first and last sampling being at day 10 and 88, respectively). All the feed samples were oven-dried at 60°C and were ground with a mill using a screen of 1 mm. On the last day of the experiment, before feeding time, blood samples were taken individually from the jugular vein, collected in EDTA tubes and centrifuged (3000 × g for 15 min at 4°C) in order to separate plasma and erythrocytes. Blood fractions were stored in Eppendorf vials at −20°C until analysis (Norman et al., Reference Norman, Wilmot, Thomas, Masters and Revell2009). The lambs were slaughtered in a public slaughterhouse 15 km away from the farm. The carcasses were stored for 24 h at 4°C and then halved. The longissimus dorsi muscle (50 g) was sampled from the left side between the 10th and the 13rd vertebrae, wrapped in aluminium foil, vacuum packed and stored at −20°C until analysis. The longissimus dorsi muscle was also taken from the right side for intramuscular total lipid determination (Folch et al., Reference Folch, Lees and Stanley1957).
Analytical procedures
Erythrocytes, plasma and muscle sample preparation. For each animal, erythrocyte samples and one subsample of plasma destined for the analysis of 13C/12C and 15N/14N isotopic ratios (or δ13C and δ15N, respectively) were lyophilized for 48 h to remove water and were stored at room temperature in small glass sealed bottles put in a vacuum desiccator, pending analysis. The other subsample of plasma, destined for the analysis of 18O/16O isotopic ratio (or δ18O), was stored at −20°C. Muscle samples were lyophilized; the defatted muscle protein fraction (destined for the analysis of the 13C/12C, 15N/14N, 34S/32S, 2H/1H and 18O/16O isotopic ratios) and the fat fraction (destined for the analysis of the 13C/12C isotopic ratios) were obtained as described in Perini et al. (Reference Perini, Camin, Bontempo, Rossmann and Piasentier2009). Both muscle protein and fat fractions were stored at room temperature in small glass sealed bottles put in a vacuum desiccator, pending analysis.
Stable isotope analysis
The 13C/12C and 15N/14N ratios in feeds (≈1.5 mg), defatted meat (≈0.5 mg) and blood components (≈0.5 mg) were measured simultaneously using an Isotope Ratio Mass Spectrometer (DELTA V, Thermo Scientific, Germany) following total combustion in an elemental analyser (EA Flash 1112, Thermo Scientific). The 13C/12C ratio of fat was measured with the same instruments, as well as the ratio 34S/32S of feeds and defatted meat. For 34S/32S ratio determination, around 8 mg of the oxidation agent V2O5 was added to the capsule in order to optimize the combustion of the sample. The 2H/1H and 18O/16O ratios in feed (≈0.8 mg) and defatted meat (≈0.5 mg) were measured using an Isotope Ratio Mass Spectrometer (DELTA XP, Thermo Scientific) coupled with a Pyrolyser (TC/EA, high temperature conversion elemental analyzer, Thermo Scientific). Further details of the analytical procedures adopted are reported in previous papers (Perini et al., Reference Perini, Camin, Bontempo, Rossmann and Piasentier2009). The ratio 18O/16O in plasma was determined in 2 ml of defrosted samples after equilibration with CO2 using an ISOPREP 18 (VG Isotech, Middlewich, UK) online preparation system that allows CO2/H2O equilibration, interfaced with an Isotope Ratio Mass Spectrometer (SIRA II, VG Isogas, Middlewich, UK), according to the water equilibration method described for wine in the OIV method (MA-AS2-12: R2009).
The values were expressed in δ‰ (=[(R sample−R standard)/R standard]×1000, where R is the ratio between the heavier isotope and the lighter one) referenced to international standards: Vienna-Pee Dee Belemnite (V-PDB) for δ13C, Air for δ15N, Vienna-Standard Mean Ocean Water (V-SMOW) for δ2H and δ18O, Vienna-Canyon Diablo Troilite (V-CDT) for δ34S. For the calculation of δ13C, δ15N and δ18O, we used casein and water working standards, calibrated against international reference materials: l-glutamic acid USGS 40 (IAEA-International Atomic Energy Agency, Vienna, Austria), fuel oil NBS-22 (IAEA) and sugar IAEA-CH-6 (IAEA) for 13C/12C; l-glutamic acid USGS 40 for 15N/14N; V-SMOW (IAEA) and benzoic acid (IAEA-601) for 18O/16O in water and in casein, respectively. The δ34S values were calculated against barium sulphates IAEA-SO-5 and NBS 127 (IAEA) through the creation of a linear equation. The 2H/1H values were corrected against the same casein standard with an assigned value of δ2H, according to the ‘comparative equilibration technique’ (Wassenar and Hobson, 2003, quoted by Camin et al., Reference Camin, Bontempo, Heinrich, Horaceck, Kelly, Schlicht, Thomas, Monahan, Hoogewerff and Rossmann2007). The uncertainty of measurements (2σ obtained by analysing ten times the same sample) was <0.3‰ for the δ13C and δ15N analysis and for δ18O of plasma water, <0.8‰ for δ34S, <0.6 ‰ for δ18O and <3‰ for δ2H.
Statistical analysis
All the variables considered in this study were subjected to a stepwise canonical discriminant analysis (CAN. DISC) in order to select the variables that better discriminate the different groups and to derive canonical functions (CAN) that summarize the variation between groups. On one hand, this procedure was adopted to assess whether the selected variables were able to effectively discriminate between the dietary treatments. The discrimination efficiency was tested by the Mahalanobis distance test of significance and was validated using the ‘leave-one-out’ cross-validation test. On the other hand, the CAN. DISC. was used as exploratory approach to assess the correlations between the selected variables and the canonical functions in order to attribute a meaning of the variables in the discrimination between the groups. Discriminant analysis was performed using the statistical software SPSS (18.0, 2009).
In addition to the multivariate approach, each variable was subjected to univariate ANOVA. Specifically, ANOVA on blood δ13C and δ15N included dietary treatment (P, P-S14, P-S37 and S) and blood component (plasma or erythrocytes) as fixed experimental factors and the dietary treatment × blood component interaction. Data of δ18O in plasma and of all the isotopic ratios in defatted muscle and fat were analyzed with a monofactorial ANOVA including the dietary treatment as fixed factor. Pairwise comparisons were performed using Tukey's test.
Results and discussion
Feeds
The samples of pasture offered to the lambs presented lower δ13C, δ15N, δ18O and δ2H and higher δ34S values compared with concentrate (Table 1). Less negative values for δ13C in C3 concentrates compared with C3 forages have already been observed (De Smet et al., Reference De Smet, Balcaen, Claeys, Boeckx and Van Cleemput2004; Schwertl et al., Reference Schwertl, Auerswald, Schäufele and Schnyder2005). According to Bahar et al. (Reference Bahar, Monahan, Moloney, O'Kiely, Scrimgeour and Schmidt2005), the different δ13C values between C3 concentrate and C3 forage could be due to the different proportion of photosynthetic and nonphotosynthetic tissues, which have different δ13C values. The results obtained for the nitrogen isotopic ratio agree with those previously reported for forages (Camin et al., Reference Camin, Perini, Colombari, Bontempo and Versini2008) and concentrates (Schwertl et al., Reference Schwertl, Auerswald, Schäufele and Schnyder2005). In the present experiment, the concentrate given to lambs was composed by barley and chickpea. Although the latter ingredient represented only 1/3 of the mixture supplied to lambs, it is reasonable to hypothesize its great contribution to the overall δ15N value of the concentrate because of its much higher protein level than barley. Regarding the hydrogen and oxygen ratios, our results are in line with previous reports (Camin et al., Reference Camin, Perini, Colombari, Bontempo and Versini2008). The δ18O in the pasture samples increased throughout the whole experimental period ranging from 21.2‰ at starting to 23.8‰ at the end. The passage from winter to spring seasons during the experiment could have increased plant evapotranspiration, a process that produces an 18O-enriched water in the plant tissue (Kornexl et al., Reference Kornexl, Werner, Rossmann and Schmidt1997). Data on δ34S in forages have seldom been reported. According to Richards et al. (Reference Richards, Fuller, Sponheimer, Robinson and Ayliffe2003), the main factors affecting sulphur isotopic ratio in growing plants are related to local bedrock, microbial processes active in the soil and atmospheric deposition of sulphate on the forages in coastal areas (sea-spray effect). Considering that the farm is located ∼3 km from the sea, the high δ34S values of pasture could have been affected by the sea-spray effect.
Feed isotope ratios for C, N, O, H, S (for pasture mean ± s.d. are shown)

aComposition (as-fed basis): barley 64%; chickpea 34%; mineral and vitamin mix 2%.
Multivariate discrimination among dietary treatments
Multivariate statistical approaches have been shown to represent powerful tools in traceability studies (Camin et al., Reference Camin, Bontempo, Heinrich, Horaceck, Kelly, Schlicht, Thomas, Monahan, Hoogewerff and Rossmann2007; Gonzalves et al., Reference Gonzalves, Armenta and de la Guardia2009). Among the multivariate approaches, the CAN. DISC. allows to simultaneously consider several measurements and to combine them to form canonical functions able to discriminate between animal products coming from different geographic areas (Heaton et al., Reference Heaton, Kelly, Hoogewerff and Woolfe2008) or from different feeding systems (Perini et al., Reference Perini, Camin, Bontempo, Rossmann and Piasentier2009). Moreover, stepwise CAN. DISC. enables to assess the discriminating power of each variable in the multivariate structure, allowing to select those with the highest discriminating capacity. This can be useful in identifying variables that are worth being considered for specific research needs.
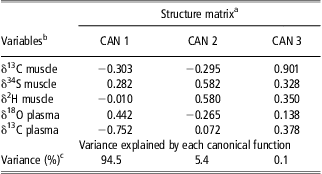
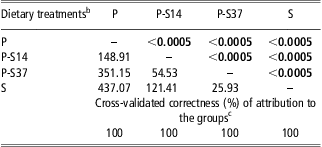
From the full set of variables considered in the present study, the stepwise procedure retained five variables (δ13C in muscle and plasma, δ18O in plasma, δ34S and δ2H in muscle) with high discrimination capacity. The CAN. DISC. combined the selected variables in three canonical functions (CAN), which, together, explained the total variance of the dataset (P < 0.001; Table 2). The Mahalanobis distances between the groups were all highly significant and, after cross-validation, each animal was classified in the original group (100% accuracy of the classification; Table 3). Considering that the first two CAN together accounted for 99.9% of the total variability, the multivariate structure can be well represented by the first two CAN only. This is evident in the loading plot of the first two canonical functions (Figure 1) in which the four dietary treatments are totally discriminated, with the P and S groups being highly distant and the P-S14 and P-S34 groups placed between them. The absolute values of the bivariate correlation coefficients between each original variable and each canonical function were considered, as an exploratory approach, to assess the meaning of the different variables in the multivariate structure. It is evident, in Figure 1, that CAN 1 alone totally discriminated the P, P-S14 and S groups, whereas some overlapping appeared between P-S37 and S groups. As shown in Table 2, CAN 1 correlated mainly with δ13C and δ18O in plasma; δ13C and δ34S in muscle had a weak correlation coefficients with CAN 1. This result, together with the fact that δ13C in erythrocytes was not retained in the multivariate discriminant structure, suggests that the blood carbon isotopic ratio could be successfully used to trace dietary treatment changes in ruminants, with plasma being a much more reliable substrate compared with erythrocytes. The different turnover rate of erythrocytes and plasma (Phillips and Eldridge, Reference Phillips and Eldridge2006), probably affected by their different origin, could explain these results. Different times of equilibration of carbon SIR in plasma and red blood cells following diet changes were indeed observed in bears (Hilderbrand et al., 1996, quoted by De Smet et al., Reference De Smet, Balcaen, Claeys, Boeckx and Van Cleemput2004).
Structure matrix and variance explained by each canonical function
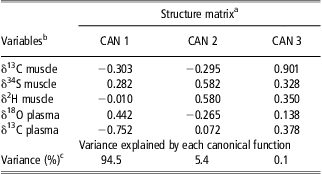
aCorrelations between each variable retained after the stepwise selection and each of the three canonical functions. The higher the absolute value of the correlation coefficient, the greater the contribution of the individual variable to the canonical function.
bVariables retained after the stepwise selection procedure.
cPercentage of the total variance explained by each canonical function.
Classification and distances between groupsFootnote a
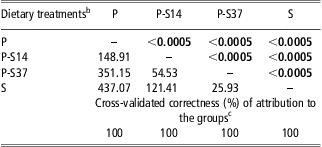
a Mahalanobis distances and significances (in bold) between groups.
b P = pasture; P-S14 = pasture feeding followed by concentrates in stall for 14 days; P-S37 = pasture feeding followed by concentrates in stall for 37 days; S = concentrate in stall.
c Cross-validation achieved with the ‘leave-one-out’ procedure, in which each case is classified into a group on the basis of the function derived from the remaining cases.
Discrimination of the dietary treatments achieved by plotting the first two canonical functions (cumulative variance explained: 99.9%). The treatments were: Pasture (P, ▪), Pasture followed by concentrates in stall for 14 days (P-S14, □), Pasture followed by concentrates in stall for 37 days (P-S37, ○) or concentrate in stall (S, •).

Interestingly, the CAN 2 showed that animals in the extreme dietary treatments (P and S) were not discriminated, but were separated from animals that switched from pasture to concentrates (P-S34 and P-S14 groups). This canonical function showed rather strong correlations with both δ2H and δ34S in muscle, while only slight correlation coefficients were found with the other isotopic ratios. Therefore, it seems that the hydrogen and sulphur isotopic ratios in muscle could show the switch in the diet of animals, from herbage-based to concentrate-based diet. Interestingly, whereas δ34S also showed a slight correlation with CAN 1, δ2H in muscle was unrelated with CAN 1. This suggests that the change of the diet rather than the composition of the diet somehow affected the δ2H in the muscle.
Effect of the dietary treatment on the blood components and muscle SIRs.
Blood components
The δ13C and δ15N in blood were affected by both the dietary treatment and the blood component and a significant interaction between the factors was also found (Table 4). The δ13C gradually increased moving from the P group to the groups that received the concentrate either in erythrocytes and plasma. No overlapping was observed between the P and the P-S14 lambs in plasma. The higher values obtained in the S group were expected because C3 concentrate presented less negative δ13C values than pasture. In plasma from the P lambs, δ13C was lower compared with erythrocytes (P < 0.05), whereas in the other groups it was always higher in plasma compared with erythrocytes (P < 0.05). In our experimental conditions, switching lambs from pasture feeding to a long period of a concentrate-based diet (37 days) produced different isotopic ratios in both blood components. However, the change of diet from pasture to a short period (14 days) on concentrates could be detected by SIR analysis of plasma only. These results are in agreement with those obtained with the multivariate discriminant analysis and further confirm that δ13C determination in plasma allowed to detect diet changes better than in erythrocytes. Previous reports showed that diet δ13C differently affected plasma or milk δ13C depending on the magnitude of the diet carbon SIR variation. Abrupt changes from C3 to C4 plants (or vice versa) in the diet resulted in a prompt response, which was observed within three days in sheep plasma (Norman et al., Reference Norman, Wilmot, Thomas, Masters and Revell2009) and within four (Boutton et al., Reference Boutton, Tyrrell, Patterson, Varga and Klein1988) or seven (Wilson et al., Reference Wilson, MacKenzie and Brookes1988) days in cow's milk. Contrarily, when changes in diet involved plants with the same photosynthetic pattern, no significant differences in plasma were observed, even after 18 days of diet change (Norman et al., Reference Norman, Wilmot, Thomas, Masters and Revell2009). However, although in that trial lambs received C4 forages with a narrow range of δ13C values (−14.9‰ and −12.6‰), wider differences in δ13C values were found in the present experiment between pasture and concentrate.
Effect of the dietary treatment on the stable isotope ratios in erythrocytes and plasma of lambs fed pasture (P, 9 lambs), pasture followed by concentrates in stall for either 14 days (P-S14, 10 lambs) or 37 days (P-S37, 9 lambs) or concentrates in stall (S, 10 lambs)

abcdeValues within the same row with different superscripts differ significantly (P < 0.05).
fδ18O has been determined on plasma only, monofactorial ANOVA has been applied on analytical data.
*P < 0.001.
Nitrogen SIR in erythrocytes from pasture lambs (P group) was not significantly different compared with P-S37 and P-S14 groups (Table 4); this suggests that, in our experimental conditions, erythrocytes maintained the isotopic ‘signature’ of pasture feeding regardless of the length of the finishing concentrate-based diet. Lower δ15N values were found in the erythrocytes from lambs in the S group compared with the grazing animals. The P and P-S14 groups showed higher values for plasma δ15N compared with the S group (P < 0.05; Table 4), whereas the P-S37 and S groups were not significantly different. In this study, overlapping data among the three pasture groups makes δ15N of plasma and erythrocytes an unreliable indicator of diet change from pasture to concentrate; this agrees with the results of the multivariate analysis in which the stepwise procedure did not select blood δ15N as a discriminating variable.
As previously reported, the CAN. DISC. analysis retained the δ18O values of plasma among the most discriminating variables. Indeed, ANOVA showed that the δ18O values in plasma decreased in the order P > P-S14 > P-S37 and S (P < 0.05; Table 4), which highlights that the longest finishing period on concentrates (37 days) masked the previous period on pasture. The higher δ18O values observed in plasma from the P and P-S14 animals compared with the S group could be explained considering: (1) the higher content in 18O in fresh plant tissues compared with the ground water because of the plant evapotranspiration processes (Kornexl et al., Reference Kornexl, Werner, Rossmann and Schmidt1997; Camin et al., Reference Camin, Perini, Colombari, Bontempo and Versini2008) and (2) the low drinking water intake in animals fed fresh herbage compared with animals fed hay and concentrates (Boner and Förstel, Reference Boner and Forstel2004).
The results observed for δ13C and δ18O suggest the high reliability of plasma as a noninvasive substrate for detecting pre-slaughter feeding system.
With regard to the comparison between animals fed exclusively pasture (P) or concentrate (S), all the studied isotopic ratios, δ13C, δ15N and δ18O, were significantly different regardless of the blood fraction considered. This is of interest because, in livestock species, only blood δ13C was focused on (De Smet et al., Reference De Smet, Balcaen, Claeys, Boeckx and Van Cleemput2004; Norman et al., Reference Norman, Wilmot, Thomas, Masters and Revell2009; Martins et al., Reference Martins, Ducatti, Martins, Denadai, Natel, Souza-Kruliski and Sartori2012).
Defatted muscle and fat
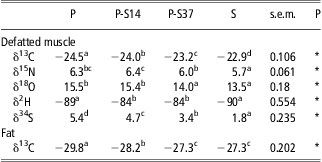
As shown in Table 5, ANOVA analysis revealed an effect of the dietary treatment on the muscle δ13C values, with differences between the groups being all significant. In line with the carbon SIR values of pasture and concentrates, the P treatment resulted in the lowest values and the S treatment in the highest. To our knowledge, the effect of switching from a C3 pasture to a C3 concentrate diet on muscle δ13C has never been investigated, whereas the discrimination between muscle from animals raised exclusively on C3-pasture or on C3-concentrates has been previously achieved (Moreno-Rojas et al., Reference Moreno-Rojas, Vasta, Lanza, Luciano, Ladroue and Priolo2008; Osorio et al., Reference Osorio, Moloney, Schmidt and Monahan2011). Muscle δ13C showed a positive Pearson correlation with δ13C in both plasma (r = 0.93; P < 0.001) and erythrocytes (r = 0.85; P < 0.001).
Effect of the dietary treatment on the stable isotope ratios in defatted muscle and fat of lambs fed pasture (P, nine lambs), pasture followed by concentrates in stall for either 14 days (P-S14, 10 lambs) or 37 days (P-S37, nine lambs), or concentrates in stall (S, 10 lambs)
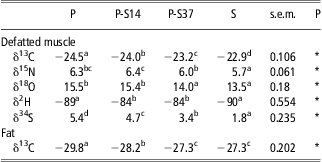
abcdValues within the same row with different superscripts differ significantly (P < 0.05).
*P < 0.001.
The δ13C in muscle lipid fraction was also significantly affected by diet (Table 5), with values for the P group being lower compared with the other experimental groups. The P-S37 and S groups showed similar δ13C values in the intramuscular fat (P > 0.05). This means that, in our experimental conditions, 37 days of concentrate feeding were sufficient to mask the previous period of pasture feeding by the analysis of δ13C in the intramuscular fat. The δ13C value in muscle was higher compared with fat fraction (−23.6‰ v. −28.0‰, respectively, P < 0.001), in agreement with Moreno-Rojas et al. (Reference Moreno-Rojas, Vasta, Lanza, Luciano, Ladroue and Priolo2008) and Perini et al. (Reference Perini, Camin, Bontempo, Rossmann and Piasentier2009). The phenomenon was explained by the discrimination against 13C, the heavier isotope, during lipid biosynthesis (DeNiro and Epstein, 1977, quoted by Perini et al., Reference Perini, Camin, Bontempo, Rossmann and Piasentier2009). The carbon isotopic ratio in fat extracted from muscle was not affected by muscle intramuscular lipid content (r = 0.246; P > 0.05; data not shown).
The δ15N values of defatted muscle from animals in the S group were lower (P < 0.05) than those found in muscle from lambs in the P, P-S37 and P-S14 groups. This means that a pasture-based feeding system produces different muscle δ15N values compared with a concentrate-based one, as previously observed by Moreno-Rojas et al. (Reference Moreno-Rojas, Vasta, Lanza, Luciano, Ladroue and Priolo2008) in lambs and Osorio et al. (Reference Osorio, Moloney, Schmidt and Monahan2011) in beef. However, no differences were observed in the δ15N values in the P group compared with the P-S37 and P-S14 groups. These results agree with the multivariate analysis in which muscle δ15N was not retained among the most discriminating variables.
Regarding the δ18O in defatted muscle, the P and P-S14 treatments resulted in higher δ18O values compared with the P-S37 and S animals (Table 5). ANOVA analysis agrees with the multivariate analysis, which did not retain muscle oxygen SIR as a variable that allowed discrimination among the four groups. Nevertheless, it is of interest that the pasture-feeding system (P group) produced different muscle δ18O values compared with the stall-feeding system (S group). The ingestion of vegetal water enriched in 18O and the low amount of drinking water consumed by pasture-fed animals can justify the higher values in the P group compared with the stall-feeding system, as previously discussed for plasma. Furthermore, Harrison et al. (Reference Harrison, Schmidt, Moloney, Kelly, Rossmann, Schellenberg, Camin, Perini, Hoogewerff and Monahan2011) found that drinking water represents the main source of oxygen in muscle from concentrate-fed lambs. To our knowledge, this is the first study comparing the effect of pasture- and concentrate-feeding systems on defatted muscle δ18O in experimentally controlled feeding conditions. Similar results were previously observed by Perini et al. (Reference Perini, Camin, Bontempo, Rossmann and Piasentier2009) in an overview on lambs from different Italian production systems. An increase in the δ18O value due to a diet based on fresh forages compared with preserved forages has also been observed in cow milk water fraction (Kornexl et al., Reference Kornexl, Werner, Rossmann and Schmidt1997; Renou et al., Reference Renou, Deponge, Gachon, Bonnefoy, Coulon, Garel, Vérité and Ritz2004a; Engel et al., Reference Engel, Ferlay, Cornu, Chilliard, Agabriel, Bielicki and Martin2007) and in beef meat water fraction (Boner and Förstel, Reference Boner and Forstel2004; Renou et al., Reference Renou, Bielicki, Deponge, Gachon, Micol and Ritz2004b).
Hydrogen isotopic ratio seems to be unreliable in terms of dietary treatment traceability. Indeed, δ2H values in muscle from lambs in the P and S groups did not differ and were lower (P < 0.05) compared with those measured in muscle from the animals switched from the pasture-based to the concentrate-based diet (P-S37 and P-S14 groups; Table 5). The univariate analysis confirmed the results of the multivariate discriminant analysis. Further research must be undertaken to better understand these findings, considering that around 70% of hydrogen in body proteins derives from feed (Hobson et al., Reference Hobson, Atwell and Wassenaar1999; Ehleringer et al., Reference Ehleringer, Bowen, Chesson, West, Podlesak and Cerling2008).
Diet affected muscle δ34S (P < 0.001). The four groups presented significantly different values, with the highest in muscle from lambs in the P group and the lowest in muscle from lambs in the S group (Table 5). Overlapping data were observed exclusively between P and P-S14 groups. These results suggest that S SIR of muscle could be used to trace the change of diet, confirming what was observed in the multivariate discriminant analysis, as well as the feeding system (pasture v. stall), in agreement with the results provided by Osorio et al. (Reference Osorio, Moloney, Schmidt and Monahan2011) who obtained a good discrimination between concentrate and pasture fed beef.
In synthesis, both carbon and sulphur SIRs in defatted meat seem to be useful tools to trace the switch from pasture to stall-feeding system. These results disagree with Bahar et al. (Reference Bahar, Moloney, Monahan, Harrison, Zazzo, Scrimgeour, Begley and Schmidt2009) who consider muscle to be an unsuitable tissue for detecting short-term pre-slaughter feeding changes in beef because of the long time required to reach isotopic equilibrium with a new diet. However, Martins et al. (Reference Martins, Ducatti, Martins, Denadai, Natel, Souza-Kruliski and Sartori2012) found that even if the isotopic equilibrium in plasma was not reached after 104 days on the experimental diets, different isotopic ratios were observed and allowed to distinguish the diets offered to the animals. Similarly, the results of the present experiment suggest that the renewal of chemical elements (and their isotopes) was sufficient to ‘trace’ the feeding change from pasture to concentrate even if the isotopic equilibrium in the different tissues was probably not reached due to the short duration of the experiment.
An intriguing challenge is the possibility to trace a pre-slaughter finishing period in grazing animals when the diet is unknown. The current literature allows to give some indications. A finishing diet based on corn should be easy to detect in animals kept on a C3 pasture, thanks to the huge difference in carbon SIR ranges between C3 and C4 feedstuffs. Plasma represents a reliable tissue, owing to its prompt response to the dietary variations. If the finishing diet consists in C3 concentrates, our data and results by Osorio et al. (Reference Osorio, Moloney, Schmidt and Monahan2011) suggest that its detection should be feasible. However, some issues have to be considered: the magnitude of the difference between forages and concentrate SIRs, the different tissue's turnover rate, the effect of nutritive allowance on the elements turnover rate, as observed in muscle (Harrison et al., Reference Harrison, Schmidt, Moloney, Kelly, Rossmann, Schellenberg, Camin, Perini, Hoogewerff and Monahan2011), the length of the finishing period, the source of water. We think that the implementation of a data bank showing the range of each isotopic ratio for each tissue, coupled with the respective diet isotopic composition, and the use of the right statistical methods, could probably allow a correct assignment to an unknown diet. The sequential SIR determination in incremental tissues such as hair, woof and wool, which represent an archive of temporal changes in the isotopic composition of the diet (Monahan et al., Reference Monahan, Moloney, Osorio, Röhrle, Schmidt and Brennan2012), could be considered as supplementary tool: when SIR determination in plasma or defatted muscle gives uncertain results, it could assess the existence of diet changes.
In conclusion, although the results of the present experiment are closely connected to our specific experimental conditions, it is possible to extrapolate that: (i) SIR analysis is able to detect short-time dietary changes; (ii) plasma seems to be a reliable substrate for detecting these changes and might be proposed as a substrate alternative to muscle.
Acknowledgments
Research funded by the University of Catania (Progetto di Ricerca di Ateneo, 2007) and by IASMA Research and Innovation Centre Fondazione E. Mach (Programma di Ricerca 2009).