




No CrossRef data available.
Article contents
Assessment of time perception: The effect of aging
Published online by Cambridge University Press: 01 May 2004
Abstract
Studies concerning time perception lack a validated assessment tool and a consensual “gold-standard” measure. Moreover, the present evidence suggests modification of timing with aging. This study aimed to develop and validate a neuropsychological tool to measure time perception and to study temporal perception with aging. Eighty-six healthy participants, aged 15–90 years old, were asked to verbally estimate and produce empty intervals signaled by auditory beeps, of 7-, 32-, and 58-s duration. Two tests were used as “gold-standards”: estimation of the duration of time necessary to draw a clock (“clock time”) and estimation of the duration of neuropsychological evaluation (“global time”). Results showed a correlation between estimation and production (p < .01) and a correlation between estimation or production and “global time” (p < .01). The correlation between either estimation or production and age (p < .01), suggested a faster “internal-clock” in the older participants. However, this finding lost significance when controlled for literacy. The results suggest that these tests are potentially a useful tool to measure subjective perception of time. They also corroborate the hypothesis of a change in subjective time perception with aging. It was not possible to conclude if this effect was a specific result of aging or biased by the interference of literacy. (JINS, 2004, 10, 332–341.)
Information
- Type
- Research Article
- Information
- Journal of the International Neuropsychological Society , Volume 10 , Issue 3 , May 2004 , pp. 332 - 341
- Copyright
- © 2004 The International Neuropsychological Society
INTRODUCTION
Time perception and measure are essential components of cognition, behavior, and motor performance, representing one of the basic mechanisms of cerebral function (Artieda & Pastor, 1996). Accordingly, temporal processing is an integral part of many everyday goal-oriented behaviors (Mangels & Ivry, 2001), making it a crucial tool for planning future actions.
Temporal perception comprises several subjective phenomena including the judgement of subjective duration (Poppel, 1997). The different aspects of psychological time are interlinked with various attentional, memory, and other cognitive processes (Binkofski & Block, 1996). However, the explanation for subjective timing also assumes the existence of an “internal-clock” mechanism (Binkofski & Block, 1996).
Classically, time perception has been explained by two different theoretical models: scalar expectancy theory (SET) (Gibbon et al., 1984) and attentional-gate theory (AG) (Block, 1990). Both models postulate the existence of a pacemaker (the “clock”) that generates neuronal pulses and the existence of a counter accumulating them. This counter signals when the number of pulses generated reaches a target value corresponding to a given interval duration (Fortin & Breton, 1995). The accumulator serves as a working memory buffer and attention as the gate to working memory. Concomitant nontemporal tasks interfering with working memory and/or competing for attention will reduce the accuracy in temporal perception (Fortin et al., 1993). To our best knowledge there is no data regarding the effect of literacy on time perception.
Quantifying timing is difficult because there is no validated method, despite many tools being available (Bindra & Waksberg, 1956), and it is still lacking a consensual “gold-standard” test to measure temporal perception. There is also some evidence that timing changes with age (Carrasco et al., 2001; Craik & Hay, 1999; Fraisse, 1963), but to what extent and in what direction is still a matter of debate. Since timing is dependent on working memory and attention, it is hypothesized that it should deteriorate along neuropathological processes that interfere with those cognitive functions.
The aims of our study were twofold: to develop and test a neuropsychological tool to measure time perception and to study time perception along normal aging.
MATERIAL AND METHODS
Research Participants
The study was performed in healthy volunteers, defined as participants with no known diseases and not taking drugs known to interfere directly with the central nervous system. It was intended to include ten patients per decade of life, with an age spectrum ranging from 15–90 years old. This sample was not controlled for literacy due to the pragmatic need to define normative values for the Portuguese population, which is characterized by a natural higher literacy in younger individuals; moreover, we were not aware of a previous clear documentation of a specific effect of literacy on time perception. Exclusion criteria were a diagnosis of major depression (MINI International Neuropsychiatry Interview version 4.4–Portuguese version) (Sheehan et al., 1998), a diagnosis of dementia [Mini Mental State Examination (MMSE) validated for the Portuguese population] (Folstein et al., 1975; Guerreiro et al., 1994), the presence of any relevant neurological or psychiatric disease, and the consumption of drugs with central nervous system effect (benzodiazepines with an equivalent dose of diazepam less than 10 mg daily were however accepted). Participants were also excluded if they abused alcohol, consumed more than four “espresso coffee” cups a day, and if they were illiterate or unable to understand the tests. Participants could only be evaluated if they had had a good night sleep according to their usual sleep pattern. All participants gave informed consent.
Experimental Tasks
Temporal estimation and production tests were carried out with a standard Toshiba laptop personal computer and participants wore headphones to listen to the auditory stimuli. The digits on the Digit Span Forward (DSF) and Digit Span Reverse (DSR) (Garcia, 1984; Wechsler, 1969) tests were read by the examiner. Participants sat in a comfortable chair, in a quiet and empty room without any rhythmic sound (e.g., wall clock) and they were asked to remove their watch during the test. All participants were evaluated in the afternoon due to logistical constraints.
The experimental tasks were performed as follows:
Verbal estimation and production of a time interval
This experiment tested the ability to verbally estimate and produce the duration of empty time intervals signaled by auditory beeps. The auditory beeps were of 20-ms duration. A specific software was developed to meet this aim. The durations of time intervals were of 7, 32, and 58 s for both estimation and production tests; every duration was repeated three times in a pseudorandom order (not allowing the repetition of the same number in sequence), so that for both estimation and production tests nine tasks were performed. Participants were not aware they would make nine trials and they did not know the test involved only three possible interval durations.
Estimation test. Participants were told that they would have to verbally estimate the duration of different intervals; one auditory beep indicated the onset of the interval while another indicated its end; the beeps were separated by a silent interval. Participants were instructed to start internal (“mental”) counting of seconds after listening to the first auditory beep and to stop counting when they heard the second beep. They were specifically instructed not to count aloud nor to perform any digital counting, or use any body rhythm to help in the estimation. Then they were asked “how many seconds elapsed between the two beeps?”. The test proper was preceded by a test run with an interval duration of 4 s. The outcome measure was the ratio between the estimated duration and the target (7, 32, or 58 s) one. For each participant, we calculated the mean of the nine ratios and this value was entered for the group statistical analysis.
Production test. Participants were told that they would have to verbally produce different interval durations. In this task, an auditory beep indicated the onset of the interval and its end was indicated by the participants, by telling the examiner when they thought they had reached the target duration. Participants were asked to start internal counting of seconds after they heard the first beep and to tell the examiner when they thought they had reached the target duration. The examiner wore a chronometer to know how many seconds had the participant really produced. The test proper was preceded by a test run with an interval duration of 4 s. The outcome measure was the ratio between the produced duration (the value on the examiner's chronometer) and the target (7, 32, or 58 s) one. For each participant, we calculated the mean of the nine ratios and this value was entered for the group statistical analysis.
“Gold-standards”
We assumed as “gold-standards” two tests we accepted as ecological, which replicate real-life time measurements. In both cases, the participants were not aware they would be asked to retrospectively estimate the time elapsed during a certain task.
Clock time. Participants were asked to draw a clock on a blank sheet of paper. After finishing the drawing, the examiner asked the participant how much time had elapsed between the moment he held the pen and finished the drawing. The examiner used a chronometer to measure the duration of the task. The chronometer was started when the participant picked up the pen and stopped when the participant placed it on the paper. The outcome measure was the ratio between the estimated time and the “real” duration measured by the examiner.
Global time. At the very end of the neuropsychological evaluation, the examiner asked the participant how much time had elapsed since they started the current evaluation. The onset of the evaluation had been indicated out loud by the examiner with the sentence: “we are going to start the tests now” and the examiner specifically referred to that moment when asking the participant about the elapsed time. The examiner wore a chronometer to know how much time the evaluation had lasted. The chronometer was started when the examiner said the mentioned sentence and stopped just before the examiner asked the participant about the elapsed time. The outcome measure was the ratio between the estimated time and the duration measured by the examiner.
Digit Span Forward and Digit Span Reverse
These tests were used to measure the attention/short-term and working-memory capacity of the participants. In the Digit Span Forward, the examiner told the participant a maximum of seven sequences of digits, each with an increasing number of digits (up to a maximum of nine digits) and at the end of each sequence the participants were asked to repeat it in the same order. The Digit Span Reverse was identical but the participant had to repeat each sequence of digits in the reverse order. The outcome was the highest number of digits the participants could repeat correctly. The digit span was the last test to be performed at the end of the evaluation.
Statistical Analysis
Estimation test
The outcome measure was the ratio between the estimated duration and the target (7, 32, or 58 s) duration. For each participant, we calculated the mean of the nine ratios.
If the ratio was superior to 1, the participant was said to overestimate, indicating that the hypothetical “internal-clock” was going faster. If the ratio was inferior to 1, the participant was said to underestimate, indicating that the “internal-clock” was going slower.
Production test
The outcome measure was the ratio between the produced duration (the value on the examiner's chronometer) and the target (7, 32, or 58 s) duration. For each participant, we calculated the mean of the nine ratios. If the ratio was superior to 1, the participant was said to overproduce, indicating that the hypothetical “internal-clock” was going slower. If the ratio was inferior to 1, the participant was said to underproduce, indicating that the “internal-clock” was going faster.
Clock time
The outcome measure was the ratio between the estimated time and the duration measured by the examiner.
Global time
The outcome measure was the ratio between the estimated time and the duration measured by the examiner.
Digit Span
For each participant, we recorded the highest number of digits the participant could repeat, both in DSF and DSR.
We studied the relation between estimation and production tests results and the two “gold-standards”. A sub-analysis was also performed, studying the relation between the different time intervals (7, 32, and 58 s) and both clock and global time.
The age effect on estimation, production, clock time, global time, and digit span were studied. The relation between the digit span and estimation, production, clock time, and global time was also investigated.
A comparison of estimation, production, clock time, and global time was made between three predefined age groups (group A: 15–40 years old; group B: 41–64 years old; group C: 65–90 years old). These age intervals were chosen according to what we assumed represents different stages of aging: young, middle-age, and elderly people, respectively. We studied the effect of education and gender in estimation, production, clock time, and global time. Education (number of years in school) was compared between the three aforementioned age groups. The effect of literacy on time perception was analyzed as a covariate. The analysis of metric properties of estimation and production variables showed they had a near-normal distribution. Although the size of the sample allowed for parametric tests, we chose to make use of nonparametric tests in statistical analysis. Relations between variables were studied using nonparametric tests for correlations (Spearman test), and comparisons of variables between the three age groups were made using nonparametric tests of variance (Kruskal-Wallis test).
RESULTS
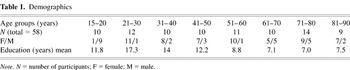
Ninety-seven participants were screened to participate in this study. Seven participants were excluded due to diagnosis of dementia according to MMSE (4 participants) and diagnosis of major depression according to the MINI International Neuropsychiatry Interview (3 participants). One participant was excluded because she was not able to understand the test instructions. Three individuals did not complete the evaluation due to tiredness, and their results were not included in the analysis. The final sample was of 86 participants and the data of these participants were the basis for the analysis. Their age ranged from 15–90 years old. There were 58 female and 28 male participants. There were roughly ten participants per decade of life (Table 1).
Demographics

Overall, the verbal estimation and production tests were easy to explain and perform.
Concerning the metric properties of estimation and production, the median value for estimation was 1.081 (Min .2128 and Max 6.3988) and the median value for production was .8224 (Min .3382 and Max 1.788), with a statistical significant negative correlation between estimation and production (p < .01; r = −.5509).
A positive correlation was found between estimation and global time (p < .01; r = .0712), and a negative correlation between production and global time (p < .01; r = −.1591). A correlation of estimation or production and clock time was not demonstrated, as well as a correlation between clock and global time. The different time intervals (7, 32, and 58 s), in both estimation and production tests, were all correlated with global time but not with clock time, and the power of correlation was similar between them.
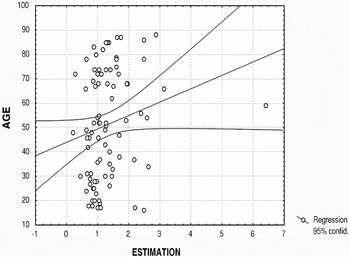
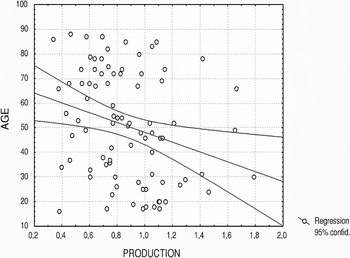
A positive correlation was found between estimation and age, suggesting that older participants had faster “internal-clocks” (p < .01; r = .2978) (Figure 1a). Conversely, a negative correlation was found between production and age, also indicating an association between older participants and faster “internal-clocks” (p < .01; r = −.2731) (Figure 1b). We could not find a correlation between age and either clock time or global time. All previous analysis lost statistical significance when controlled for literacy. Age was negatively correlated with education (p < .01; r = −.6). The results showed a negative correlation between education and estimation (p < .01; r = −.3951) and global time (p < .05; r = −.2521), and a positive correlation between education and production (p < .01; r = .3612), suggesting that participants with lower level of education had faster “internal-clocks”.

Correlation of age with time estimation. Age was positively correlated [p < .01 (Spearman test r = .29)] with the estimation of time, suggesting an acceleration of the “internal-clock” with aging.

Correlation of age with time production. Age was negatively correlated [p < .01 (Spearman test r = −.27)] with the production of time, suggesting an acceleration of the “internal-clock” with aging.
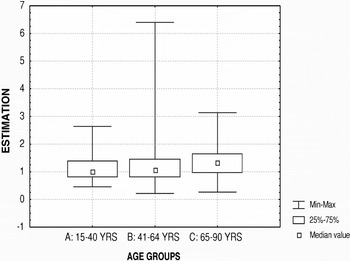
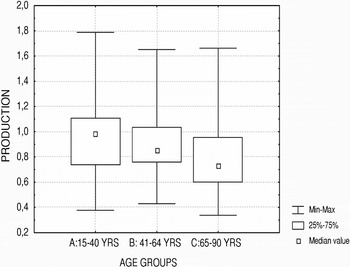
We compared the difference in performance between three predefined age groups (group A: 15–40 years old, mean 26.84, SD (standard deviation) 7.21; group B: 41–64 years old, mean 50.72, SD 4.93; group C: 65–90 years old, mean 75.84, SD 7.18; 95% confidence interval). When estimation was compared between the age groups there was a trend toward overestimation with older age, suggesting acceleration of “internal-clocks” with age (Figure 2a). The same analysis about production showed a trend toward underproduction with age, also suggesting acceleration of “internal-clock” with age (Figure 2b).

Comparison of mean values of time estimation between three age groups. There was a trend towards overestimation of time with aging.

Comparison of mean values of time production between three age groups. There was a trend towards underproduction of time with aging.
The performance on estimation, production, clock time, and global time tasks was not significantly different between female and male participants.
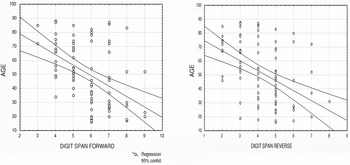
As expected from the literature, we found a negative correlation between DSF/DSR and age (p < .01; r = −.4715, for DSF; p < .01; r = −.4658, for DSR) (Figure 3).

Correlation of Digit Span Forward with age [p < .01 (Spearman test r = −.47), left figure] and Digit Span Reverse with age [p < .01 (Spearman test r = −.46), right figure] showing a decrease performance with aging.
The results showed a negative correlation between DSF/DSR and estimation (p < .01; r = −.3398, for DSF; p < .05; r = −.2434 for DSR) (Figure 4a). There was a positive correlation between production and DSF/ DSR (p < .01; r = .3286, for DSF; p < .01; r = .3902, for DSR) (Figure 4b).

Fig 4a. Correlation of time estimation with Digit Span Forward [p < .01 (Spearman test r = −.34), left figure] and time estimation with Digit Span Reverse [p < .05 (Spearman test r = −.24), right figure] showing that overestimation of time is associated with a decrease performance in tests of attention and short-term memory/working memory.
Fig 4b. Correlation of time production with digit span forward [p < .01 (Spearman test r = .39), left figure] and time production with Digit Span Reverse [p < .01 (Spearman test r = .33), right figure] showing that underproduction of time is associated with a decrease performance in tests of attention and short-term memory/working memory.
DISCUSSION
The results of this study showed an internal consistency between the performance on estimation and production tests, and found a correlation between those tasks and one of the chosen “gold-standards” tests, suggesting that our assessment tool is a potentially good measure of time duration. The results also showed a change of estimation and production of time intervals with aging, suggesting an association of aging with a faster “internal-clock”.
The extensive literature on time perception often differ on the methods used to measure temporal perception. However, none of these methods has yet been properly validated in a normal population, casting doubt on the theoretical models based on their results. Also, as recognized by Allan (1979) and McConchie and Rutschmann (1971), no single method can claim a consistent superiority over the others and the correlation between them is either poor or absent.
The aim of this study was to develop a neuropsychological tool to measure subjective duration and, secondly, to study temporal perception along normal aging. Firstly, we tried to overcome the lack of a “gold-standard” test, that is, a test that reliably measures what we want it to measure–subjective time perception. Thus, the first step was to identify a real-life measure against which our tests could be compared. The “gold-standard”, which is in any case relative, should be as feasible and as close as possible a measure of temporal perception of everyday life, that is to say, a pragmatic measure of the processing of temporal information by the brain in real-life conditions. We assumed as a “gold-standard” for subjective duration the “clock time” test and the “global time” test. In both tests, the participants performed tasks without knowing they would be asked to estimate the time elapsed during their performance. They made retrospective evaluations, not paying attention to the passage of time, instead allocating attention towards the tasks themselves. We believe they inferred duration from contents of memory, memory for events, number of transitions between events, and expectation for duration of events (Block & Zakay, 1997; Ornstein, 1969). Thus, retrospective timing seems to depend mostly on long-term memory and contextual events (Mangels & Ivry, 2001; Zakay, 1990). On the other hand, during the tests of verbal estimation and production, participants knew they should actively monitor the passage of time. Their prospective measurement was mostly dependent on attention, mostly attention to the variable “time”, and working memory (Mangels & Ivry, 2001; Zakay, 1990).
The evidence that retrospective and prospective timing depend upon different cognitive processes may explain the weak association we found of estimation and production with “global time” and the lacking association of estimation and production with “clock time”. Besides, an ecological measure of time perception should have some utility for the participant, acting as a motivational drive. While the “global time” measure was surely being subjectively assessed for its duration, the “clock time” measure had little usefulness or meaning for the participants of the experiment. This may explain its lack of correlation with more conscious measures of time perception. Possibly, this difference in usefulness between the “global time” and the “clock time” measures also explains the lack of association between each other. An alternative explanation could be their difference in magnitude duration (the “global time” in the range of 20–25 min while the “clock time” in the range of a few seconds). In future experiments, we plan to compare the estimation and production measures with ecological “gold-standards” that require prospective timing and more meaningful time intervals, eventually increasing the strength of their statistical association; moreover, if more than one “gold-standard” is used, they should be of same magnitude and duration. Interestingly, when comparing estimation, production, “global time”, and “clock time” between the three age groups, we found the same trend towards acceleration of the “internal-clock” in older participants, suggesting that prospective and retrospective timing may share common cognitive mechanisms.
We found an association of estimation with production, which gives internal consistency to our results, and allows speculating about a common “internal-clock” subserving estimation and production (Ivry & Hazeltine, 1995; Keele et al., 1985).
This study showed an age effect on Digit Span, and a change of estimation and production with aging when compared between the three predefined age groups. This trend was towards an acceleration of “internal-clock” in older participants. A smaller study performed by Carrasco and coworkers (2001) found similar results when comparing time estimation between young and elderly healthy participants. The study consisted of 25 adults, and the mean age of the young (26.15 years) and the elderly groups (79.1 years) were similar to that of groups A and C in our study. The methodology and the time-interval duration (10 s) were very similar to ours. Surprisingly, both results are in contrast with a previous study that found an association of older age with slower “internal-clock” (Craik & Hay, 1999). In that study, the interval durations were of the same range (30, 60, and 120 s) as ours, but the paradigms of estimation and production differed slightly, namely, participants performed the estimation and production tests while performing other tasks at different levels of complexity, and this discrepancy in methodology can make comparison difficult. Data concerning age and short time intervals is still scanty and inconclusive though (Nichelli, 1993). A study from Fraisse (1963) showed an association of aging with acceleration of “internal-clock” regarding large units of time such as days or years; however, people estimates of intervals in range of hours may be related to sleep–wake cycles (Artieda & Pastor, 1996).
The effect of education on cognition is well established, although we are not aware of any clear documentation of a specific effect of literacy on time perception. We found a correlation of education with estimation, production and “global time”, suggesting faster “internal-clocks” in participants with lower education. However, as it was anticipated from the characteristics of the Portuguese population and as our sample was not purposefully controlled for literacy, older participants were less literate. The correlation between either estimation or production and aging lost significance when education was analyzed as a co-variate. The absence of a statistical difference of years of education between the three predefined age groups argues against a primary effect of education on our results, suggesting that the association of older participants with faster “internal-clocks” derives mainly from aging. Nevertheless, it is not possible to firmly conclude if the association of older participants with faster “internal-clocks” is a specific result of aging or biased by the interference of literacy. As the design of the present study was not intended to look for an effect of education on timing, future studies must be conducted specifically to address this interesting question.
Our results demonstrated an association between estimation and production and both DSF and DSR, while there was no association between DSF and DSR, and either both “clock time” or “global time”. This adds further evidence regarding the role of attention/short-term and working memory in prospective timing but not in retrospective timing (Block, 1992; Block & Zakay, 1997; Brown, 1997; Mangels & Ivry, 2001). Nevertheless, the association of estimation and production with Digit Span may result from an effect of age on both tasks.
The performance was similar between female and male participants in all tasks, though a disproportionate number of females were present in our sample.
Participants were explicitly asked to perform the estimation and production tests by internal counting of seconds and the intention was to have them producing their idea of 1 s. The strategy of internal counting has been considered to increase the accuracy of estimation (Davis, 1962; Fraisse, 1984; Wearden, 1991). Counting was also aimed at giving a homogeneous activity for all participants during estimation and production tasks (Rubia et al., 1997).
Physiopathologic speculations may be too premature, because replication of our results is still needed. Nevertheless, and according to present theoretical models (Block, 1990; Gibbon et al., 1984), the observed deficit in time estimation could derive from a change in the speed of the “internal-clock”, which has been associated with several conditions (Binkofski, 1996; Carrasco et al., 2000; Meck, 1996; Pastor et al., 1992). Alternatively, a deficit in attention and working memory associated with aging could disrupt the counter system that accumulates the pulses generated by the “internal-clock”. Studies demonstrating deficits in time perception in Alzheimer and Parkinson disease (Carrasco et al., 2000; Pastor et al., 1992; Riesen & Schnider, 2001) suggest the possible involvement of neurotransmitters such as acetylcholine and dopamine in time perception.
Our results showed an acceleration of “internal-clock” with aging, and also suggested a role for attention and short-term/working memory on prospective timing. The assessment tool presented was easy to perform and was related to one ecological measure of time perception. Nevertheless, and due to its moderate association with the “gold-standards” and possible bias of results due to literacy, future well-designed studies are needed to replicate the present findings, to analyze its interobserver and intrasubject validity, and to confirm its potential usefulness. If the present findings are confirmed, they must be explained in the light of current theoretical models for time perception.
ACKNOWLEDGMENTS
This study was supported by Grant 59/98 from Fundação Bial, Portugal.
References
REFERENCES
Allan, L.G.
(1979).
The perception of time.
Perception and Psychophysics,
26,
340–354.Google Scholar
Artieda, J. &
Pastor, M.A.
(1996).
Time, internal clocks and movement. In
G.E. Stelmach &
P.A. Vroon (Eds.),
Advances in psychology, Vol. 115 (pp.
1–27).
Amsterdam:
Elsevier.
Bindra, D. &
Waksberg, H.
(1956).
Methods and terminology in the studies of time estimation.
Psychological Bulletin,
63,
155–159.Google Scholar
Binkofski, F. &
Block, R.A.
(1996).
Accelerated time experience after left frontal cortex lesion.
Neurocase,
2,
485–493.Google Scholar
Block, R.A.
(1990).
Models of psychological time. In
R.A. Block (Ed.),
Cognitive models of psychological time (pp.
1–35).
Hillsdale, New Jersey:
Lawrence Erlbaum Associates.
Block, R.A.
(1992).
Prospective and retrospective duration judgment: The role of
information processing and memory. In
F. Macar &
V. Pouthas (Eds.),
Time, action and cognition: Towards bridging the gap (pp.
141–152).
Dordrecht, Netherlands:
Kluwer Academic.
Block, R.A. &
Zakay, D.
(1997).
Prospective and retrospective duration judgments: A meta-analytic
review.
Psychonomic Bulletin and Review,
4,
184–197.Google Scholar
Brown, S.W.
(1997).
Attentional resources in timing: Interference affects in concurrent
temporal and nontemporal working memory tasks.
Perception and Psychophysics,
59,
1118–1140.Google Scholar
Carrasco, M.C.,
Guillem, M.J., &
Redolat, R.
(2000).
Estimation of short temporal intervals in Alzheimer's disease.
Experimental Aging Research,
26,
139–151.Google Scholar
Carrasco, M.C.,
Bernal, M.C., &
Redolat, R.
(2001).
Time estimation and aging: A comparison between young and elderly
adults.
International Journal of Aging and Human Development,
52,
91–101.Google Scholar
Craik, F.I.M. &
Hay, J.F.
(1999).
Aging and judgments of duration: Effects of task complexity and
method of estimation.
Perception and Psychophysics,
61,
549–560.Google Scholar
Davis, R.
(1962).
L'estimation d'intervalles temporels en comptant plus ou moins
rapidement.
Anné Psychologique,
62,
29–44.Google Scholar
Folstein, M.F.,
Folstein, S.E., &
McHugh, P.R.
(1975).
Mini-Mental State. A practical method for grading the cognitive
state of patients for the clinician.
Journal of Psychiatry Research,
12,
189–198.Google Scholar
Fortin, C. &
Breton, R.
(1995).
Temporal interval production and processing in working memory.
Perception and Psychophysics,
57,
203–215.Google Scholar
Fortin, C.,
Rousseau, R.,
Bourque, P., &
Kirouac, E.
(1993).
Time estimation and concurrent nontemporal processing: Specific
interference from short-term memory demands.
Perception and Psychophysics,
53,
536–548.Google Scholar
Fraisse, P.
(1963).
The psychology of time.
New York:
Harper.
Fraisse, P.
(1984).
Perception and estimation of time.
Annual Review of Psychology,
35,
1–36.Google Scholar
Garcia, C.
(1984).
A Doença de Alzheimer. Problemas de diagnóstico
clínico. Dissertação de Doutoramento.
Lisboa:
Faculdade de Medicina de Lisboa.
Gibbon, J.,
Church, R.M., &
Meck, W.
(1984).
Scalar timing in memory. In
J. Gibbon &
L. Allan (Eds.),
Annals of the New York Academy of Sciences, Vol. 423: Timing and
time perception (pp.
52–77).
New York:
New York Academy of Sciences.
Guerreiro, M.,
Silva, A.P.,
Botelho, M.A.,
Leitão, O.,
Castro-Caldas, A., &
Garcia, C.
(1994).
Adaptação à População Portuguesa
da tradução do “Mini Mental State
Examination” (MMSE).
Revista Portuguesa de Neurologia,
1,
9–10.Google Scholar
Ivry, R. &
Hazeltine, R.E.
(1995).
Perception and production of temporal intervals across a range of
duration: Evidence for a common timing mechanism.
Journal of Experimental Psychology: Human Perception and
Performance,
21,
3–18.Google Scholar
Keele, S.W.,
Pokorny, R.A.,
Corcos, D.M., &
Ivry, R.
(1985).
Do perception and motor production share common timing mechanisms:
A correlational analysis.
Acta Psychologica,
60,
173–191.Google Scholar
Mangels, J.A. &
Ivry, R.B.
(2001).
Time perception. In
B. Rapp (Ed.),
Handbook of cognitive neuropsychology: What deficits recall about
the human mind,
Chapter 19 (pp.
467–493).
Hove:
Psychological Press.
McConchie, R.D. &
Rutschmann, J.
(1971).
Human time estimation: On difference between methods.
Perceptual and Motor Skills,
32,
319–336.Google Scholar
Meck, W.H.
(1996).
Neuropharmacology of timing and time perception.
Cognitive Brain Research,
3,
227–242.Google Scholar
Nichelli, P.
(1993).
The neuropsychology of human temporal information processing. In
F. Boller &
J. Grafman (Eds.),
Handbook of neuropsychology, Vol. 8 (pp.
339–371).
Amsterdam:
Elsevier.
Ornstein, R.E.
(1969).
On the experience of time.
Harmondsworth, England:
Penguin Books.
Pastor, M.A.,
Artieda, J.,
Jahanshahi, M., &
Obeso, J.
(1992).
Time estimation and reproduction is abnormal in Parkinson's
disease.
Brain,
115,
211–225.Google Scholar
Poppel, E.
(1997).
A hierarchical model of temporal perception.
Trends in Cognitive Sciences,
1,
56–61.Google Scholar
Riesen, J.M. &
Schnider, A.
(2001).
Time estimation in Parkinson's disease: Normal long duration
estimation despite impaired short duration discrimination.
Journal of Neurology,
248,
27–35.Google Scholar
Rubia, K.,
Schuri, U.,
Cramon, D.Y.V., &
Poppel, E.
(1997).
Time estimation as a neuronal network property: A lesion study.
NeuroReport,
8,
1273–1276.Google Scholar
Sheehan, D.V.,
Lecrubier, Y.,
Sheehan, K.H.,
Amorim, P.,
Janavs, J.,
Weiller, E.,
Hergueta, T.,
Baker, R., &
Dunbar, G.C.
(1998).
The Mini-International Neuropsychiatric Interview (M.I.N.I): The
development and validation of a structured diagnostic psychiatric interview
for DSM-IV and ICD-10.
Journal of Clinical Psychiatry,
59, 22–33; quiz
34–57.
Adapted to Portuguese (Portugal) by T. Guterres.Google Scholar
Wearden, J.H.
(1991).
Do humans possess an interval clock with scalar timing properties?
Learning and Motivation,
22,
59–83.Google Scholar
Wechsler, D.A.
(1969).
Manuel de I'èchelle clinique de mémoire.
Paris, France:
Centre de Psychologie Appliquée.
Zakay, D.
(1990).
The evasive art of subjective time measurement. In
R.A. Block (Ed.),
Cognitive models of psychological time (pp.
59–84).
Hillsdale, New Jersey:
Lawrence Erlbaum Associates.
Demographics
Correlation of age with time estimation. Age was positively correlated [p < .01 (Spearman test r = .29)] with the estimation of time, suggesting an acceleration of the “internal-clock” with aging.
Correlation of age with time production. Age was negatively correlated [p < .01 (Spearman test r = −.27)] with the production of time, suggesting an acceleration of the “internal-clock” with aging.
Comparison of mean values of time estimation between three age groups. There was a trend towards overestimation of time with aging.
Comparison of mean values of time production between three age groups. There was a trend towards underproduction of time with aging.
Correlation of Digit Span Forward with age [p < .01 (Spearman test r = −.47), left figure] and Digit Span Reverse with age [p < .01 (Spearman test r = −.46), right figure] showing a decrease performance with aging.
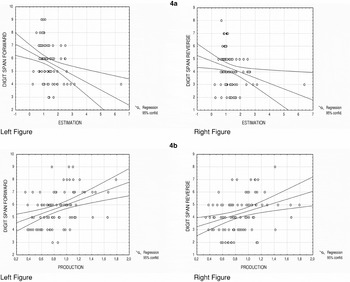
Fig 4a. Correlation of time estimation with Digit Span Forward [p < .01 (Spearman test r = −.34), left figure] and time estimation with Digit Span Reverse [p < .05 (Spearman test r = −.24), right figure] showing that overestimation of time is associated with a decrease performance in tests of attention and short-term memory/working memory.Fig 4b. Correlation of time production with digit span forward [p < .01 (Spearman test r = .39), left figure] and time production with Digit Span Reverse [p < .01 (Spearman test r = .33), right figure] showing that underproduction of time is associated with a decrease performance in tests of attention and short-term memory/working memory.
 You have
Access
- 59
- Cited by