INTRODUCTION
Cetaceans (e.g. whales, dolphins and porpoises) arguably represent the most successful invasion of the marine environment by a group of tetrapods, corresponding to shifts in dietary strategy (Slater et al., Reference Slater, Price, Santini and Alfaro2010). In the Odontoceti suborder, the evolution of echolocation has led to the honing of the beam-focusing ability by individuals to detect underwater prey species. Odontocetes produce powerful high-frequency sonar sound, called clicks, which are often produced as a sequence of pulse sounds (termed a click train). They receive echoes to examine their environment and objects, including prey items. This characteristic has been utilized by researchers to monitor the presence of odontocetes, elucidate their behaviour and estimate population abundance. This monitoring method is termed passive acoustic monitoring (PAM), and has been increasingly used to determine the status of animals, especially endangered species, in addition to documenting effects of anthropogenic sounds and noise mitigation for animal conservation (reviewed by Mellinger et al., Reference Mellinger, Stafford, Moore, Dziak and Matsumoto2007).
The characteristics of the sounds produced by target species should be examined prior to PAM. Acoustic features, such as the sound source level, beam pattern, or sound production rate, have been investigated in laboratories or pools, and knowledge about these sounds continues to grow. However, it has been questioned whether sounds produced by trained animals in captivity are representative of the signals produced by free-ranging animals in natural habitats (e.g. Madsen & Wahlberg, Reference Madsen and Wahlberg2007); nevertheless, research remains limited, or without experimental controls, for wild animals with respect to the testing of specific echolocation features. A major focus of bioacoustics research is the source level (SL) of sound (Van Parijs & Corkeron Reference Van Parijs and Corkeron2001; Villadsgaard et al., Reference Villadsgaard, Wahlberg and Tougaard2007; Kyhn et al., Reference Kyhn, Tougaard, Jensen, Wahlberg, Stone, Yoshinaga, Beedholm and Madsen2009, Reference Kyhn, Jensen, Beedholm, Tougaard, Hansen and Madsen2010; Morisaka et al., Reference Morisaka, Karczmarsk, Akamatsu, Sakai and Thornton2011; Wahlberg et al., Reference Wahlberg, Jensen, Aguilar Soto, Beedholm, Bejder, Oliveira, Rasmussen, Simon, Villadsgaard and Madsen2011). SL is a key component in identifying the acoustic active space of dolphins, and for calculating the effective observation range when using PAM (e.g. Van Parijs & Corkeron Reference Van Parijs and Corkeron2001; Kimura et al., Reference Kimura, Akamatsu, Li, Dong, Dong, Wang, Wang and Arai2010). As dolphins tend to reduce their output level in captivity (see discussion in Van Parijs & Corkeron Reference Van Parijs and Corkeron2001; Villadsgaard et al., Reference Villadsgaard, Wahlberg and Tougaard2007; Wahlberg et al., Reference Wahlberg, Jensen, Aguilar Soto, Beedholm, Bejder, Oliveira, Rasmussen, Simon, Villadsgaard and Madsen2011), this parameter requires examination under natural conditions.
There has been a limited focus on the acoustics of the Indo-Pacific humpback dolphin (Sousa chinensis). Individuals of this species are likely to distribute discontinuously in the nearshore and brackish waters of south-east Asia and northern Australia (Jefferson & Van Waerebeek Reference Jefferson and Van Waerebeek2004), although the taxonomic status of this species has yet to be resolved, with the Australian population possibly being a different species (Frere et al., Reference Frere, Seddon, Palmer, Porter and Parra2011). The humpback dolphin is of particular scientific interest because it lives in close proximity to areas that are increasingly being disturbed by anthropogenic activity, including water pollution, by-catch, overfishing of prey species and noise pollution from shipping or construction (e.g. Jefferson et al., Reference Jefferson, Hung, Robertson and Archer2012).
The Indo-Pacific humpback dolphin is known to produce at least three types of sounds: echolocation clicks, whistles and burst-pulses (Van Parijs & Corkeron Reference Van Parijs and Corkeron2001; Sims et al., Reference Sims, Vaughn, Hung and Würsig2011). Echolocation clicks are considered to be broadband sounds with a high peak frequency of more than 100 kHz (Goold & Jefferson, Reference Goold and Jefferson2004; Li et al., Reference Li, Wang, Wang, Taylor, Cros, Shi, Wang, Fang, Chen and Kong2012, Reference Li, Wang, Wang, Taylor, Cros, Shi, Wang, Fang, Chen and Kong2013), and are similar to those produced by the Delphinidae family. In the present study, we estimate the SLs of on-axis echolocation signals, when free-ranging humpback dolphins manoeuvre their biosonar beam to focus on hydrophone arrays. This study presents the first report on the SLs of humpback dolphins, with no previous information existing for wild or captive individuals.
MATERIALS AND METHODS
Fieldwork
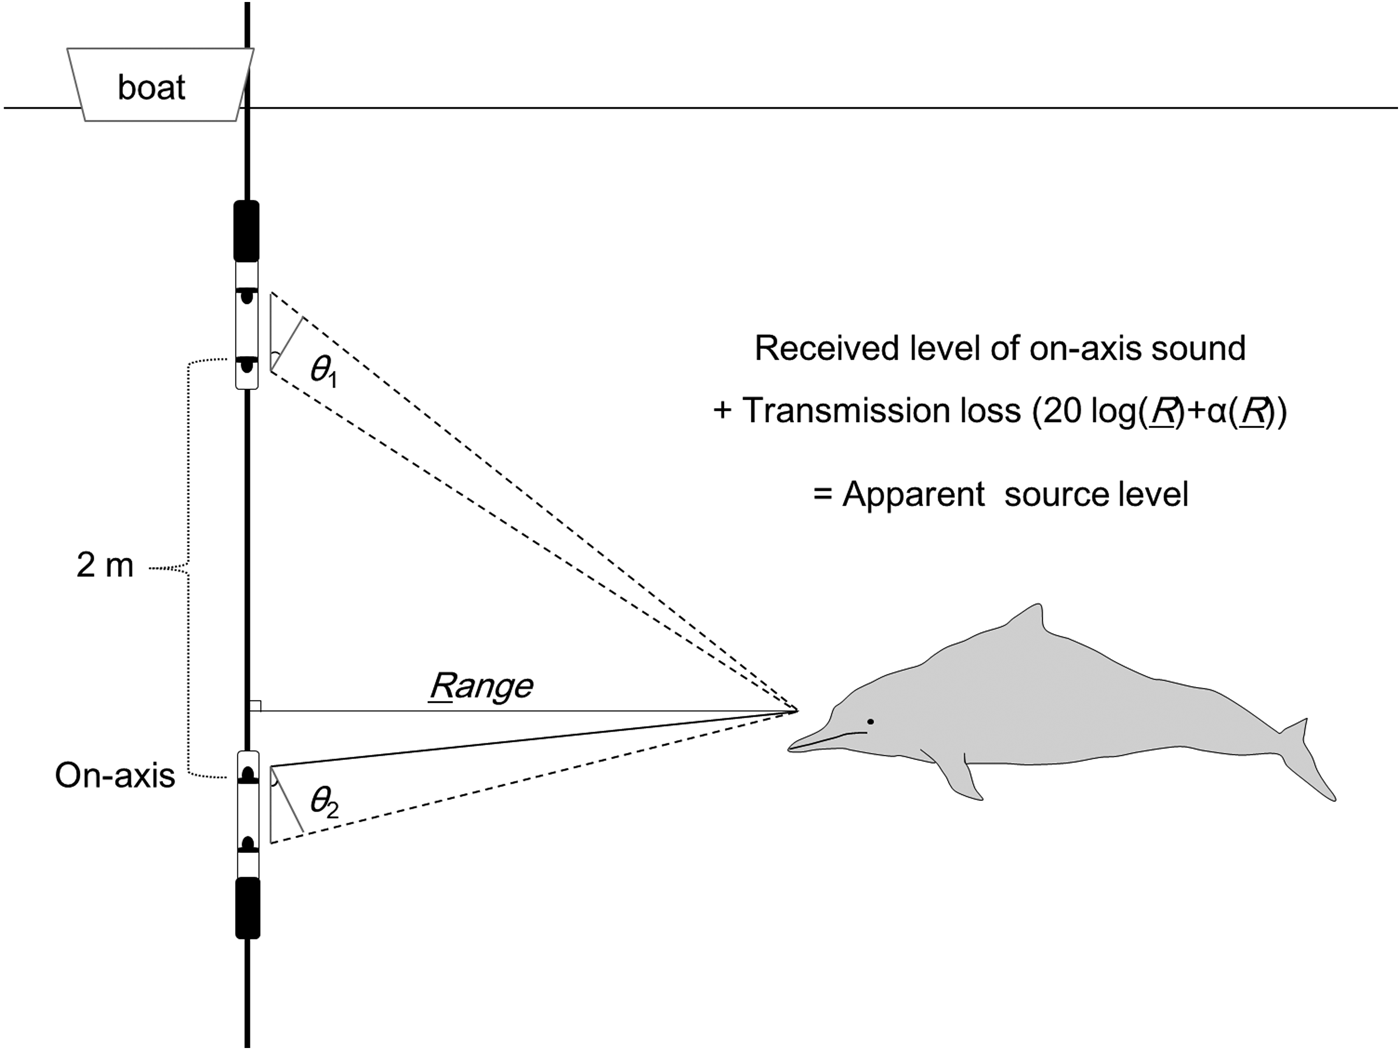
Recordings were made in San-Niang Bay, China, which is located close to the north-east border of Vietnam. We deployed an array that consisted of an iron pipe attached to two A-tags (Marine Micro Technology, Japan), which were vertically positioned 2 m apart (Figure 1) on 20 and 21 December 2011, respectively. The recording location was 6–10 km from the coastline (21°32–34′N 108°46–54′E), and at a seabed depth of approximately 3–6 m. The target sounds were the echolocation signals of Indo-Pacific humpback dolphins, which have a dominant frequency at around 100–120 kHz (Li et al., Reference Li, Akamatsu, Wang and Wang2012, Reference Li, Wang, Wang, Taylor, Cros, Shi, Wang, Fang, Chen and Kong2013). When dolphins were sighted, the array was suspended vertically from the boat. The top hydrophones were positioned approximately 0.5–1 m below the surface.
Localization of on-axis sonar using two A-tags. The A-tags on the iron pipes (thick lines) calculate the bearing angles (θ 1, θ 2) of the sound source from the differences in the time-of-arrival for the same signal between the two hydrophones (black dots). The range to a dolphin from the array was calculated using a trigonometric function. In the case of an on-axis sound, the received level would be larger at the two middle hydrophones than at the two outside ones.

Recording system
An A-tag consists of two ultrasonic hydrophones that are positioned approximately 190 mm apart, with a passive band-pass filter circuit (−3 dB, range: 55–235 kHz), a high-gain amplifier (+60 dB), a CPU (PIC18F6620; Microchip Technology, Detroit, MI, USA), flash memory (128 MB) and a lithium battery (CR2) housed in a waterproof aluminium case, which records a maximum of 159.4 dB re 1 µPa. This system is a pulse-event recorder that records the sound pressure level (SPL) and time-of-arrival differences for the same signal between the two hydrophones. The data are used to calculate the bearing angle of the sound source. Because it is a pulse-event recorder, this system does not record the waveform of the received sound.
The sensitivity of each A-tag was calibrated using a broadband transmission system to simulate the impulse waveform of delphinid biosonar type sounds in an acoustic measurement tank (10 m in width, 15 m in length and 10 m in depth) at the Fisheries Research Agency in Ibaraki, Japan (Imaizumi et al., Reference Imaizumi, Furusawa, Akamatsu and Nishimori2008). The system generated a 10-cycle tone burst at a range of frequencies between 40 and 200 kHz. Exposed sound pressure could be directly compared with recorded sound pressure. Although the sound component below 55 kHz was excluded, broadband calibration, including the dominant energy component of the dolphin, was fairly reliable for measuring the received sound pressure level.
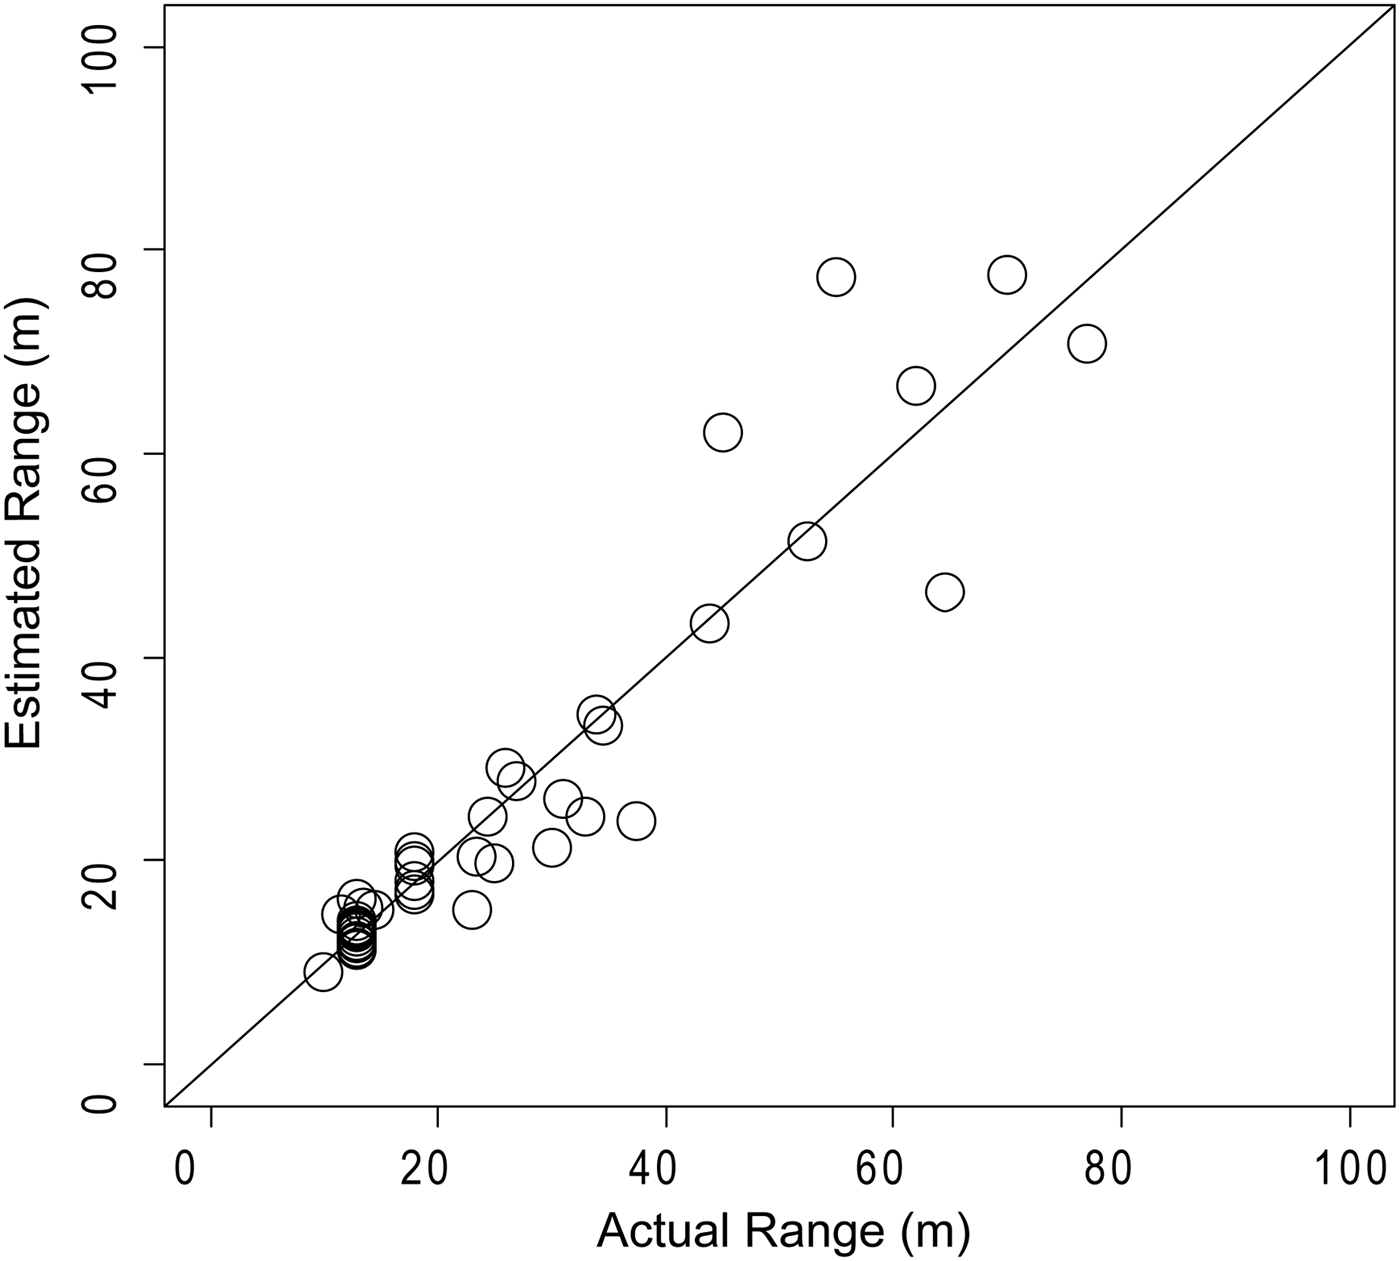
The array localization performance was evaluated at the 6 m depth point in Katana harbour, Japan, by using ranges from the array to passing ships which we measured by a laser range-finding system (Laser 1200s, Nikon, Japan). The range was estimated using the A-tag array, which was suspended in the same way as the recording in San-Niang Bay, China (Figure 1).
Off-line analysis of click train
A custom-made program developed using IGOR PRO 6.03 (Wave Metrics, Lake Oswego, OR, USA) was used to detect dolphin click trains. To standardize the dataset for comparison, the threshold level was set at 132.5 dB re 1 µPa in the off-line analysis. Pulses occurring within 1 ms of the direct path pulse were eliminated as possible reflections from the seabed or water surface. Click trains were defined as containing more than six pulses with ICIs from 1 to 200 ms, which means click trains were considered to be separate for inter-click interval (ICIs) >200 ms.
Because a large number of click trains were recorded within a single day (>1000), we were able to extract only typical click trains that had less than 0.4 coefficient variance of ICIs by using automated click train detection (for more details see Kimura et al., Reference Kimura, Akamatsu, Li, Dong, Dong, Wang, Wang and Arai2010). Click trains that were detected by the off-line filter were then checked visually to exclude reflections that had smaller SPLs than direct signals (Li et al., Reference Li, Wang, Wang and Akamatsu2006), which is apparent noise with randomly changing patterns of SPLs and ICIs, or signals from other dolphins exhibiting double-cyclic changing patterns of SPLs and ICIs (Kimura et al., Reference Kimura, Akamatsu, Li, Dong, Dong, Wang, Wang and Arai2010). The characteristic pattern of SPLs and ICIs (Figure 2) was also used to match the same click train recorded by two A-tags. The number of clicks, duration and average ICI in each click train was examined.
Example of a click train recorded in an A-tag. Apparent source level should be calculated from the received level of the third click (thick arrow). Errors in bearing angle (thin arrows) were caused because the A-tag triggered a second peak in the waveform.
Estimation of range and source level
Source level is defined as the sound pressure level that is back-calculated to 1 m from the sound source. It should be measured on-axis from the sound source (i.e. the dolphin), because of the high directionality of the echolocation beam (e.g. Branstetter et al., Reference Branstetter, Moore, Finneran, Tormey and Aihara2012). To identify on-axis clicks, we applied criteria that were used in previous studies (e.g. Kyhn et al., Reference Kyhn, Jensen, Beedholm, Tougaard, Hansen and Madsen2010) that estimated the apparent source levels (ASL; Møhl et al., Reference Møhl, Wahlberg, Madsen, Miller and Surlykke2000). On-axis clicks should be recorded on all four hydrophones, and represent the part of a scan that is defined as a series of clicks that are closely spaced in time, normally first increasing and then decreasing in amplitude (Figure 2, sensu Møhl et al., Reference Møhl, Wahlberg, Madsen, Heerfordt and Lund2003). In addition, the maximum amplitude in the scan must be determined, with the maximum amplitude on one of the two middle hydrophones being documented. Furthermore, the direct path of the click must be stronger than any trailing bottom or surface reflections.
The range to the sound source (animal) from the array was calculated using the bearing angles of the sound source from the two A-tags (θ 1 and θ 2) and a trigonometric function (Figure 1). Errors in measurement of the bearing angle are caused by two factors: sampling resolution of the sound arrival time difference between hydrophones and the ambiguity of triggering timing in a click. The sampling resolution of triggering time of both hydrophones was 271 ns. Sounds travel 0.4 mm in 271 ns, while the separation between the two hydrophones was 189 mm. Thus, the approximately 0.2° error can be caused by a sampling delay in the A-tag. In contrast, the ambiguity of triggering could happen in different sound waves in a click, which is the duration of one oscillation of sound pressure, nearly 10 µs at 120 kHz (Li et al., Reference Li, Wang, Wang, Hoffmann-Kuhnt, Fernando, Taylor, Lin, Chen and Ng2013). This ambiguity is equal to 37 times the size of the sampling errors. In the case that the A-tag triggered a second sound wave peak, the errors were relatively easily identified (Figure 2). We have used only the data having adequate accuracy in the bearing angle to localize the sound source.
The ASL was calculated using the received level and transmission loss, whereby (Figure 1):
 $$\eqalign{\hbox{ASL} &= \hbox{Received Level} + \hbox{Transmission Loss}\, \cr & \quad\hskip3pt 20\log_{10} \lpar \hbox{Range}\rpar + \alpha \lpar {\rm Range}\rpar \;}$$
where α is the absorption coefficient. A spherical transmission loss model was assumed (DeRuiter et al., Reference DeRuiter, Hansen, Koopman, Westgate, Tyack and Madsen2010). In our study area, the water temperature was approximately 23°C and the salinity was 30–32 psu; therefore, we used 31‰ salinity. The Leroy equation (Urick, Reference Urick1983) was used to calculate sound speed and absorption under these conditions, which were 1525 m s−1 and 0.035 dB m−1 at 108 kHz, respectively. The ASL was not calculated when the received level exceeded 158.8 dB re 1 µPa, because the received level might be clipped.
RESULTS
Recordings were obtained for more than seven groups of humpback dolphins, which contained 2–10 individuals. The dolphins seemed to be interested in the deployed array, as they swam back and forth around the equipment, which helped with the extraction of on-axis candidates. During recording, the only observed cetacean species was the humpback dolphin.
The estimated range had larger errors with increases in the distances, especially over 50–60 m (Figure 3). Kyhn et al. (Reference Kyhn, Jensen, Beedholm, Tougaard, Hansen and Madsen2010) also reported root mean square errors on source levels of less than 3 dB out to 65 m from their six-element hydrophone array. Hence, only click trains that had a calculated distance of <60 m were employed to estimate ASL.
Localization performance of two A-tags array. The actual range was estimated from the array to the passing ship using the laser range finder (N = 46).
Using the automated filter, 500 and 501 click trains were qualified as the candidate data collected from the upper and lower A-tags on 20 December and 467 and 545 on the following day, respectively. Eighty-eight and 85 click trains were collected on 20 and 21 December, respectively, which met the criteria as on-axis click trains that were estimated to be produced within 60 m. On-axis sounds were detected more frequently by the lower A-tag than the upper A-tag on both days (71.6% and 88.6%, binomial test, P < 0.01).
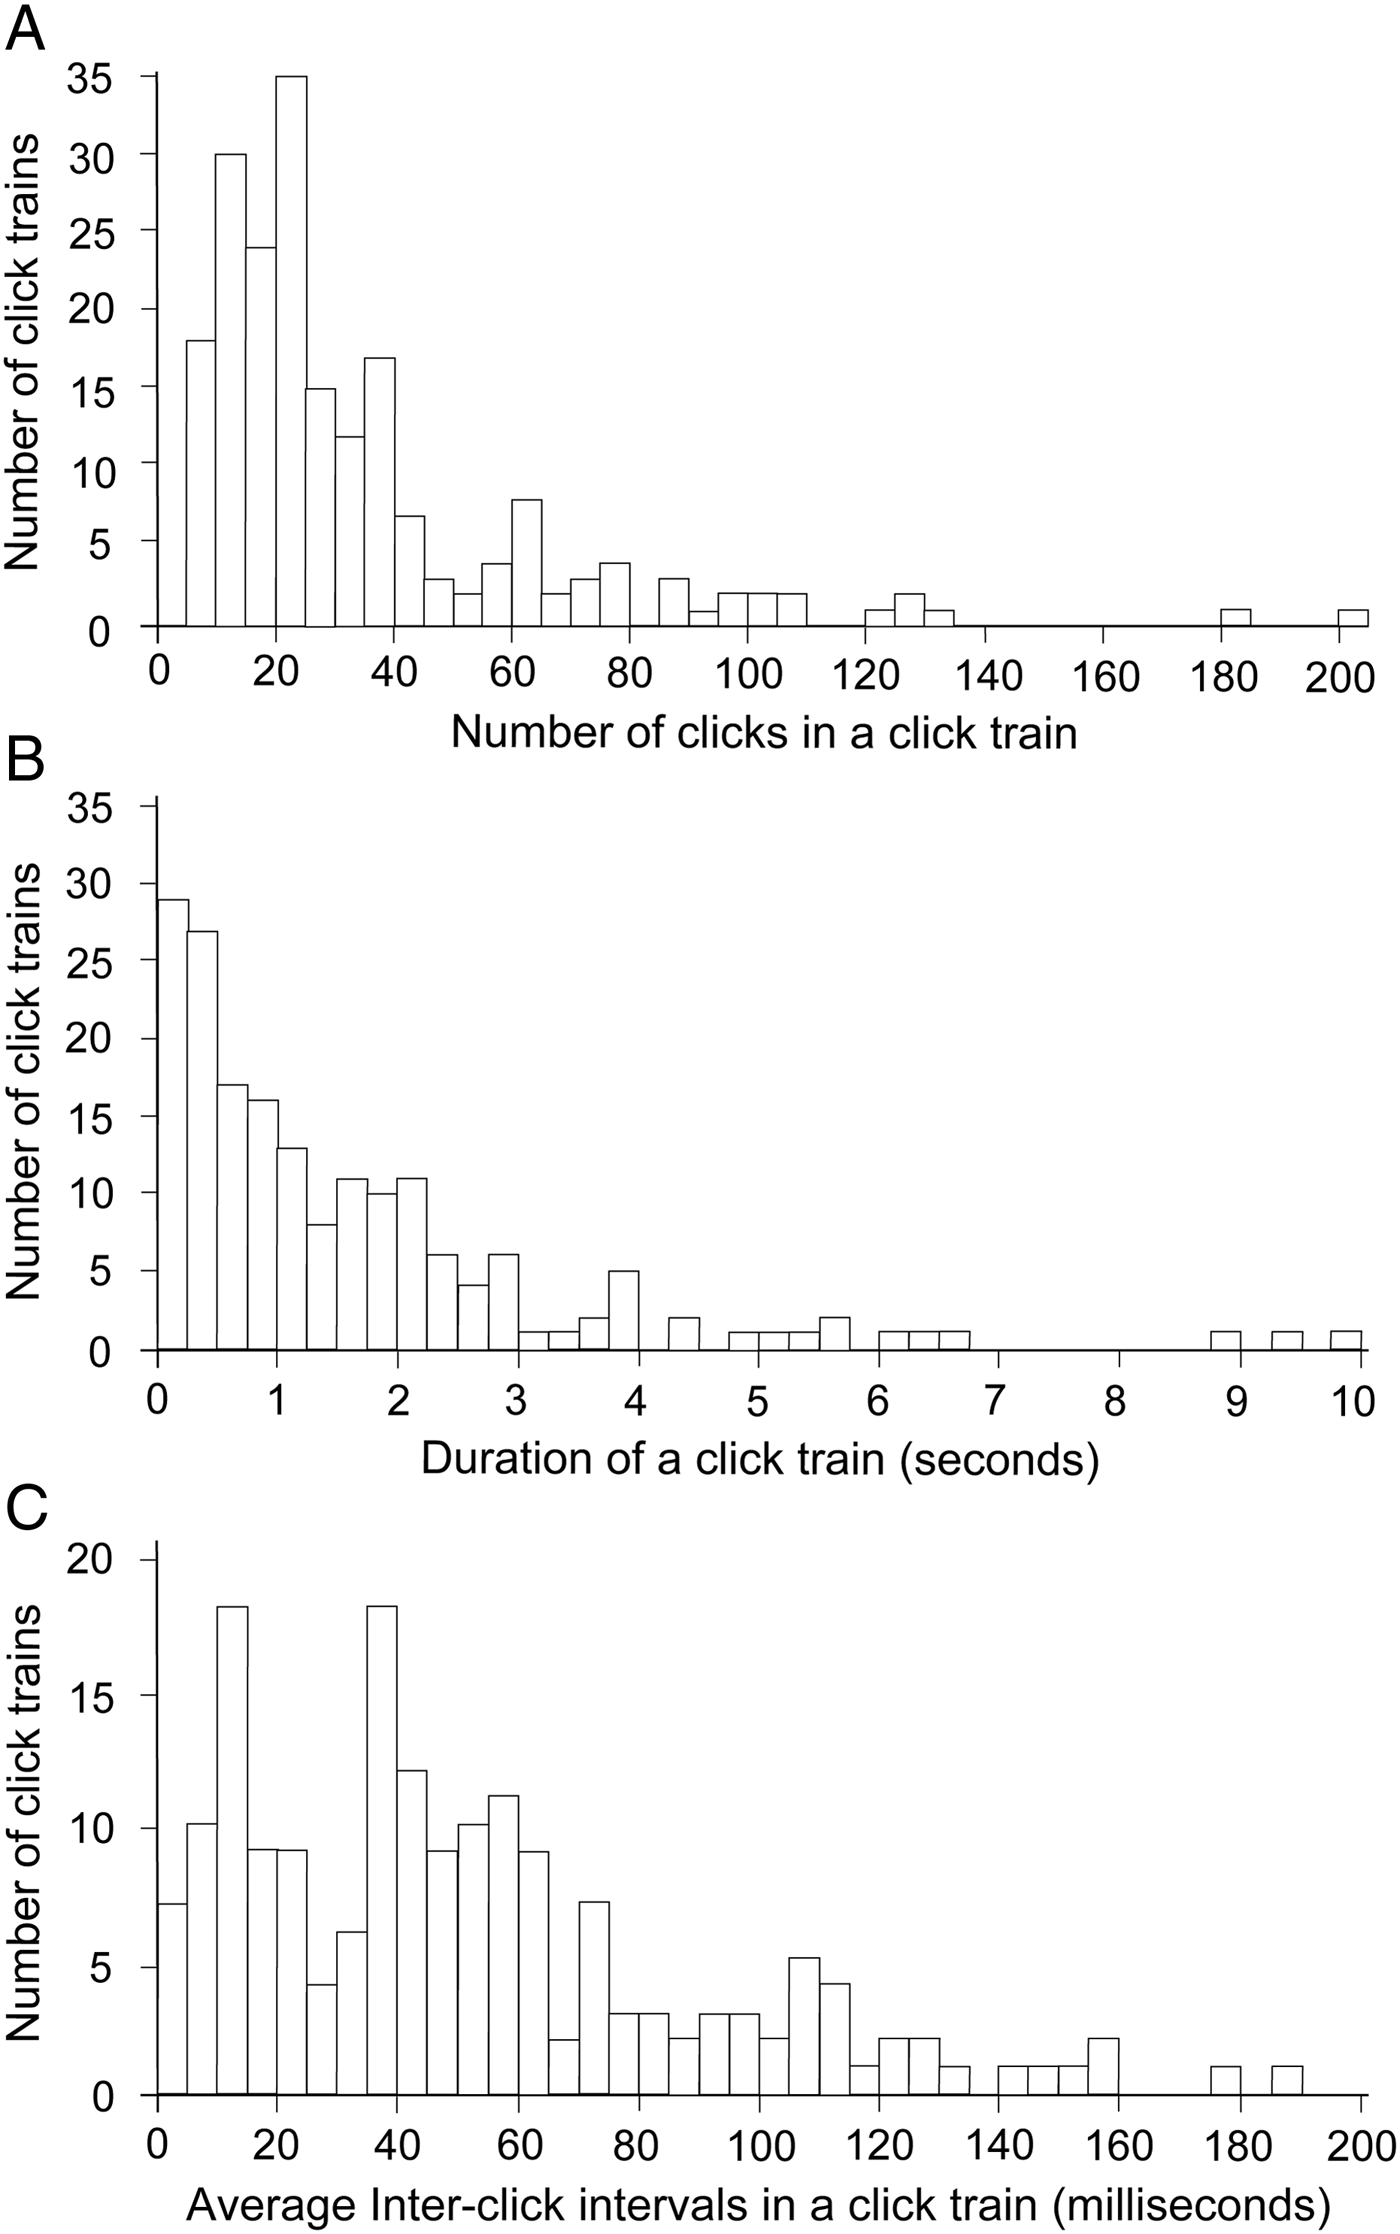
The click trains contained 36.3 ±32.5 (6–201) clicks, and lasted for 1.5 ±1.5 s (average ± standard deviation (SD); Figure 4A, B). The average and SD of the ICI in a click train ranged from 1.90 to 185.29 and from 0.2 to 50.1, respectively (average 51.2 ±38.3, 10.7 ±9.3; Figure 4C). The average ICI showed a bimodal distribution before and after 20 ms (Figure 4C). Hereafter, a click train with an average ICI <20 ms (N = 44, representing 25% of all sounds detected) is defined as a short-range click train, which follows the process of defining short-range sonar used in a previous study (Akamatsu et al. Reference Akamatsu, Wang, Wang, Li and Dong2010). Although the number of clicks and range to the array between regular and short-range click trains showed no significant differences (Wilcoxon's signed-rank test, P = 0.86 and 0.33), the click train duration was significantly shorter in short-range click trains (average 0.4 s) compared to regular click trains (average: 1.9 s; Wilcoxon's signed-rank test, P < 0.01). The standard deviation and coefficient of variation of the ICI in a click train were much smaller during short-range click trains (average 1.5 and 0.15, respectively) compared to regular click trains (average 13.8 and 0.22, respectively; Wilcoxon's signed-rank test, P < 0.01).
Characteristics of a click train. 95% of the click trains consisted of less than 60 clicks, and lasted less than 4 s (N = 173). The average ICI was 51.2 (±38.3 standard deviation) ms, with 87% being less than 100 ms.
The average ICI was not correlated with the range from the animal to the array; specifically, 72.6% of the click trains had ICI values that were longer than the two-way travel time. When click trains contained more than eight pulses, the ICIs in the first and last five clicks were compared with the average ICI. In cases when the ICI in the first part of the train was smaller than the average click train ICI, the duration and average ICI were significantly smaller compared to other click trains (Wilcoxon's signed-rank test, P < 0.01 and 0.05). However, the number of clicks in a train was not smaller if the first five clicks had ICIs that were below average (Wilcoxon's signed-rank test, P = 0.87).
The received click level was 157.4 ±2.0 dB re 1 µPa on average, ranging from 150.6 to 159.0 dB re 1 µPa (N = 173). To eliminate nearly clipped sounds, we excluded 52 click trains that exceeded 158.8 dB re 1 µPa in the remaining 121 click trains to estimate ASL. The back-calculated ASL had an average 181.7 ±7.0 dB re 1 µPa at 1.6–57.2 m from the array (N = 121, Figure 5). In comparison, the back-calculated ASL within 60 m of the array was dependent on the range between the animal producing sound and the hydrophone, as follows: 22.6 × log10 (range estimated from the array) +154.4 (P < 0.01; Figure 5). The ASLs for regular and short-range click train values were 182.8 ±5.4 (164.7–195.8) and 179.6 ±8.9 (156.8–192.9) dB re 1 µPa, respectively. For short-range sounds only, a smaller ASL was calculated (22.9 × log10 (range estimated from the array) + 152.5 dB re 1 µPa (N = 43, P < 0.01)) compared to during regular click trains (21.8 × log10 (range estimated to the array) +156.3 dB re 1 µPa (N = 78, P < 0.01)). This result demonstrates that the ASL of short-range click trains was 1.9–3.8 dB lower compared to regular sounds emitted within a range of 60 m.
Received level (left) and apparent source level (right) dB re 1 μPa apparent source level (ASL) of regular (N = 78) and buzz (N = 43) click trains. The dashed line in the left panel was maximum level that A-tag recorded, 159.4 dB re 1 μPa. The click trains having more than 158.8 dB re 1 μPa of the received level were excluded for the analysis due to the possibility to be clipped. The ASL of a regular click train (square) was 21.8 × log10 (range estimated from the array) + 156.3 dB re 1 μPa (N = 131, P < 0.01) and the ASL of a buzz click train (circle) followed 22.9 × log10 (range estimated from the array) + 152.5 dB re 1 μPa (P < 0.01).
DISCUSSION
The ASL of the click trains (181.7 dB re l µPa peak–peak on average) that was estimated in this study is considered to be a reasonable value for humpback dolphins with a maximum body size of 2.5 m (Jefferson et al., Reference Jefferson, Hung, Robertson and Archer2012). Source level (SL) is known to be influenced by body size and/or the size of the sound production organ, as previously reported for birds (Brumm Reference Brumm2004) and fish (Connaughton et al., Reference Connaughton, Taylor and Fine2000), and has been discussed for toothed whales (Kyhn et al., Reference Kyhn, Jensen, Beedholm, Tougaard, Hansen and Madsen2010, Morisaka et al., Reference Morisaka, Karczmarsk, Akamatsu, Sakai and Thornton2011, Wahlberg et al., Reference Wahlberg, Jensen, Aguilar Soto, Beedholm, Bejder, Oliveira, Rasmussen, Simon, Villadsgaard and Madsen2011). Toothed whales of maximum 1.5–1.8 m body length, which are smaller than S. chinensis, produce sounds of approximately 175 dB re 1 µPa on average when within 60 m of the array. Such species include Hector's dolphin Cephalorhynchus hectori (Van Parijs & Corkeron Reference Van Parijs and Corkeron2001; Khyn et al., 2009), Commerson's dolphin Cephalorhynchus commersonii (Van Parijs & Corkeron Reference Van Parijs and Corkeron2001; Khyn et al., 2010), freshwater Yangtze finless porpoise Neophochaena phocaenoides asiaeorientaris (Li et al., Reference Li, Wang, Wang and Akamatsu2006) and Heaviside's dolphin Cephalorhynchus heavisidii (Morisaka et al., Reference Morisaka, Karczmarsk, Akamatsu, Sakai and Thornton2011). The ASL is greater in larger animals, such as Risso's dolphin Grampus griseus (max. 4 m body length, average 220 dB re 1 µPa pp; Madsen et al., Reference Madsen, Kerr and Payne2004), bottlenose Tursiops truncatus and Indo-Pacific bottlenose dolphins T. aduncus (maximum 3 or 4 m body length, average 199 and 205 dB re l µPa pp; Wahlberg et al., Reference Wahlberg, Jensen, Aguilar Soto, Beedholm, Bejder, Oliveira, Rasmussen, Simon, Villadsgaard and Madsen2011) and white-beaked dolphin Lagenorhynchus albirostris (maximum 3 m body length, average 219 dB re l µPa pp; Rasmussen & Miller Reference Rasmussen and Miller2002).
Most of the average click train ICIs were larger than the two-way travel time, which is consistent with the findings of previous studies (e.g. Jensen et al., Reference Jensen, Bejder, Wahlberg and Madsen2009). In addition, DeRuiter et al. (Reference DeRuiter, Bahr, Blanchet, Hansen, Kristensen, Madsen, Tyack and Wahlberg2009) demonstrated that range-/time-varying output adjustments of tagged harbour porpoises are not mechanically hardwired to the target range through an ICI to two-way travel time adjustment. In the current study, the definition used for short-range sonar (i.e. less than 20 ms) was determined from the bimodal distribution of the average ICI in a click train, and might be slightly broader compared to that used in previous studies (Akamatsu et al., Reference Akamatsu, Wang, Wang, Li and Dong2010; Wisniewska et al., Reference Wisniewska, Johnson, Beedholm, Wahlberg and Madsen2012). However, the results indicate that a combination of the ICI (i.e. clicking rate), a relatively stable ICI and shorter click train duration (but not the number of clicks) was useful for identifying the short-range click train.
Amplitude increases with increasing target range; this correlation followed a 20 log to compensate for one-way propagation loss in the current study (Figure 5), which might be partly because we compensated transmission loss in a 20 log fashion. To fully compensate for propagation loss during point target recognition, the sound should return to the dolphin that produced the clicks. If a dolphin produces a SL according to the range in a 40 log manner, the received level should be constant. However, the nearly 20 log regression, as also reported for other species (e.g. Au & Benoit-Bird, Reference Au and Benoit-Bird2003), indicates that compensation for transmission loss in small odontocetes might just simply be one way of keeping the projected sound pressure level on the target constant.
Estimates of ASL when animals are focusing on longer range targets require validation in future studies. The ASL of Yangtze finless porpoises, which was estimated at distances between 3.8 and 47.5 m, is 163.7–185.6 dB re 1 µPa (Li et al., Reference Li, Wang, Wang and Akamatsu2006), whereas a value of 180–209 dB re 1 µPa pp was estimated at distances between 25 and 173 m (Li et al., Reference Li, Akamatsu, Wang and Wang2009). The regression function (19.37 log × (Range) + 151.59 dB re 1 µPa) (Li et al., Reference Li, Wang, Wang and Akamatsu2006) also seems to fit the ASL that was estimated in Li et al. (Reference Li, Akamatsu, Wang and Wang2009). In this study, the ASL values were estimated within a 60 m range because error increases with distance, especially more than 60 m (Kyhn et al., Reference Kyhn, Jensen, Beedholm, Tougaard, Hansen and Madsen2010). The ASL of Indo-Pacific humpback dolphin might exceed 205 dB re 1 µPa pp at the distance of more than 60 m, based on the regression.
The short-range click trains that were 1.9–3.8 dB lower in SL compared to regular sounds might represent a type of buzz sound with a higher repetition rate, i.e. shorter ICI and lower SL (e.g. DeRuiter et al., Reference DeRuiter, Bahr, Blanchet, Hansen, Kristensen, Madsen, Tyack and Wahlberg2009; Verfuss et al., Reference Verfuss, Schnitzler and Miller2009; Wisniewska et al., Reference Wisniewska, Johnson, Beedholm, Wahlberg and Madsen2012). The humpback dolphins produced the short-range sound at a distance of up to 57 m. In addition, sounds that started with a smaller ICI tended to end after a shorter duration, and have a smaller average ICI.
Our estimation of ASLs might be underestimated, due to two technical limitations. First, sounds produced by the dolphins might be broadband; therefore, the peak or central frequency might be lower than 55 kHz. However, Li et al. (Reference Li, Wang, Wang, Taylor, Cros, Shi, Wang, Fang, Chen and Kong2012) reported that the peak frequency of echolocation sound is higher than 100 kHz, which is the central frequency of the A-tag (–3 dB range: 55–235 kHz). Second, ASL estimates might be slightly larger if sounds are recorded over 159.4 dB re 1 µPa. If click trains of 158.8–159.0 dB re 1 µPa of the received levels were included, the estimated ASL in the current study would be 1 dB greater at 60 m from the array.
The automated detection filter helped us to detect typical click trains, which would be on-axis. The vocalizations from several dozen individual humpback dolphins were probably recorded in the current study; however, it is not possible to verify this estimate, because individual identification from echolocation click trains has not been conducted to date. Biologging studies of other dolphins or porpoises have shown large differences among individuals in the production of signals and behaviour (Kimura et al., Reference Kimura, Akamatsu, Wang, Li, Wang and Yoda2013; Rasmussen et al., Reference Rasmussen, Akamatsu, Teilmann, Vikingsson and Miller2013). Furthermore, the ecology and acoustic behaviour of humpback dolphin individuals might differ across regions, because they have patchy distributions (Jefferson & Hung, Reference Jefferson and Hung2004) and strong site fidelity (Xu et al., Reference Xu, Zhang, Ma, Li, Yang and Zhou2012), even in Chinese waters. Some reports have shown spatial differences in the acoustic features of small odontocetes, such as SL (e.g. Villadsgaard et al., Reference Villadsgaard, Wahlberg and Tougaard2007; Wahlberg et al., Reference Wahlberg, Jensen, Aguilar Soto, Beedholm, Bejder, Oliveira, Rasmussen, Simon, Villadsgaard and Madsen2011) and sound production rates (Jones & Sayigh, Reference Jones and Sayigh2002). Villadsgaard et al. (Reference Villadsgaard, Wahlberg and Tougaard2007) suggested that SL biases from recording locations might be caused by observed differences in background noise and the behaviour of dolphins. In the current study, our recordings were of free-ranging wild animals in one of the less environmentally polluted areas within the humpback dolphin's species range in China (Chen et al., Reference Chen, Zheng, Yang, Xu and Zhou2009). Thus, we recommend that the echolocation sonar of this species should be recorded and examined in other areas.
ACKNOWLEDGEMENTS
The authors acknowledge Dagong Qin, Jiaming Rong, Changxi Shi and Haiping Wu for fieldwork assistance, Tsunemi Suzuki who helped with array calibration, Yasutoki Shibata and Martina Muller who provided constructive comments to improve the manuscript. We also thank Magnus Wahlberg, Jakob Tougaard and Line A. Kyhn for trial of recording and analytical advices.
FINANCIAL SUPPORT
This work was funded by the National Natural Science Foundation of China (31070347, 31170501), Ministry of Science and Technology of China (2011BAG07B05-3), State Oceanic Administration of China (201105011-3), a JSPS Research Fellowship for Young Scientists (24-3578) and CREST—Japan Science and Technology Agency.