I. INTRODUCTION
In past decades, thermoelectric (TE) materials have received rejuvenated interest due to their promising applications in direct thermal to electric energy conversion and solid-state refrigeration. The performance of a TE material is represented by the dimensionless figure of merit ZT = α2σT/κ, where α is the Seebeck coefficient, σ is the electrical conductivity, κ is the thermal conductivity mainly including the electron contribution κ e and the lattice contribution κ L, and T is the absolute temperature.Reference Snyder and Toberer1, Reference Pei, LaLonde, Iwanaga and Snyder2
The half-Heusler compounds with valence electron count 18 have been extensively studied as potential TE materials for high temperature power generation up to 1100 K.Reference Zhu, Xiao, Yu, Shen, Yang, Zhou, Zhao and He3–Reference Hohl, Ramirez, Goldmann, Ernst, Woelfing and Bucher5 The n-type MNiSn-based (M = Zr, Hf, Ti) compounds have best TE performance among all known half-Heusler compounds at present. They crystallize in the cubic MgAgAs-type structure featured by four interpenetrating face-centered-cubic sublattices but one vacant.Reference Hohl, Ramirez, Goldmann, Ernst, Woelfing and Bucher5 The MNiSn compounds are narrow band gap semiconductors with an indirect band gap of the order of 0.2–0.5 eV.Reference Ogut and Robe6 The combination of high Seebeck coefficient (∼200 μV/K at room temperature) and moderate electrical conductivity (∼104 Ω−1/m at room temperature) in the MNiSn-based half-Heusler alloys has resulted in a high TE power factor.Reference Chaput, Tobola, Pécheur and Scherrer7 However, the high thermal conductivity [∼10 W/(m K)] limits the system for TE applications.Reference Uher, Yang, Hu, Morelli and Meisner4 Several methods for reducing the lattice thermal conductivity by increasing phonon scattering via point defects or grain boundary scattering have been investigated.Reference Hohl, Ramirez, Goldmann, Ernst, Woelfing and Bucher5, Reference Bhattacharya, Tritt, Xia, Ponnambalam, Poon and Thadhani8–Reference Culp, Poon, Hickman, Tritt and Blumm12 Shen et al.Reference Shen, Chen, Goto, Hirai, Yang, Meisner and Uher11 reported a low thermal conductivity of 2 W/(m K), which was obtained by 50% Pd substitution on the Ni site for the ZrNiSn-based half-Heusler alloys, and the ZT reached 0.7 at 800 K for n-type Zr0.5Hf0.5Ni1−xPdxSn0.99Sb0.01. Later, a ZT value of 0.81 at 1025 K has been achieved by Culp et al.Reference Culp, Poon, Hickman, Tritt and Blumm12 in the Hf0.75Zr0.25NiSn0.975Sb0.025 compound, which meets or exceeds that of industry SiGe alloys. Sharp et al.Reference Sharp, Poon and Goldsmid10 theorized that properly decreasing grain size below 10 μm in ZrNiSn-based half-Heusler alloys could reduce the lattice thermal conductivity by enhanced boundary scattering while maintaining the high electron mobility because the mean free path of phonons is larger than that of electrons in the alloys. This assertion has been experimentally confirmed by Bhattacharya et al. Reference Bhattacharya, Tritt, Xia, Ponnambalam, Poon and Thadhani8, Reference Bhattacharya, Skove, Russell, Tritt, Xia, Ponnambalam, Poon and Thadhani9
Generally, a long annealing duration of 7–10 days is necessary for obtaining single phased half-Heusler alloys because of the large difference in the melting points and the specific weight of the constituent elements.Reference Shen, Chen, Goto, Hirai, Yang, Meisner and Uher11, Reference Culp, Poon, Hickman, Tritt and Blumm12 In our previous study, the rapid fabrication of the single phased ZrNiSn-based half-Heusler alloys with homogenous compositions have been realized by levitation melting and spark plasma sintering (SPS), and the improved TE figure of merit ZT ∼ 1.0 has been obtained.Reference Yu, Zhu, Shi, Zhang, Zhao and He13 To further reduce the thermal conductivity, in this work, the samples with refined grain size were prepared to enhance the phonon scattering. Melt spinning is known as an efficient way for grain refinements and thermal conductivity reduction.Reference Zhu, Zhao and Hu14–Reference Yu, Zhu, Xiao, Shen and Zhao17 In this article, a systematic study was conducted on the melt-spun (MS) ZrNiSn-based (with or without Sb doping) samples with submicron grain size. For comparison, the levitation melted (LM) coarse-grained samples were also prepared.Reference Yu, Zhu, Shi, Zhang, Zhao and He13 The structure, chemical compositions, carrier concentration, and low and high temperature TE properties of LM and MS samples have been investigated to understand the effect of grain size on TE properties of half-Heusler alloys.
II. EXPERIMENT
The ingots of HfxZr1−xNiSn (x = 0, 0.25, 0.5, 0.75, 1), HfxZr1−xNiSn0.98Sb0.02 (x = 0, 0.25, 0.4, 0.5, 0.6), and Hf0.5Zr0.5NiSn1−ySby (y = 0, 0.05, 0.01) were prepared by levitation melting of elemental Zr (pieces, 99.99%), Hf (pieces, 99.99%), Ni (block, 99.999%), Sn (particles, 99.999%), and Sb (block, 99.999%). More details can be found elsewhere.Reference Yu, Zhu, Shi, Zhang, Zhao and He13 Part of the ingot was charged into a quartz ampoule with a nozzle of 1.0 mm diameter for melt spinning in argon. The ingots were inductively remelted and injected onto the edge of a rotating copper roller with a linear speed of 45 m/s. The as-obtained ribbons have two surfaces, one is the copper touch surface and the other is the free surface. The MS thin ribbons and the remained LM ingots were respectively pulverized and sintered by SPS (SPS-1050; Sumitomo Coal Mining Co., Tokyo, Japan) at 1103 K for 15 min less than 65 MPa in vacuum. The densities of all the samples are ∼95% of theoretical one.
Phase structure and compositions were analyzed by powder x-ray diffraction (XRD) on a Rigaku D/MAX-2550PC diffractometer (Rigaku, Tokyo, Japan) using a CuKα radiation (λ = 1.5406 Å) and electron probe microanalysis (EPMA; JXA-8100) with wave length dispersive spectrometer, respectively. The microstructures of the rapidly solidified thin ribbons and the sintered samples were observed on a Hitachi S-4800 field emission scanning electron microscope (Hitachi, Tokyo, Japan). Transmission electron microscopy (TEM) and high-resolution transmission electron microscopy (HRTEM) of the sintered sample were performed on a Philips-FEI TECNAI G2 F30 S-TWIN microscope (Philips, Eindhoven, Netherlands) operated at an accelerating voltage of 300 kV. TEM samples were prepared by grinding, dimpling, and ion milling (PIPS 691, Gatan, Pleasanton, CA). The electrical conductivity from 300 to 973 K was measured on a computer-aided electrical measurement system using a DC four-probe method.Reference Yu, Zhu, Yang, Shen and Zhao18 The thermal conductivity κ was calculated by κ = DρDC p, where ρD is the sample density estimated by an ordinary dimensional and weight measurement procedure. The thermal diffusivity D and specific heat C p from 300 to 973 K were measured by a laser flash method on a Netzsch LFA457 apparatus (Netzsch, Selb, Germany).Reference Vandersande, Zoltan and Wood19 The thermal conductivity, electrical conductivity, Seebeck coefficients, and specific heat C p were also measured from 6 to 300 K on a Quantum Design PPMS-9T system. The C p values at room temperature measured by Physical Property Measurement System (PPMS) and LFA457 are almost same for the same sample. The Hall coefficient R H at 300 K was also preformed on a Quantum Design PPMS-9T using a four-probe configuration, with the magnetic field sweeping between ±4.0 T. Then, the carrier concentration n was calculated using n = −(1/eR H).
III. RESULTS AND DISCUSSION
A. Structure and morphology
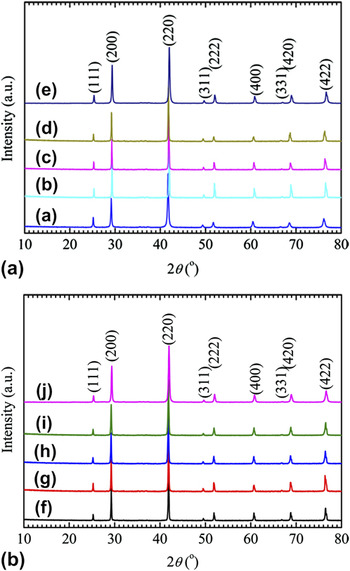
Figure 1 is the XRD patterns for the MS ZrNiSn-based half-Heusler alloys. All the samples without or with Sb doping could be well indexed to the cubic MgAgAs-type crystal structure. The MS samples showed the similar XRD patterns with the LM ones in Ref. Reference Yu, Zhu, Shi, Zhang, Zhao and He13, indicating that no phase separations occurred during the melt spinning process. For the ternary ZrNiSn, the XRD refinement lattice parameter is 6.114(6) nm, which is consistent with the data in Ref. Reference Hohl, Ramirez, Goldmann, Ernst, Woelfing and Bucher5.
Powder XRD patterns for MS ZrNiSn-based alloys without Sb doping (A) and with Sb doping (B). The sample compositions shown in the XRD are as follow: (a) ZrNiSn, (b) Hf0.25Zr0.75NiSn, (c) Hf0.5Zr0.5NiSn, (d) Hf0.75Zr0.25NiSn, (e) HfNiSn, (f) Hf0.5Zr0.5NiSn0.995Sb0.005, (g) Hf0.5Zr0.5NiSn0.99Sb0.01, (h) Hf0.4Zr0.6NiSn0.98Sb0.02, (i) Hf0.5Zr0.5NiSn0.98Sb0.02, and (j) Hf0.4Zr0.6NiSn0.98Sb0.02.

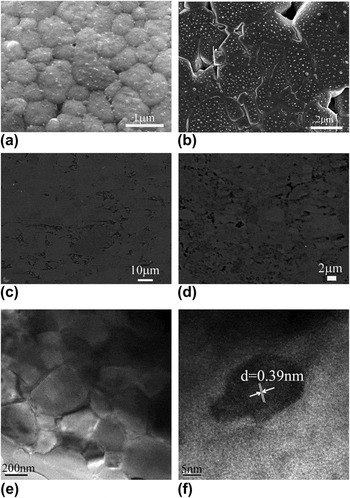
Figure 2 shows the SEM images of the MS Hf0.6Zr0.4NiSn0.98Sb0.02 thin ribbons, and backscattered electron image and TEM images of the bulk Hf0.6Zr0.4NiSn0.98Sb0.02 samples sintered by SPS. Figures 2(a) and 2(b) are secondary electron images of the copper touch surfaces and the free surfaces of the MS thin ribbons, respectively. As can be seen, the grain sizes of the copper touch surfaces are hundreds of nanometers, while the average grain sizes of the free surfaces are ∼3 μm. Nanoscale precipitates could be easily found on many MS thin ribbons and the sizes of the nanophases are only several tens of nanometers for the Hf0.6Zr0.4NiSn0.98Sb0.02 ribbon. Figures 2(c) and 2(d) are the backscattered electron images for sintered LM and MS Hf0.6Zr0.4NiSn0.98Sb0.02 samples. The grain sizes of the LM sample are tens of micrometers, as shown in Fig. 2(c). Small contrast differences between grains due to the different orientations can be observed in Figs. 2(c) and 2(d), and EPMA compositions are almost the same for the black and white grains. Figures 2(e) and 2(f) show the TEM and HRTEM images of the sintered bulk MS Hf0.6Zr0.4NiSn0.98Sb0.02 sample. As shown in the Fig. 2(e), the grains of a few hundreds of nanometers can be easily found, indicating that there is no significant grain growth during the sintering process due to the short sintering duration of SPS. Nanoscale phases can also be observed inside many grains. Figure 2(f) is the typical HRTEM images showing the nanoscale phases embedded in the matrix of a grain. The size of the nanoscale phase is about 20 nm. The measured interplanar distance of 0.39 nm could not be indexed to any crystal planes of the half-Heusler phase, implying that the nanophases have different compositions or structures from the matrix. The carrier concentration measurement indicates that the nanoscale precipitate is possibly metal-like conductive, as discussed below. The similar nanostructures have also been found in the sintered MS HfNiSn samples by TEM. However, we did not observe such a microstructure in LM samples.
SEM images of (a) the copper touch surface and (b) the free surface of the thin ribbons of Hf0.6Zr0.4NiSn0.98Sb0.02, backscattered electron images of (c) LM and (d) MS Hf0.6Zr0.4NiSn0.98Sb0.02 observed by EPMA, and (e) TEM and (f) HRTEM images of the spark plasma sintered Hf0.6Zr0.4NiSn0.98Sb0.02sample. The average grain size of the copper touch surface of the thin ribbons is ∼500 nm, and the average grain size of the free surface is ∼3 μm.

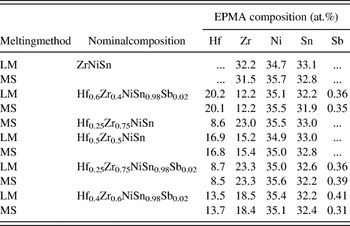
The real chemical compositions of the ZrNiSn-based half-Heusler alloys detected by EMPA are summarized in Table I. For all the samples, their EPMA chemical compositions are very close to the nominal compositions. And for the bulk MS and LM samples with the same nominal composition compacted by SPS, the EPMA compositions are also almost the same. Therefore, the influence of composition change can be ignored when one is comparing the TE properties of the MS samples to their LM counterparts in the discussion. It can also be noticed that for all the samples, the concentration ratio of (Hf + Zr):Ni:(Sn + Sb) ≈ 1:1.06:1, the Ni concentration is slightly higher than the stoichiometric composition of the half-Heusler phase. The similar result was also found in other work,Reference Kimura, Tanoguchi and Kita20, Reference Gofryk, Kaczorowski, Plackowski, Mucha, Leithe-Jasper, Schnelle and Grin21 which implies the possibility of excess Ni atoms occupying vacancy sites.Reference Kimura, Tanoguchi and Kita20
EPMA compositions of LM and MS half-Heusler ZrNiSn-based alloys. All the samples were compacted by SPS.

B. Thermal properties
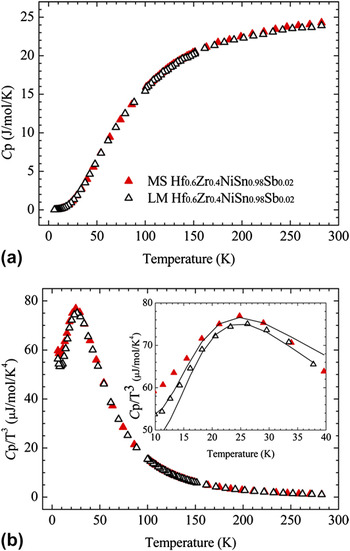
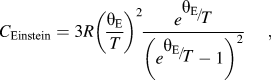
The measured low temperature specific heat C p for the LM and MS Hf0.6Zr0.4NiSn0.98Sb0.02 samples was shown in Figure 3. As shown in Fig. 3(a), the C p gradually increases below 300 K and reaches 23.9 J/(mol K) [0.22 J/(g K)] and 24.3 J/(mol K) [0.23 J/(g K)] at room temperature for the LM and MS Hf0.6Zr0.4NiSn0.98Sb0.02 samples, respectively. The two samples have very close C p, implying no significant difference in their real compositions because the C p is composition sensitive, which is also consistent with the EPMA results. On basis of the Debye theory of specific heat,Reference Kimura, Ueno and Mishima22 the low temperature isobaric specific heat C p is approximated by C p = γT + βT 3, where γ and β are the coefficients of the electronic and lattice specific heat, respectively. A hump around 25 K exists in the C p/T 3 versus T plot, as shown in Fig. 3(b), which features the Einstein oscillator. Hence, the low temperature C pcan be described by a Debye-like behavior on top of some Einstein modes:Reference He, Hitchcock, Bredeson, Hickman, Tritt and Zhang23
 $$C_{\rm{p}} = n_{\rm{D}} C_{{\rm{Debye}}} + n_{\rm{E}} C_{{\rm{Einstein}}} ,$$
 $$C_{{\rm{Debye}}} = {\rm{\gamma }}T + {\rm{\beta }}T^3 = {\rm{\gamma }}T + {{12{\rm{\pi }}^4 } \over 5}\left( {{R \over {{\rm{\theta }}_{\rm{D}}^3 }}} \right)T^3 ,$$
 $$C_{{\rm{Einstein}}} = 3R\left( {{{{\rm{\theta }}_{\rm{E}} } \over T}} \right)^2 {{e^{{\raise0.7ex\hbox{${{\rm{\theta }}_{\rm{E}} }$} \!\mathord{\left/ {\vphantom {{{\rm{\theta }}_{\rm{E}} } T}}\right.\kern-\nulldelimiterspace}\!\lower0.7ex\hbox{$T$}}} } \over {\left( {e^{{\raise0.7ex\hbox{${{\rm{\theta }}_{\rm{E}} }$} \!\mathord{\left/ {\vphantom {{{\rm{\theta }}_{\rm{E}} } T}}\right.\kern-\nulldelimiterspace}\!\lower0.7ex\hbox{$T$}}} - 1} \right)^2 }},$$
(a) Specific heat C p below room temperature and (b) Plot of C p/T 3 versus T reveals a hump feature centered at 25 K, which is well described by an Einstein oscillator mode with θE ∼ 123 K (solid line) for the LM and MS Hf0.6Zr0.4NiSn0.98Sb0.02samples.

where n D and n E are dimensionless Debye-type and Einstein-type vibration strengths, respectively; θE the Einstein temperature. Fitting the low temperature C p data to Eqs. (1)–(3) yielded the θ E and θ D values of MS and LM Hf0.6Zr0.4NiSn0.98Sb0.02 samples, as shown in Table II.
Coefficients of the electronic and lattice specific heat γ and β, dimensionless Debye-type vibration strengths n D, dimensionless Einstein-type vibration strengths n E, Debye temperature θD and Einstein temperature θE for MS and LM Hf0.6Zr0.4NiSn0.98Sb0.02samples.

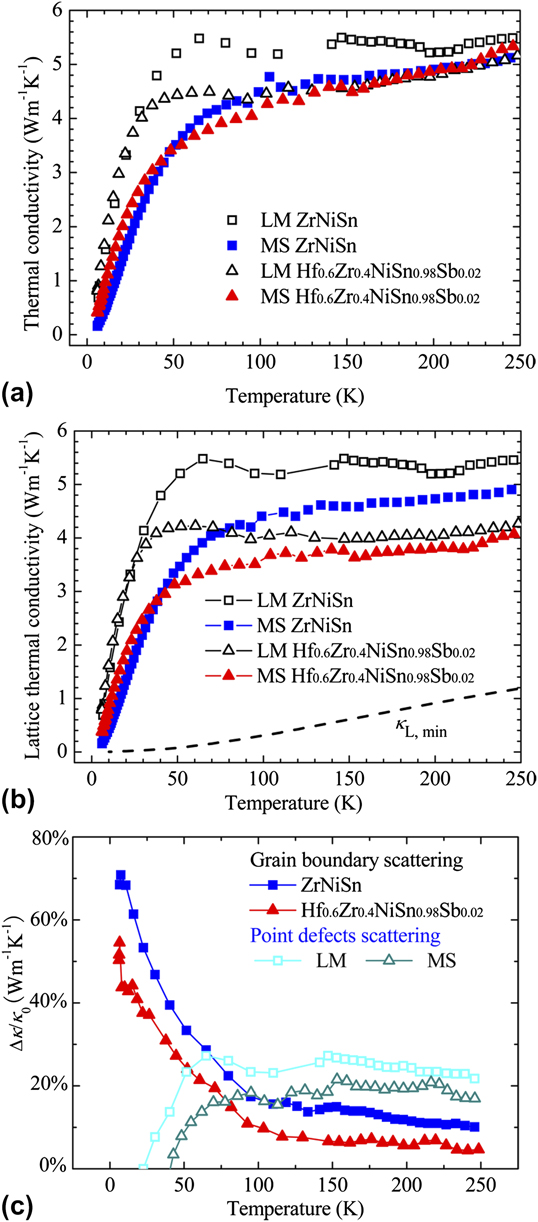
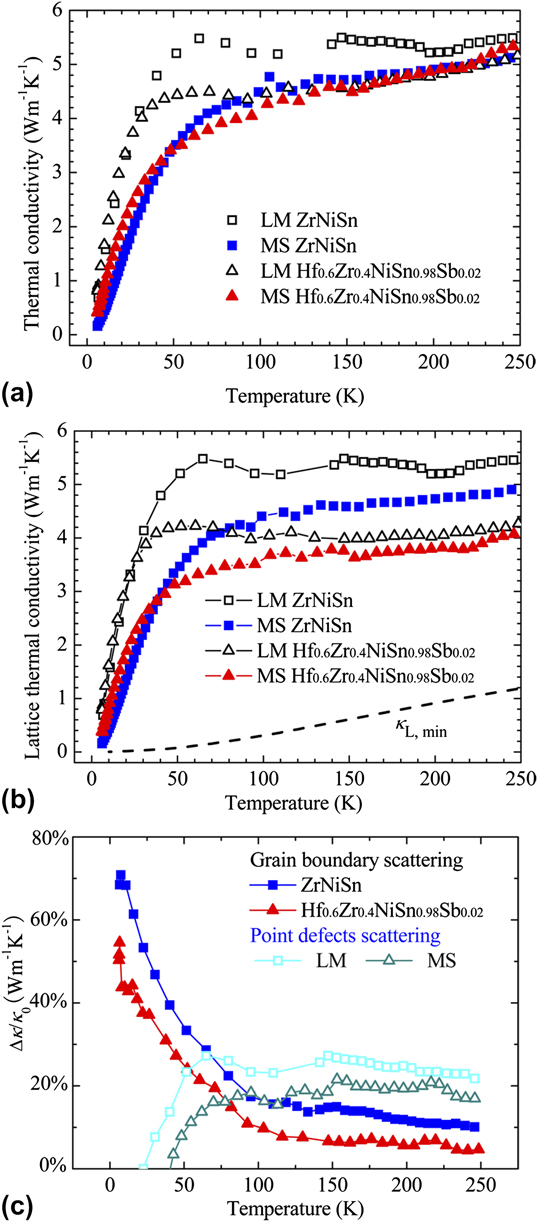
Figure 4 is the low temperature thermal conductivity κ for the LM and MS ZrNiSn and Hf0.6Zr0.4NiSn0.98Sb0.02 samples. The thermal conductivity still increase with temperature at temperatures higher than 200 K, which is because no heat radiation loss correction was made for the measurement by PPMS. The thermal conductivity is typically described as a sum of electron and lattice contributions: κ = κ e + κ L. The Wiedemann–Franz law κ e = L 0σT permits an estimation of the electronic component κ e in the total thermal conductivity. Determining exact values of κ e is nontrivial since the Lorenz number L 0 depends on majority and minority carrier concentrations as well as temperature. κ e is usually estimated using the Lorenz number of 2.0 × 10⁻⁸ W Ω/K2 for a degenerate semiconductor.Reference He, Hitchcock, Bredeson, Hickman, Tritt and Zhang23 The lattice thermal conductivity κ L is then derived by subtracting κ e from κ. As shown in Fig. 4(b), the lattice thermal conductivity for MS ZrNiSn and Hf0.6Zr0.4NiSn0.98Sb0.02samples decreased, compared to the LM counterparts, due to the refined grain size.
Low temperature (a) thermal conductivity κ, (b) lattice thermal conductivity κ L, and (c) lattice thermal conductivity reduction by grain boundary scattering and point defects scattering for LM and MS ZrNiSn and Hf0.6Zr0.4NiSn0.98Sb0.02samples.
For highly disordered materials, Cahill et al.Reference Cahill, Watson and Pohl24 proposed a phenomenological model of the minimum lattice thermal conductivity. It is a modified Einstein’s model of thermal conduction by including larger oscillating entities than the single atoms considered by Einstein. The minimum lattice thermal conductivity κ L, minthat stems from the random walk between these localized quanta mechanical oscillation modes is expressed as
 $$\kappa _{{\rm{L}},\,\min } = \left( {{{\rm{\pi }} \over 6}} \right)^{{\raise0.7ex\hbox{$1$} \!\mathord{\left/ {\vphantom {1 3}}\right.\kern-\nulldelimiterspace}\!\lower0.7ex\hbox{$3$}}} k_{\rm{B}} n^{{\raise0.7ex\hbox{$2$} \!\mathord{\left/ {\vphantom {2 3}}\right.\kern-\nulldelimiterspace}\!\lower0.7ex\hbox{$3$}}} \mathop\sum\limits_i {\upsilon _i \left( {{T \over {{\rm{\theta }}_i }}} \right)} ^2 \int_0^{{\raise0.7ex\hbox{${{\rm{\theta }}_i }$} \!\mathord{\left/ {\vphantom {{{\rm{\theta }}_i } T}}\right.\kern-\nulldelimiterspace}\!\lower0.7ex\hbox{$T$}}} {{{x^3 e^x } \over {(e^x - 1)^2 }}} dx,$$
where the sum is taken over the three polarizations, one longitudinal and two transverse modes with the sound velocity  $\upsilon _i $. And θi is the cutoff frequency for each polarization i expressed in the unit of Kelvin.
 $${\rm{\theta }}_i = \upsilon _i \left( {{\raise0.7ex\hbox{$\hbar $} \!\mathord{\left/ {\vphantom {\hbar {k_{\rm{B}} }}}\right.\kern-\nulldelimiterspace}\!\lower0.7ex\hbox{${k_{\rm{B}} }$}}} \right)(6{\rm{\pi }}^2 n)^{{\raise0.7ex\hbox{$1$} \!\mathord{\left/ {\vphantom {1 3}}\right.\kern-\nulldelimiterspace}\!\lower0.7ex\hbox{$3$}}} ,$$
where n is the theoretical density of atoms per unit volume. As given by Berret and Meissner, the relationship between the longitudinal sound velocity  $\upsilon _{\rm{l}} $ and transverse
 $\upsilon _{\rm{t}} $ is
 $\upsilon _{\rm{l}} $ = 1.65
 $\upsilon _{\rm{t}} $.Reference Berret and Meissner25 Combining with the data listed in Table II, it allows us to calculate κ L, min. As shown in Fig. 4(b), the κ L of these half-Heusler samples are much higher than the calculated κ L, min of a Hf0.6Zr0.4NiSn0.98Sb0.02material. The lattice thermal conductivity still has a great space to be decreased.
To clearly show the contribution of grain boundary scattering or point defects scattering to the decrease of lattice thermal conductivity, the decrease of lattice thermal conductivity due to grain boundary scattering was approximately estimated by:
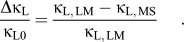 $${{\Delta \kappa _{\rm{L}} } \over {\kappa _{{\rm{L0}}} }} = {{\kappa _{{\rm{L, \,LM}}} - \kappa _{{\rm{L, \,MS}}} } \over {\kappa _{{\rm{L, \,LM}}} }}.$$
The Eq. (6) supposes that melt spinning mainly results in grain refinement with no significant change in point defects. The decrease of lattice thermal conductivity due to point defect scattering was roughly estimated by:
 $${{\Delta \kappa _{\rm{L}} } \over {\kappa _{{\rm{L0}}} }} = {{\kappa _{{\rm{L, \,ZrNiSn}}} - \kappa _{{\rm{L, \,Hf}}_{{\rm{0}}{\rm{.6}}} {\rm{Zr}}_{{\rm{0}}{\rm{.4}}} {\rm{NiSn}}_{{\rm{0}}{\rm{.98}}} {\rm{Sb}}_{{\rm{0}}{\rm{.02}}} } } \over {\kappa _{{\rm{L, \,ZrNiSn}}} }}.$$
As shown in Reference Uher, Yang, Hu, Morelli and MeisnerFig. 4(c), at temperatures lower than 50 K, grain boundary scattering is dominant. At temperatures above ∼100 K, point defects scattering is more important. This is consistent with the theorized prediction.Reference Yang, Morelli, Meisner, Chen, Dyck and Uher26 Grain boundary scattering is more effective at low temperatures to decrease the lattice thermal conductivity, and the lattice thermal conductivity decreased more than 20% below 100 K. The decrease of lattice thermal conductivity by boundary scattering is about 5–20% above 100 K, depending on the sample composition. Here, the effect of Sb doping is ignored because the doping content is small.
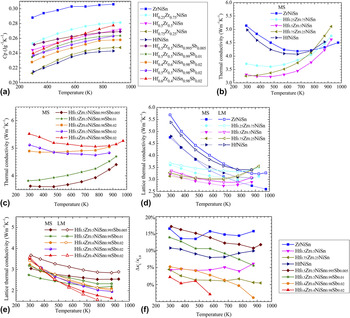
The thermal conductivity κ and the lattice thermal conductivity κ L above room temperature are shown in Fig. 5. The specific heat C p above room temperature measured by the laser flash method was used to calculate the thermal conductivity and is shown in Fig. 5(a). The room temperature C p value for Hf0.6Zr0.4NiSn0.98Sb0.02 [0.24 J/(g K)] is consistent with that measured by PPMS [0.23 J/(g K)]. The MS Hf0.5Zr0.5NiSn sample had the minimum room temperature thermal conductivity, as shown in Fig. 5(b), and had a great decrease compared with MS HfNiSn and ZrNiSn. The thermal conductivity goes together at high temperatures (above 900 K), where the point defect scattering is not effective. The thermal conductivity increases with Sb doping [as shown in Fig. 5(c)] due to the increase of the electronic thermal conductivity. The lattice thermal conductivity was calculated and shown in Figs. 5(d) and 5(e). The MS samples with refined grain size had lower thermal and lattice thermal conductivity than the LM counterparts. The decrease of lattice thermal conductivity by grain boundary scattering was also roughly calculated using Eq. (6) and the results are shown in Fig. 5(f). For most samples, the decrease of lattice thermal conductivity by grain boundary scattering is below 15%.
High temperature (a) specific heat C p for MS ZrNiSn-based samples, thermal conductivity κ for (b) MS ZrNiSn-based samples without Sb doping, and (c) for MS ZrNiSn-based samples with Sb doping. Lattice thermal conductivity κ L for (d) MS and LM samples without Sb doping, (e) MS and LM samples with Sb doping, and (f) lattice thermal conductivity reduction by grain boundary scattering calculated by Eq. (6).

C. Electrical properties and figure of merit
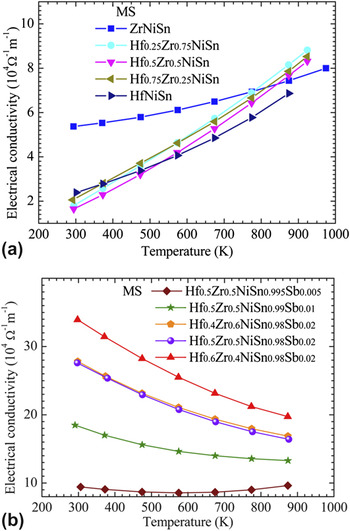
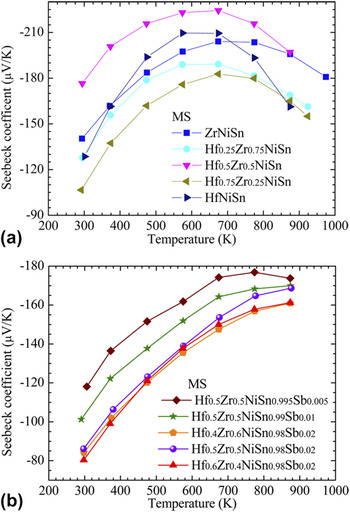
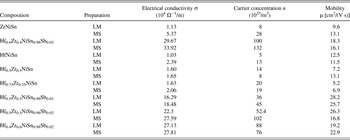
Figure 6 shows the electrical conductivity σ for the MS ZrNiSn-based samples. The electrical conductivity for both the LM and MS ZrNiSn-based samples without Sb doping increased with temperature, as shown in Fig. 6(a), showing a semiconductor behavior. This is consistent with the result in Ref. Reference Tang and Zhao27 but different from that in Ref. Reference Uher, Yang, Hu, Morelli and Meisner4. The ZrNiSn samples prepared by different methods have different electrical properties, which indicate that this material system is very sensitive to the preparation process due to the easily formed antisite defects and impurity phases.Reference Uher, Yang, Hu, Morelli and Meisner4 The electrical conductivity for the MS ZrNiSn-based samples with Sb doping decreased with temperature, as in Fig. 6 (b), showing a metal-like behavior. Compared with the LM counterparts, the MS samples usually have a higher electrical conductivity, as listed in Table III. The increase of the electrical conductivity for the MS samples is due to the increase of carrier concentration. Because the MS and LM samples had very close compositions detected by the EPMA, as listed in Table I, the composition effect can be excluded. There are two other possible reasons for the increase in carrier concentration: increase of the antisite defects ratio for the MS samplesReference Qiu, Yang, Huang, Chen and Chen28 or incorporation of nanosize metallic particles (as shown in Fig. 2) by melt spinning that can act as an electron donor and increase the electrical conductivity.Reference Kim, Zide, Gossard, Klenov, Stemmer, Shakouri and Majumdar29 Corresponding to the increase of carrier concentration, the Seebeck coefficient decreased for the MS samples. The change in the Seebeck coefficient α showed in Fig. 7 is in good conjunction with that of the electrical conductivity and carrier concentration (as shown in Table III). The band structures of ZrNiSn-based alloys have been calculated by many groups.Reference Chaput, Tobola, Pécheur and Scherrer7, Reference Kawaharada, Uneda, Muta, Kurosaki and Yamanaka30 Undoped ZrNiSn alloy is a semiconductor with Fermi level in the band gap. With Sb doping, the Fermi level moves into the conduction band, which made the samples to exhibit metal-like conduction.
High temperature electrical conductivity σ for MS ZrNiSn-based half-Heusler alloys (a) without Sb doping and (b) with Sb doping.

High temperature Seebeck coefficients α for MS ZrNiSn-based samples (a) without Sb doping and (b) with Sb doping.

Room temperature electrical conductivity σ, carrier concentration n, and carrier mobility μ for MS and LM ZrNiSn-based half-Heusler alloys.

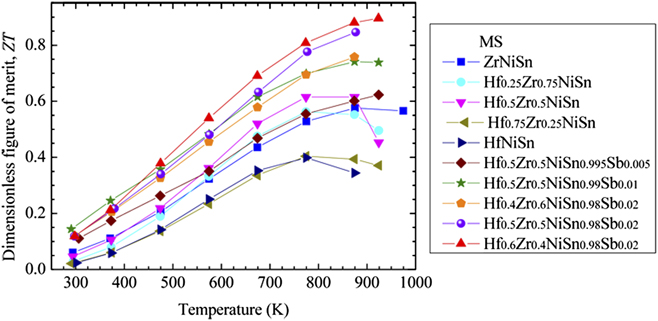
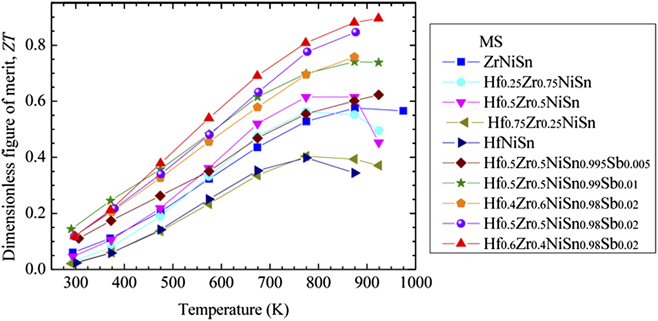
Figure 8 is the temperature dependence of figure of merit for the MS ZrNiSn-based samples. For the samples without Sb doping, the maximum ZT reached 0.61 for Hf0.5Zr0.5NiSn sample. For the samples with Sb doping, the maximum ZT reached 0.9 at 1000 K for the Hf0.6Zr0.4NiSn0.98Sb0.02 sample,Reference Yu, Zhu, Xiao, Shen, Yang and Zhao16 which is higher than the reported value in Ref. Reference Culp, Poon, Hickman, Tritt and Blumm12. The MS samples have an improved ZT by reduced thermal conductivity due to refined grain sizes. At the same time, the MS samples also have the increased electrical conductivity by in situ formation of nanoscale precipitates to optimize the electrical properties.
High temperature figure of merit ZT for MS ZrNiSn-based samples.
IV. CONCLUSIONS
ZrNiSn-based half-Heusler alloys were prepared by melt spinning to refine the grain size, followed by SPS. The grain size of the MS thin ribbons varied from ∼500 nm to ∼3 μm. Nanoscale precipitates dispersed in the matrix were observed, and the precipitates were suggested be metallic and increased the carrier concentration and the electrical conductivity. Compared with the levitation melting samples, the lattice thermal conductivity of the MS samples decreased due to the refined grain sizes. The MS samples have an improved maximum ZT value of 0.9 for the Hf0.6Zr0.4NiSn0.98Sb0.02sample due to reduced lattice thermal conductivity by enhanced grain boundary scattering and increased carrier concentration by in situ formation of nanoscale precipitates to optimize the electrical properties.
ACKNOWLEDGMENTS
We acknowledge the use of EPMA in the Key Laboratory of Submarine Geosciences, State Oceanic Administration, China. The work is supported by NSFCs (50731006, 51061120455, and 51171171), the National ‘973’ Program (2007CB607502) and the Fundamental Research Funds for the Central Universities (2011QNA4034).