Technological change and organizational development were fundamental to U.S. economic growth during the late nineteenth and early twentieth centuries. Economic activity moved increasingly inside the boundaries of firms and in-house R&D spread widely.Footnote 1 Yet despite the growing importance of the modern corporation at this time, new organizational structures were not always necessary for innovation. Figure 1 shows that 53 percent of U.S. patents were granted to independent inventors by 1930. Although the share of independents fell from 1880 onwards, the absolute level remained high. Did independents contribute trivial or nontrivial increments to knowledge capital accumulation? Why did their importance change over time relative to firm-based invention? Answers to these questions can inform our understanding of links between innovation and organizational change during one of the most significant phases in U.S. technological development.
INDEPENDENT INVENTOR PATENTS OVER THE LONG RUN

To examine the role played by independent inventors, I use a main data set of 18,048 randomly selected inventions patented by approximately 16,000 inventors at ten-year intervals between 1880 and 1930. I also use a data set of 6,181 R&D-based patents by inventors co-located with an in-house lab who would have been contractually obliged to assign their inventions to their employers.Footnote 2 Because these inventions originated from inside the boundaries of firms, they provide a useful comparison group to test for technological differences between corporate and independent inventions. The institutionalization of innovation in R&D labs during the early twentieth century represents one of the most significant changes to influence the structure of organized technology formation.Footnote 3
Jacob Schmookler argued that studies of the number of inventions suffer from a “serious but unavoidable defect stemming from an inability to evaluate the merit of inventions.”Footnote 4 I work to overcome this problem by using a new data set of historical patent citations to identify especially influential technologies. Citations have been used by a number of scholars to adjust patents for quality.Footnote 5 The new data include 42.8 million citations to patents granted since 1836 in the population of patents granted between February 1947 (when citations were officially included on patent documents) and September 2008. These citations represent a substantial improvement over the much used NBER patent data file that includes citations starting in patents granted only since 1975.
Using historical citation regressions, I provide baseline estimates showing a citation premium to independent inventor patents relative to patents assigned to firms. One explanation for the prevalence of independents is therefore that the quality of their technological developments was high. Using a matching method to pair up independent inventor patents with patents originating from inside R&D labs with the closest propensity score, I find that independent inventors located near to large cities were responsible for some of the most important technological developments. This finding is consistent with the large literature emphasizing the significance of urban externalities for innovation.Footnote 6
I argue that the high quality of independent innovation can be explained by demand-based incentives. Because independent inventors were disproportionately located in cities, they were close to patent agents and lawyers who facilitated transactions with firms.Footnote 7 Corporations, in turn, monitored the market for ideas and devoted considerable resources to acquiring outside patents from inventors across the United States.Footnote 8 Whereas inventors working within firms tended to focus their patents more on the areas related to local manufacturing activity, independents responded more to a nationwide market for their ideas. I use Adam Jaffe's technical proximity measure to show that this difference is reflected in the technological profile of independent and firm-based inventions.Footnote 9
If the quality of independent invention was so high, and demand existed for their technological discoveries, what accounts for the changing share of independent versus firm-based inventors illustrated in Figure 1? I show that the decline in independent inventor patent numbers followed a shift in the direction of innovation towards more complex capital intensive areas such as chemicals and electricity, which developed extensively during the Second Industrial Revolution.Footnote 10 Yet, as the corporate economy evolved and in-house R&D spread, firms in technologically progressive sectors still maintained extensive links with independents by purchasing the independents’ patents to complement corporate research lab activity. A large demand for independent inventions still existed because both types of inventing were combined to develop marketable innovations. Even as the direction of innovation changed, independents remained centrally important to the overall structure of technological development.
HISTORICAL BACKGROUND TO INDEPENDENT INVENTION
The literature on late-nineteenth- and early-twentieth-century innovation has done much to dispel the idea that independent inventors were exclusively a group of garage mechanics and backyard tinkerers with limited capital and equipment making discoveries by trial and error. Thomas Hughes’ American Genesis shows that independents developed wide ranging capabilities that created large complex interrelated systems of innovation such as electric power and communications networks. Some independent inventors spread their inventions widely and used external capital to fund research investment. Others focused on a single technology space, although they too were frequently engaged in commercialization.
Although Hughes focuses on the activities of 12 main inventors like Elmer Sperry (1860–1930), Lee de Forest (1873–1961), and Edwin Armstrong (1890–1954), a renaissance of thinking on independent inventors has also extended research into areas beyond the leading inventors in their fields. A series of papers have shown how inventors still had the ability to maintain independence from firms in areas such as the Midwest where venture capital finance was available.Footnote 11 Independent inventors in educational institutions frequently consulted for corporations in industries such as pharmaceuticals, electricity, and communications.Footnote 12 Wheeler P. Davey (1886–1959), Professor at the Pennsylvania State University, held consulting engagements with General Electric, Dow Chemicals, the Aluminum Company of America, and the New Jersey Zinc Company in areas related to crystal chemistry and X-rays.Footnote 13 In a well-known case, in 1920 the Westinghouse Electric and Manufacturing Company purchased Columbia University Professor Edwin Armstrong's radio patents for feedback detection and the superheterodyne circuit for $350,000.Footnote 14
One reason that independent inventors could thrive was the institutional structure of the patenting system. The democratic nature of U.S. patenting encouraged individual inventors and facilitated their response to demand-based incentives.Footnote 15 Patent agents and solicitors diffused geographically with urbanization, creating relational self-enforcing agreements between independent inventors and intermediaries.Footnote 16 It was also cheaper to patent in the United States. It was 19 times more expensive to carry a patent to full term in Britain in 1875 and still ten times more expensive in 1925.Footnote 17 Moreover, U.S. independent inventors who patented in the early twentieth century automatically held intellectual property rights on their inventions for a term of 17 years. By contrast, in Britain the patent term was 14 years until 1919 (when it was extended to 16 years) and nonpayment of renewal fees at specific stages of a patent life meant that less than 5 percent of patents were carried to full term.Footnote 18 In Germany, the patent system was even more demanding of inventors on a renewal fee basis.Footnote 19
While we know from previous research that independent inventors existed on a broad scale in the United States and in an institutionally favorable environment for innovation, very little is known about the quality of independent inventions relative to those originating from firms, or how independents functioned within the organizational structure of U.S. technological development. In his 1957 and 1966 studies of independent inventors, Schmookler lamented that he did not have the data to precisely measure the technological significance of independent inventor patents, so he could only surmise that independents were important.Footnote 20 Joseph Schumpeter argued that independent inventors were the true harbingers of technological development because the growth of corporate labs with discipline and control methods routinized innovation and undermined creative destruction.Footnote 21 His evidence, however, was also impressionistic. In the remainder of this article, I use new data to examine independent invention more systematically.
PATENTS, HISTORICAL CITATIONS, AND R&D LAB INVENTIONS
The 1880–1930 Patent Samples
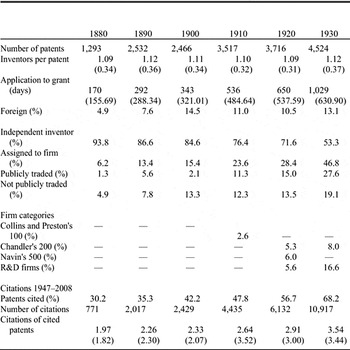
The primary data sources for this study are 10 percent random samples (by grant number) of U.S. patents taken at ten-year intervals between 1880 and 1930 as described in Table 1.Footnote 22 For illustrative purposes, Figure 2 maps the geographic location of independent inventors, which shows they were concentrated in east coast manufacturing areas. I follow the United States Patent and Trademark Office's definition of an independent invention as “a patent for which ownership is either unassigned (i.e., patent rights are held by the inventor) or assigned to an individual at the time of grant.”Footnote 23 Unassigned patents were much more likely to be created without the resources of a firm.Footnote 24 According to Schmookler, patents by individual inventors “can serve as a first approximation to the number of patented inventions made by independents.”Footnote 25
DESCRIPTIVE STATISTICS: PATENT SAMPLES, 1880–1930

Notes:
Standard deviations are in parentheses. Independent inventors are defined according to the United States Patent and Trademark Office's definition of “a patent for which ownership is either unassigned (i.e., patent rights are held by the inventor) or assigned to an individual at the time of grant.” Patents assigned to publicly traded firms are determined by matches with lists of companies in the Commercial and Financial Chronicle, including both the New York and regional stock exchanges. Firm categories are defined as follows: For large enterprises, I used Collins and Preston, “Size Structure,” which lists the largest 100 firms by assets size in 1909; Navin's “500 Largest,” which lists the largest 500 American industrial corporations in 1917, again ranked by asset size; and Chandler, Scale and Scope, which provides asset-based listings of the 200 largest firms in 1917 and 1930. For R&D labs, I matched the assignments up against all firms with industrial research facilities as given in the 1921 and 1931 editions of the National Research Council's survey of industrial R&D laboratories.
THE GEOGRAPHIC LOCATION OF INDEPENDENT INVENTORS, 1880–1930
Historical patent data reflect economically significant information about technological development. Independent inventors attached great importance to trends in patenting when determining the areas in which they would focus. For example, Elmer Sperry, inventor of the navigational gyrocompass, observed patents being issued by the United States Patent and Trademark Office (USPTO) to identify clusters of technologies that other inventors were working on. He improved upon their ideas, solved problems that they could not, and exited the field when he perceived opportunities for profit had diminished. The data on technological knowledge that Sperry accessed was publicly available.Footnote 26 The USPTO published its Official Gazette and The Scientific American published its popular weekly lists of patents issued.
Table 1 reveals that the decline of independent invention was only slowly associated with the rising significance of large firms. This can be seen most clearly in comparisons of patents assigned to the largest industrial firms. Norman Collins and Lee Preston's 100 largest firms in 1909 account for under 3 percent of patents in 1910. Thomas Navin's 500 largest firms account for just 6 percent of patents in 1920 and Alfred Chandler's largest 200 firms for 5 to 8 percent of patents between 1920 and 1930. The share of patents assigned to firms with R&D labs listed in the National Research Council's correspondence surveys increases almost threefold during the 1920s to account for around 17 percent of all patents by 1930.Footnote 27 Yet, in absolute terms, independents accounted for more than three times the number granted to R&D firms (i.e., 2,409 versus 753 in 1930). Moreover, the growing number of days between application and grant shown in Table 1 may have enabled independents to engage in transactions with firms during the pendency period. Consequently, the level of independent invention shown here is almost certainly downward biased.Footnote 28
Historical Citations, 1947–2008
A key aim of the analysis is to determine the technological significance of independent versus firm-based inventions. I therefore use a new dataset of historical patent citations to quality-adjust the raw patent counts. The new citations contain prior art references from patents granted between February 1947 and September 2008.Footnote 29 Following a USPTO Notice issued on December 19th, 1946, examiners were instructed to add citations in the published format of the patent, a practice that was incorporated into the Manual of Patenting Examining Procedure (paragraph 1302.12). The citations provide a unique insight into the technological significance of older generations of inventions as they document cumulative innovation in patenting. References in the new format began with patents granted on February 4th, 1947.Footnote 30 The addition of the patent citations from 1947 through 1974 fills in a large gap in tracing the precedents for American invention. It almost doubles the share of patents granted between 1880 and 1930 that are subsequently cited from 24 percent to 46 percent.
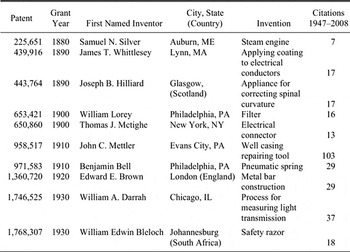
Table 1 shows that in the 1930 sample over two-thirds of the patents are cited as prior art in more modern patents, and just under one-third in 1880.Footnote 31Table 2 provides examples of some of the most important independent inventions in the data set judged by their citation counts. Some of these innovations were simple modifications of existing technologies such as the safety razor patented by William Bleloch of Johannesburg, but even this patent continued to be cited as prior art by modern corporations like The Gillette Company and American Safety Razor Co. In other instances, the invention required a higher level of mechanical ingenuity such as the steam engine patented by Samuel Silver. Independents like William Darrah were active in process innovation, although process patents account for only around 2 percent of the sample overall. Notwithstanding the vast majority of independent inventors in the data set were granted only one patent, in the tail of the distribution are inventors like Thomas Mctighe, who in addition to his highly cited electrical connector invention, was granted over 40 other patents.Footnote 32 The most highly cited patent by an independent in the data set is a 1910 invention by John Mettler of Evans City, Pennsylvania for patching leaks in pipe casings. It is cited extensively in subsequent patents related to the construction of oil and gas wells.
EXAMPLES OF HIGHLY CITED INDEPENDENT INVENTOR PATENTS FROM THE 1880–1930 PATENT SAMPLES

Note:
All examples are in the top decile of the citation distribution for each year.
The R&D Lab Patent Sample
Independent inventors can be defined as unassigned patents using Schmookler's “first approximation,” but defining corporate patents as those assigned to firms is likely to create larger measurement errors. Firms often engaged with independents to buy their inventions prior to the patent grant date, and therefore counts of patents assigned to firms may include many that were truly the work of independent inventors.
To address this issue, I use a complementary data set, which identifies firm-based inventors working within a corporate R&D lab.Footnote 33 The starting point is the data used in previous work, namely almost 18,000 patented technologies assigned to 69 U.S. firms operating 94 research and development laboratories in 1920s America.Footnote 34 For this study, only inventors who were geographically co-located with a lab were retained, the intuition being that these inventors would be employees of the firm given their residential proximity to the labs.Footnote 35
This resulted in a sample of 6,181 patents, from 49 companies including a wide array of firms in different industries such as General Electric, Singer Manufacturing, Du Pont, AT&T, and Eastman Kodak. The patents in the sample received 12,227 citations in patents granted between 1947 and 2008. Table 3 shows some of the most highly cited patents originating from R&D labs such as those from Albert Hull (1880–1966), a famous inventor of the magnetron at General Electric's Schenectady laboratory and Samuel Sheppard, a renowned scientist employed by Eastman Kodak whose patents on light sensitization revolutionized the photographic film industry.
EXAMPLES OF HIGHLY CITED PATENTS FROM THE R&D LAB SAMPLE

Notes:
All examples are in the top decile of the citation distribution. Self-citations are removed by excluding all citations where the patent assignee on the citing and cited patent matched.
MEASURING PATENT QUALITY
Baseline Regressions
My empirical specifications are designed to compare the quality of independent inventor patents with the quality of patents assigned to firms. For the baseline citation function, which compares citations to independent inventor patents with those assigned to firms, I use a negative binomial specification on cross sections of the patent samples. The mean expected value of citations, HCIT, to patent i is parameterized as follows

where the vector Z contains control variables. First, I use a dummy variable to identify foreign inventor patents in the sample since citations to these patents should be lower given attenuation in citations as a function of geographic distance from the United States.Footnote 36 Second, I use technology dummies defined by the main patent categories developed by Bronwyn Hall, Adam Jaffe, and Manuel Trajtenberg to control for average differences across sectors in citations.Footnote 37 Finally, year dummies absorb average differences in citations for different years.
The key covariate is INDEP, which is coded one if patent i is an independent inventor patent according to its assignment status and zero for all other patents. The objective is to determine the quality of independent inventor patents relative to the overall pool of patents assigned to firms. Since δi is exponential, [exp(α) − 1] × 100 measures the expected percentage change in historical citations when the dummy variable for independent inventor patents comes on.
Propensity-Score Matching
One potentially confounding problem with the baseline specification and the sample in the baseline regressions is that α may not recover an efficient estimate of the difference in citations between independent inventor patents and patents assigned to firms. Recall that firms often acquired independent inventions prior to the patent grant date and therefore the comparison group in the baseline regression could be contaminated by independent inventions recorded in the patent statistics as those that are assigned to firms. I therefore use the alternate R&D lab patent sample described above, which clearly defines inventions originating from inside the boundaries of a firm.
To compare similar inventions that were created by independents and by R&D firms, I run a probit model of the probability of being “treated” with the dependent variable as the zero-one dummy for being an independent invention as a function of observables. I use the resulting propensity scores to provide a control for each independent inventor patent from the R&D lab patent sample.
The large size of the control sample (N = 6,181) permits key observables to be integrated into the analysis. In other studies, location-based variables have been shown to be important in explaining citations to patents, which may be especially relevant here given that economic activity during the late nineteenth and early twentieth century became increasingly urbanized.Footnote 38 Over one-fifth of independent inventors resided within 5 miles of one of the top five cities in the country by population size in 1920 to 1930 or more than one-quarter within the same radius of the top ten cities. Adding in the broader metropolitan areas and the hinterlands, which are covered by the 30 mile radius, the shares increase to around 30 percent and 40 percent for the pooled 1920 and 1930 samples respectively.Footnote 39
To create a geographic location variable, I calculate the distance of inventors from a large city with 100,000 or more inhabitants as listed in the 1921 and 1927 Biennial Census of Manufactures, which defines main agglomerations of manufacturing establishments. I set a 5 mile ring around these cities to allow for spillovers of knowledge from the city and use a dummy variable to identify inventors within and outside this radius and I then add this variable to the calculation of the propensity score. I also add region-based dummy variables to further match on observables.
PATENT QUALITY REGRESSION RESULTS
Baseline Regression Results
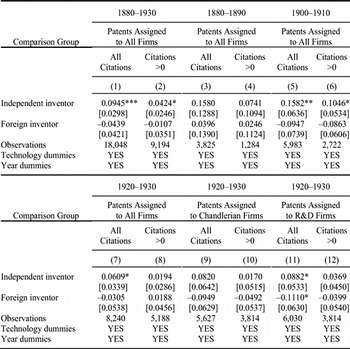
Table 4 reports the coefficients from negative binomial regressions using the specification in equation 1. As a baseline estimate, the coefficient of the independent inventor dummy measures the difference in citations to independent inventor patents relative to patents assigned to firms. The first two columns of results are from regressions on the pooled samples of 1880 to 1930 patents, where differences in citations specific to each year but not varying cross-sectionally are absorbed into the year dummies and average time-invariant differences in citations across sectors are captured by the technology dummies.Footnote 40 As expected, the coefficient on the foreign inventor dummy is negative.
HISTORICAL CITATION REGRESSIONS

* indicates significance at the 10 percent level.
** indicates significance at the 5 percent level.
*** indicates significance at the 1 percent level.
Notes:
Negative binomial regressions are run on the patent samples described in Table 1. Coefficients are reported with robust standard errors. Technology dummies are derived from Hall, Jaffe, and Trajtenberg's main patent classes (“Patents-Citations,” pp. 452–54). The dummy “Independent inventor” is coded 1 for independent inventor patents and zero for inventions assigned to firms. “Foreign” is coded 1 for foreign inventor patents and 0 otherwise. When the comparison group is Chandlerian firm patents or R&D firm patents, all patents assigned to firms other than in these categories are dropped.
The regressions in columns 3 to 8 have the same specification, but are run on three subperiods: 1880 to 1890, 1900 to 1910, and 1920 to 1930 to examine differences in the parameter estimates over time. In columns 9 to 12, I change the comparison group from patents assigned to all firms, to patents assigned to Chandlerian firms and R&D firms based on their allocations into these categories in Table 1. In each set of results the regressions are run on all patents whether cited or not, and again on a sample confined to patents with one or more citations. The goal is to see whether differences in the quality of independent and assigned patents could have been driven by low costs of patenting that led to more patenting of more marginal (zero cited) inventions by firms. One of Schmookler's survey respondents stated that independent inventors “tend to patent only what really works and will bring returns while corporations notoriously indulge in indiscriminate patenting.”Footnote 41 Alternatively, the cost of patenting was so low in the United States at this time that independents might also have engaged in strategic patenting, so the difference in patenting practices between firms and independents may not have been large.
The coefficient of the independent inventor dummy in the first column of Table 4 measures the effect on historical citation counts to independent inventor patents relative to patents that were already assigned to a firm as of the grant date. It shows that historical citation counts were [exp(0.0945) − 1] × 100 = 9.9 percent higher for independent inventor patents than for patents within firms. When the regression is restricted to a subset of cited patents, the citations premium is more than halved to 4.3 percent and the effect is statistically significant only at the 10 percent level. Nevertheless, the results provide some prima facie evidence to suggest that independent inventors were developing nontrivial increments to knowledge capital accumulation relative to patents assigned to firms.
Breaking down the results into subperiods indicates some variation over time in the independent inventor citation premium. Using all patents, the coefficients are at their highest in 1880–1890 and 1900–1910 (columns 3 and 5), implying 17 percent more historical citations for independents’ patents. Using only patents with one or more citations, the highest coefficient implies that independents received 11 percent more citations in the 1900–1910 period (column 6). The effects are substantially smaller in the other periods. Although a number of the independent inventor coefficients are not statistically significant, all are positive. At a minimum, the results suggest that the quality of independent inventors’ patents on average was no worse than the assigned patents and might have been better.
Propensity Matching Results
The comparison group in Table 4 is patents assigned to all firms or patents assigned to firms within the sample data identified as Chandlerian or R&D firms for the time period 1920 to 1930. Table 5 reports the results when estimating differences between historical citations to matched independent inventor patents and control patents from my alternate sample of R&D lab patents. As discussed above, the alternate R&D sample data provide a more homogenous comparison group because they clearly define patents assigned to firm-based inventors.
MATCHING ESTIMATOR RESULTS

Notes:
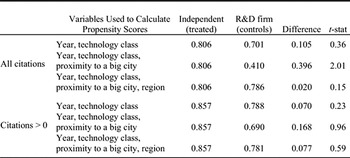
The outcome variable here is log(1+historical citations) so that the difference between treated and control patents is comparable to the coefficient of the independent inventor dummy in Table 4. Controls are patents with similar characteristics based on the list of variables used to calculate the propensity score. The matching method is nearest neighbor.
Table 5 lists the different sets of variables used to estimate the propensity scores, starting with the control variables used in Table 4 and sequentially adding variables for the location of inventors. I use the natural logarithm of citation counts as an outcome variable (where a constant of 1 is added to rescale zero values) so the difference between treatment and control patents in Table 5 is approximately comparable to the coefficient of the independent inventor dummy in the baseline regression. Separate estimates are provided for all citations and nonzero citations.
The results using the propensity score matching methods are similar to the results in the baseline regressions. The difference between independent and firm-based patents is always positive, but the differences are only statistically significant under one estimation procedure. The magnitudes of the differences between treatment and control patents when controlling for year and technology class are similar to the regression results reported in columns 11 and 12 of Table 4, although none of the estimates is statistically significant. Importantly, the estimate is statistically significant when the propensity score takes into account year, technology class, and proximity to a big city in the sample with all patents included. Although once region is included in the matching process, the size of the difference declines and the difference is no longer statistically significant, even the most pessimistic interpretation of the matching results suggests that patent quality for independent inventions is statistically indistinguishable from inventions emerging from within R&D labs.
A BROAD MARKET FOR IDEAS
Why was the quality of independent invention as high or higher than corporate lab inventions? Both Schmookler and Kenneth Sokoloff would argue that inventors were responding to incentives created by demand.Footnote 42 Payoffs, even if only in expectation, can act as a powerful spur to independent technological discovery.Footnote 43 Demand inducements were particularly strong in cities during the late nineteenth and early twentieth century where networks of patent agents and other intermediaries provided an institutional structure for market-based exchanges.Footnote 44The Scientific American, publishing arm of the New York patent agents Munn & Company, frequently printed pieces on independents who profited from their inventions under headlines such as, “FORTUNES IN PATENTS,” “PATENTS THAT PAY,” and “MANY LITTLE THINGS WHICH HAVE MADE PATENTEES RICH.”
While some inventions were traded locally, patent intermediaries also encouraged inventors to advertise their inventions widely, suggesting geographically broad demand-side influences on the market for ideas. William E. Simonds, a patent lawyer in Hartford, Connecticut, provided the following advice:
“If the inventor can afford it, it is well to have the invention illustrated and described in one or more of the scientific and mechanical publications of the day of which The Scientific American and The American Artisan of New York, and The Scientific Press of San Francisco are notable examples.”Footnote 45
The broad geographic scope of patents offered for sale can be seen in national and international periodicals and magazines. In 1920 the Chicago-based Popular Mechanics Magazine listed 96 inventions for sale by American independent inventors in 26 different U.S. states, with a further 6 offered for sale by inventors from overseas.Footnote 46The Chicago Defender reported on March 30th, 1912 that an African American inventor—Mr. S. A. Baker—had sold his patent for a car heater to a Canadian company for $160,000. In 1928 AT&T, with its central research facility in New York, acquired Los Angeles inventor Howard W. Jewell's technology for encapsulating and protecting underground wires. Joseph C. Theberath of Cleveland, Ohio, had his invention for smoothing the rims of pneumatic tires to prevent puncturing acquired by General Motors, which maintained a principal research facility 178 miles away in Detroit, Michigan.Footnote 47
Assuming independent inventors were responding to geographically broad demand-side influences, this should be observable in the technological profile of their patents. If independents are responding to the same national market for ideas throughout the country, the distribution of patents across technology categories for independent inventors should look similar in every city. However, the distribution across technology categories of firms’ patents will not look the same in every city because firms in a specific city would focus on patents for their specific industries and the industry distributions in specific cities varied substantially from city to city. Since manufacturing activity was highly regionally specialized at this time, and the technological profile of firms ought to reflect this, we should see even more dissimilarities between the patents of independent inventors and firms at the regional level.Footnote 48
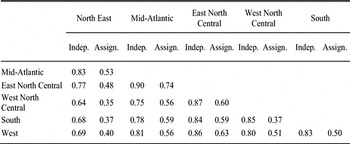
To test for such differences, I use Jaffe's technical proximity metric to define and compare the distribution of inventions patented by independents and firms. In the formula below, based on a New York-Chicago location example, the vector SNY contains the profile of New York independent inventor patents with respect to each of the USPTO's 3-digit patent classes and SCH is a vector containing the profile for independents in Chicago. The elements of each vector are shares of patents in each of the 3-digit classes and the metric ρ is the uncentered correlation between the vectors. A high value implies technical proximity between both groups of patents and vice versa for low values.

Calculations of ρ confirm these differences. For independent inventors in New York and Chicago, two major cities in the data set, ρ = 0.76 whereas ρ = 0.41 for patents assigned to firms. Examination of the underlying distributions shows that Chicago firms had a greater concentration of patents in areas such as railroad rolling stock than New York firms, whereas in both cities the distribution of independent inventor patents are more proximate. This difference in technical proximity scores is even more revealing because the choice of cities biases the result in the other direction. New York and Chicago were both diverse agglomerations—probably more so than other U.S. cities— and independents located in those cities may have supplied innovations to the same East Coast or Midwest manufacturing areas.
Table 6 reports values of ρ in region to region comparisons. In every cell of the matrix, ρ for independent inventor comparisons is larger by a multiplier ranging from 1.2 to 2.3 than the ρ for comparisons of patents assigned to firms. These results indicate that the technical profile of patents assigned to firms reflected the regional concentration of industries. The proximate profile of patents granted to independents across regions, on the other hand, is much more consistent with the argument that their technological efforts were directed by a nationwide market for ideas.
MATRIX OF BI-REGION TECHNICAL PROXIMITY SCORES

Notes:
Regions are as follows: North East: CT, ME, VT, NH, MA, and RI. Mid-Atlantic: NJ, NY, DE, and PA. East North Central: IL, IN, MI, OH, and WI. West North Central: IA, KS, MN, MO, NE, ND, and SD. South: DC, MD, VA, NC, SC, GA, KY, TN, LA, MS, AL, AR, FL, WV, and TX. West: NM, CA, AZ, CO, NV, UT, OK, ID, OR, WA, MT, WY, and AK.
THE CHANGING DIRECTION OF INNOVATION
If the quality of independent invention was high and inventors were responding to a broad market for their ideas, why did the importance of independents change over time relative to firm-based invention? One explanation lies in the changing technical structure of inventive activity. As a consequence of the Second Industrial Revolution, which pushed out the frontier of useful knowledge towards capital-intensive innovation, the direction of technological development changed.Footnote 49 For example, the share of patents in electricity rose from 3 percent in 1880 to 11 percent in 1930, while the share in chemicals rose from 8 to 12 percent. The complexity of patents also increased as a larger share of patents was assignable to multiple categories over time. The share of patents assigned to more than one technical category rose from 22 percent in 1880 to 36 percent in 1930. One implication of more complex technologies is that the learning process is protracted and higher levels of human capital and finance are required.Footnote 50
This change in the direction and complexity of innovation affected independent inventors and is highlighted in Figures 3 and 4, which show the number of patents by inventor type in chemical and electricity versus mechanical sectors. Whereas independent inventors accounted for a larger number of mechanical patents than firms did in 1930, in chemicals and electricity they were superseded by firms during the decade of the 1920s. Statistics for Chandlerian and R&D firms confirm the relative movement of technological development of the progressive sectors inside the boundaries of firms. In 1930 Chandlerian firms accounted for 14 percent of patents in chemicals and electricity, while R&D firms accounted for 29 percent, almost double their respective shares of patents across all sectors in Table 1 (8 percent and 17 percent).
PATENTING IN CHEMICALS AND ELECTRICITY, 1880–1930
PATENTING IN THE MECHANICAL SECTORS, 1880–1930
Despite this shift, however, firms in the new high-technology sectors still relied on independent inventions because they complemented formal innovation taking place inside of firms. For example, General Electric actively promoted the purchase of patents to augment its internal stock of knowledge by managers at several levels. In 1929 purchases of outside patents for less than $1,000 could be approved by a manager in the Patent Department, a vice president could approve purchases up to $5,000, while the vice president of the Patent Department and the vice president of the department in which the technology would be used could sanction payments of up to $10,000. Recommendations for further de-layering of the purchase decision were put before the board in April 1933.Footnote 51 RCA, another high-tech firm, acquired many television patents in the late 1920s and early 1930s from independent inventors to complement its own R&D initiatives.Footnote 52 Some of Du Ponts’ major early-twentieth-century innovations in chemicals originated from the technologies acquired by the company externally.Footnote 53 Standard Oil set up a research and development facility specifically to exploit outside innovations.Footnote 54
Transactions between firms and independents were important because R&D firms were more likely to patent in areas in which independents generally patented less. AT&T's central research facility—Bell Labs—in New York focused on innovations related to focal areas such as the telephone and facsimile transmission, and often acquired complementary inventions externally, which were modified by the lab and then absorbed into the firm.Footnote 55 Evidence from a broader sample of corporations shows that a specialized structure for technological development existed whereby firms created a balance between technologies they pursued internally and externally.Footnote 56 According to William Baumol, independent and lab-based innovation contribute significantly to economic growth precisely because “these two types of activity are complementary.”Footnote 57 This aspect of technological development remained centrally important even as the organization of innovation shifted toward corporate labs. R&D labs became organizationally more significant in the development of the new capital-intensive and technologically complex sectors, but they still used independent inventions.
CONCLUSION
Despite the rising importance of the modern corporation and the spread of in-house R&D, over half of U.S. patents originated from outside the boundaries of firms by 1930. Comparisons of citations to a broad sample of patents by individuals and firms shows that the quality of independent inventions was similar to or even higher on average than the quality of inventions within firms. As Schmookler once noted about the period, “while large-scale enterprise unquestionably makes a great contribution to modern technological progress, the claim that it alone does so is entirely unwarranted.”Footnote 58
Two factors appear to be particularly relevant to explaining why independent inventors made important contributions to knowledge capital accumulation at this time. First, independents were located primarily in cities, which served as hubs of innovation, and they engaged in a geographically broad market for their ideas. Second, as the science-based Second Industrial Revolution led to changes in the industrial organization of R&D, independents continued to create inventions that could be combined with in-house research investments to develop marketable technologies. Firms devoted considerable resources to transactions with independents and they frequently absorbed complementary outside knowledge.