Introduction
High-income countries around the world are characterised by a rapidly ageing population (Lutz, Sanderson and Scherbov Reference Lutz, Sanderson and Scherbov2008), especially among the ‘oldest old’ (Sadana et al. Reference Sadana, Foebel, Williams and Beard2013). Australia is no exception, although the ageing of the Australian population is somewhat moderated by a high rate of migration (Hugo Reference Hugo2014). The Australian Bureau of Statistics (ABS) estimates that, if there is a continuation of current trends in life expectancy, net overseas migration and fertility, the proportion of the Australian population aged at least 65 years will increase from 14 per cent in 2013 to 23 per cent in 2063, while the proportion aged at least 85 years will increase from 2 to 5 per cent (ABS 2014). In each case the increase is more marked for women than for men.
Population ageing brings with it a range of social challenges, among which is mobility, an elusive term that is used in different ways in different areas of study (Schwanen and Ziegler Reference Schwanen and Ziegler2011). The most common quantitative approach to mobility is to define it in terms of physical movement across the transport system (Ziegler and Schwanen Reference Ziegler and Schwanen2011). This definition was employed in the research reported here. Regardless of the complexity of approaches to mobility, in its various forms mobility is presumed to be linked to health and wellbeing, and this presumption is supported by empirical evidence (Fonda and Herzog Reference Fonda and Herzog2001; Marottoli et al. Reference Marottoli, Mendes de Leon, Glass, Williams, Cooney and Berkman2000; Mollenkopf, Hieber and Wahl Reference Mollenkopf, Hieber and Wahl2011; Molnar et al. Reference Molnar, Eby, St Louis and Neumeyer2007; Ragland, Satariano and MacLeod Reference Ragland, Satariano and MacLeod2005).
Mobility through physical travel is strongly determined by geographic factors and their interdependence with transport and service infrastructure, transport policies and economic factors, especially for older people (Schwanen and Ziegler Reference Schwanen and Ziegler2011). Some geographic settings foster a high dependence on car travel (Zeitler et al. Reference Zeitler, Buys, Aird and Miller2012), principally due to a mix of low-density housing; low levels of public transport provision; location of businesses, services and shops away from most residential areas; and affordable motor vehicles. As noted by Zeitler and Buys (Reference Zeitler and Buys2015), the city of Brisbane in Queensland, Australia, can be considered as a setting that fosters car-dependence, and by extension this can be said of the entire state of Queensland (given that Brisbane is the most populous city and has the highest population density in the state). In such a setting, continued use of a car, and hence a valid driving licence, are key to physical movement across the transport system. This is reflected in licensing statistics, which show that more than 90 per cent of Queenslanders aged 25–60 years are licensed (King et al. Reference King, Soole, Watson and Schramm2011).
In Queensland drivers can renew their driver's licence every five years once they have progressed through the novice stages (Learner, Provisional) until the age of 75 without the need for a knowledge test or on-road driving test. At any age, a driver with a long-term or permanent medical condition that could affect their ability to drive safely must inform the Department of Transport and Main Roads and may need to carry a medical certificate, drive under specified conditions or give up their licence (known as ‘Jet's Law’; Department of Transport and Main Roads 2013). From the age of 75 years drivers are required to carry a medical certificate whenever they drive on the road certifying that they are medically fit to drive and specifying any conditions imposed by the issuing medical practitioner. There is no legislative requirement to undergo a driving test, although a medical practitioner can request a driving test. Medical practitioners are supported with official guidelines on assessment of fitness to drive (Austroads 2012); however, it is noteworthy that each Australian state and territory applies their own testing regimen. The Queensland system was reviewed in 2011–12, following concerns arising from a number of highly publicised crashes involving older drivers (e.g. involving the serious injury of infants, and deaths of pedestrians); however, the most substantive change was to ensure that medical certificates issued for drivers aged 75 years or more are restricted to a maximum one-year period (Department of Transport and Main Roads 2012).
It was noted above that about 90 per cent of Queenslanders aged 25–60 years are licensed; over the past few decades there is evidence of a strong cohort licensing effect amongst older drivers, with each successive generation being more likely to be licensed than the previous generation (King, Nielson and Soole Reference King, Nielson and Soole2007; King et al. Reference King, Soole, Watson and Schramm2011). To demonstrate, in 1988 the proportion of the adult population with a driving licence did not drop below 90 per cent until the age of 50 years; by 1998 the drop did not occur until the age of 60 years, and by 2008 it was not until the age of 70 years. In 1988, less than 40 per cent of the population aged at least 70 years had a driver's licence; by 2008 this had increased to more than 60 per cent, and the indications are that this increase will continue. A similar cohort licensing effect has been observed in the United States of America (Wang and Carr Reference Wang and Carr2004) and the United Kingdom (UK) (Banister and Bowling Reference Banister and Bowling2004; Metz Reference Metz2012); the UK data also show a gender gap (such that older men are always more likely to be licensed than older women) that is closing as successive cohorts age.
While it is acknowledged that there is a need for older people in Queensland to maintain their licence for as long as possible, provided they can still drive safely, it is also acknowledged that there will be an inevitable decline in ability to drive with age (Harada, Natelson Love and Triebel Reference Harada, Natelson Love and Triebel2013). It has also been established that many older drivers adapt their driving as they age, by driving less or avoiding situations where they feel unsafe, as well as situations that they have the freedom to avoid, such as peak-hour congestion (Meng and Siren Reference Meng and Siren2015). However, it has been noted that many older drivers respond to their feelings of discomfort or risk while driving by cessation of driving altogether when in fact they are still safe (Charlton Reference Charlton2002). For drivers who are considering reduction or cessation of driving for health reasons, there may be no increase in transport by other modes. Hjorthol (Reference Hjorthol2013), in a large survey in Norway of people 65 years and older, found that up to the age of 85 years very few older adults reported problems driving, whereas substantially larger proportions of older adults experienced problems in using public transport and walking. In addition, Ziegler and Schwanen (Reference Ziegler and Schwanen2011) note that being able to continue to use a car can offset the disadvantages of failing health. Both of these findings are consistent with the suggestion that the medical issues that lead to driving cessation also mean that drivers cannot transition to walking or use of public transport (Mollenkopf, Hieber and Wahl Reference Mollenkopf, Hieber and Wahl2011). Nevertheless, there has been some research on the transition from being a driver to a non-driver, which includes a focus on facilitating a shift to alternative transport modes in order to maintain the ability to move across the transport system (e.g. Musselwhite and Shergold Reference Musselwhite and Shergold2013). Such research has demonstrated mixed results, e.g. Liddle et al. (Reference Liddle, Haynes, Pachana, Mitchell, McKenna and Gustafsson2014) evaluated an intervention intended to increase the readiness of older drivers to take up other transport options when they gave up their licence, but found only a short-term change (less than three months) in actual use of alternative transport modes between the intervention and control groups, although the results may have been affected by a high attrition rate and small sample size.
In spite of the attention paid to the transition from being licensed to no longer being legally able to drive, there has been little research into the balance between modes as drivers age. Even though the research does not lend strong support to the likely effectiveness of interventions aimed at transitioning drivers to alternative transport modes, it is possible that older drivers already exhibit a gradual increase in use of non-driving modes as driving decreases. The present research addresses this issue by examining the differences between older drivers in mode use by age.
In Queensland, the most significant modes of travel for older road users are as drivers, as passengers (usually in a private car) and as pedestrians, and this is reflected in road crash statistics (King et al. Reference King, Soole, Watson and Schramm2011). However, the crash statistics point to a gender difference among older drivers, with older women being more likely to be injured as passengers and pedestrians than older men. There are both social and demographic factors which influence how transport is split between modes with age. One factor is the combination of gender, social roles and partner loss (noting that in these age groups same-sex couples comprise only about 0.1 per cent of couples; ABS 2013a ): at the time most of the current cohort of older drivers began driving, females in Queensland tended to be less likely to get a licence (King, Nielson and Soole Reference King, Nielson and Soole2007), and in couples where both are licensed, males are more likely to drive when both are in the car (Hassan, King and Watt Reference Hassan, King and Watt2015). Loss of a husband would therefore be associated with an increase in female driving and a drop in female travel as a passenger, whereas there may not be much change in male travel mode as the result of the loss of a wife.
There are also gender differences in mortality: males tend to die at a younger age than females, leading to a marked shift in the sex ratio with age (ABS 2013b ). In most couples the male is older than the female (ABS 2009; Hjorthol Reference Hjorthol2013), so that loss of a husband is more common and occurs at a younger age for a surviving wife than does loss of a wife for a surviving husband. While it has been conjectured above that widowed women who were already licensed may increase their driving because they can no longer be driven by their spouse, a Swedish study (Stjernborg, Emilsson and Stahl Reference Stjernborg, Emilsson and Stahl2014) provides evidence that this may not occur. In an investigation at two points in time, during which some of the sample had lost their partner, Stjernborg, Emilsson and Stahl (Reference Stjernborg, Emilsson and Stahl2014) found that many stopped driving and that walking was valued as highly as driving. It is worth noting that there was a strong emphasis amongst study participants regarding the need to have a walkable environment, whereas the built environment in Queensland is not conducive to walking by older pedestrians (Shaw, Lennon and King Reference Shaw, Lennon and King2012). Furthermore, recent research in Brisbane suggests that mobility as an older person is regarded as less problematic if one can still drive (Zeitler and Buys Reference Zeitler and Buys2015). However, given the influence of gender roles on choice of driver when a couple travels, many older widowed women may be driving when they would prefer to be a passenger.
From the above discussion, two questions emerge regarding physical movement across the transport system for licensed drivers as they age:
-
1. For older people who continue to maintain a driving licence as they age, is ageing marked by a decrease in mobility as a driver which is compensated for by an increase in travel as a passenger or pedestrian?
-
2. Given the gendered nature of driving in the current older generation, combined with a marked shift in the sex ratio with age, are there different implications for mobility by mode for men versus women?
The answers to these questions are relevant to the maintenance of mobility among people as they age, and to the transition to other modes experienced by men and women as they age.
Aims, objectives and scope
This research was conducted in the state of Queensland, Australia, with a sample of older drivers. As noted, Queensland has a low population density and even its most concentrated area (Brisbane, the capital) is considered to foster car-dependency. The overall aim of the research was to investigate differences in the use of travel modes by older drivers in Queensland. More specific objectives were:
-
• To determine whether changes in use of travel modes varied by age.
-
• To investigate whether these changes also differ by gender.
-
• To ascertain whether compensations were made for reductions in one mode by increasing engagement in another mode.
-
• To ascertain whether actual travel mode accorded with preferred travel mode.
-
• To comment on the implications for ageing drivers in Queensland.
As noted above, previous research into road crashes among older road users in Brisbane shows that the main forms of transport are as a car driver, as a passenger (primarily in a car) and as a pedestrian. Cycling and motorcycling, and driving a heavy vehicle, are rare. Consequently, the consideration of modes was confined to travel as a driver, passenger or pedestrian.
Method
Sample
The sample was recruited from the Queensland Independent Survey Panel in Road Safety (InSPiRS). Initially 5,000 Queensland households were recruited for InSPiRS to contribute to important road safety research by giving their opinions and sharing their knowledge of relevant issues from time to time. At the time of the current survey, there were about 600 panel members over the age of 60 years. All of these members were contacted by telephone. A number of households that were not contactable, had decided that they no longer wanted to participate in the panel, who were unavailable at the time of contact and call-back, or simply declined to participate were excluded. Four participants were excluded because they did not have a driving licence. This resulted in a sample of 295 participants, comprising 182 females (62 per cent) and 113 males. It was decided to categorise ages into three groups: there were 101 participants aged 61–65 years, 106 aged 66–70 years and 88 aged at least 71 years. A truly random sample of drivers would have had lower numbers in the 66–70 category than the 61–65 category, and (based on figures in King et al. Reference King, Soole, Watson and Schramm2011) about as many aged at least 71 years as aged 61–65 years. Among the females there were 66 aged 61–65 (mean 63.6), 65 aged 66–70 (mean 67.9) and 51 aged 71 or more (mean 75.7, range 71–87). Among the males there were 35 aged 61–65 (mean 63.8), 41 aged 66–70 (mean 68.4) and 37 aged 71 or more (mean 76.3, range 71–86). While it would have been desirable to split the oldest age group further, the limitations of panel size and response rate, combined with the use of gender as a variable, did not make this feasible.
Questionnaire development and data collection
A questionnaire was developed, and included questions exploring:
-
• Number of hours per week travelled as a driver, as a passenger and as a pedestrian (time was chosen rather than kilometres as trip distance is related to mode, i.e. trips by car are typically for longer distances than trips on foot; walking time covered all walking on a footpath or road, including walking for exercise).
-
• Number of days per week driven on average (this item was added to take account of previous findings that overall driving time might decrease due to shorter trips rather than less travel occasions).
-
• When driving, the proportion of time they are the only person in the vehicle (expected to reflect gender differences due to life expectancy and marriage age differences).
-
• Preferred mode of vehicle travel (drive self, be driven or public transport/taxi).
The questionnaire was piloted with ten drivers who did not form part of the larger study sample, and the final instrument was administered by telephone by a trained research officer who was skilled in interacting with older people.
Data coding and analysis
Data were recorded manually on to hard copy forms, followed by data entry into the Statistical Package for the Social Sciences (SPSS) version 18. Analysis involved chi-square tests and analysis of variance (ANOVA), depending on the type of data, with significant ANOVAs (p < 0.05) being followed by individual t-test comparisons. In all cases, because of the a priori expectation that results would vary by gender, tests of overall effects were followed by tests conducted separately for males and females.
Results
Mode of travel by age group, full sample
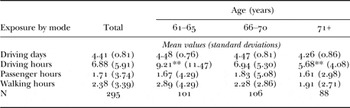
Table 1 contains a summary of the results for self-reported exposure by mode and age group for the full sample (not broken down by gender). The number of days driven does not change with age, though the number of hours driven declines significantly (significant comparison: 9.21 hours driven per week at ages 61–65 versus 5.68 hours driven per week at 71+, p < 0.01 with Bonferroni adjustment). This implies that there is a shift to shorter trips; while comparisons involving the 66–70 year group were not significant, it is worth noting that hours driven per week in this group (6.94) is closer to the driving hours of the older age group than the younger age group. Overall, there is little change with age group in the number of hours as a passenger (1.61–1.83 hours per week) or a pedestrian (1.91–2.89 hours per week), both of which show much lower levels of travel than driving. This means that the decline in time spent driving is not compensated for by time spent as a passenger or walking.
Self-reported exposure (weekly), by mode and participant age

Note: Analyses compared means of the Likert scores via analysis of variance.
Significance level for pairwise comparison - see text: ** p < 0.01.
Mode of travel by age group, females versus males
For each of the exposure categories in Table 1, comparisons were made separately by gender. The means for each age group and gender are presented in the figures, and the significant results are reported in the text.
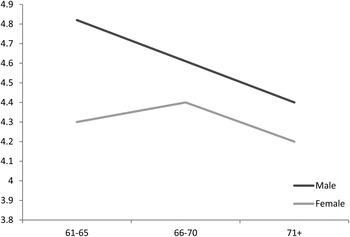
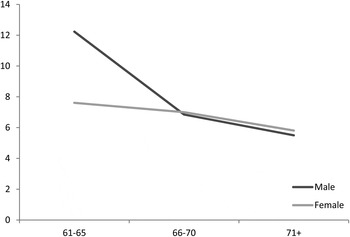
Overall, males drive more days than females (4.59 versus 4.30 days per week, p < 0.05) though there is no difference in hours driven per week overall by males and females (8.08 versus 6.88). Figure 1 indicates that most of the decline in driving days is accounted for by a drop in male driving. While the number of days driven by males declines (significant comparison: 4.82 days driven per week for age 61–65 versus 4.35 days driven per week at age 71+, p < 0.05 with Bonferroni adjustment), the difference in driving hours by gender is quite marked (Figure 2) in spite of the lack of difference at an aggregate level [significant comparison: 12.23 hours driven per week for males aged 61–65 versus 5.50 hours driven per week at age 71+, p < 0.05 with Bonferroni adjustment; note that the comparison between the 61–65 group and the 66–70 group (6.85 hours per week) approached significance]. There were no significant differences between age groups for female drivers, and from 66–70 years onwards, male and female driving time per week is similar.
Days driven each week by age group and gender.

Hours driven each week by age group and gender.

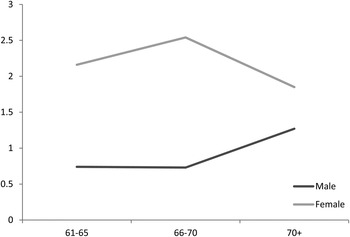
Figure 3 presents a more complex picture, although there are few statistically significant differences. Overall, males spend less time as a passenger than females (0.91 versus 2.21 hours per week, p < 0.05). Males spend little time as a passenger each week compared to driving up to age 70 (about 45 minutes per week, compared with 7–12 hours as a driver) but increase their time as a passenger from age 71 onwards, though it still remains low (approximately 1 hour 15 minutes compared with almost 6 hours as a driver). For women, travel as a passenger declines for those aged 71 or more (from around 2 hours 30 minutes to approximately 1 hour 50 minutes per week), at the same time that their driving declines (from around 7 hours 35 minutes per week at ages 61–65, to 7 hours at 66–70, to 5 hours 50 minutes at 71 and over).
Hours as a passenger each week by age group and gender.

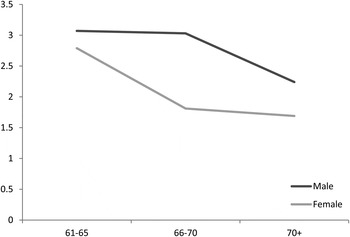
Figure 4 shows that levels of walking are relatively low – much lower than driving – and show a non-significant tendency to decline with age for both men and women. Overall, men walk about 2 hours 50 minutes per week (declining with age from 3 hours 5 minutes at ages 61–65, to 3 hours at 66–70, to 2 hours 15 minutes at 71 and older) while women walk 2 hours 15 minutes per week (declining with age from 2 hours 45 minutes to 1 hour 50 minutes at ages 66–70 years, to 1 hour 40 minutes at 71 years and older).
Hours walked each week by age group and gender.

Preferred motorised travel mode
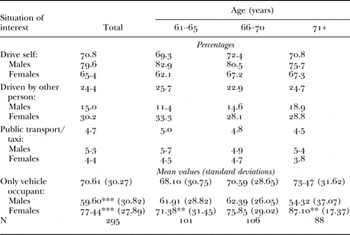
Table 2 presents a breakdown by age and gender of preferred motorised travel mode (drive self, be driven by someone else or take public transport/taxi) and also the proportion of time spent as the only vehicle occupant (i.e. as a single driver).
Self-reported preferred transport mode, by participant age and gender

Notes: N = 295 (113 males, 182 females). Analyses compared proportions of each mode via chi-square.
Significance levels for pairwise comparisons - see text: ** p < 0.01,*** p < 0.001.
The data for preferred mode show no difference by age, and the differences between males and females were not significant. Across all age groups, approximately 80 per cent of men and 65 per cent of women prefer to drive themselves. Approximately 5 per cent of men and 30 per cent of women prefer to be driven by someone else, which is consistent with gender roles in these age groups that result in male members of a couple being more likely to drive than female members when both are in the vehicle. Notably, the number of men preferring to be driven forms a larger percentage with age (increasing from 11.4% at ages 61–65, to 14.6% at 66–70, to 18.9% at 71 and older). Preference for public transport/taxi travel was very low, at approximately 5 per cent for men and 4 per cent for women.
When asked what proportion of their driving takes place as a single driver, females reported a significantly higher proportion (77.44% versus 59.60% for males). For males there was no difference by age group, but for females there was a significant increase [significant comparison: 71.38% in travel undertaken as a single driver for females aged 61–65 versus 87.10% at 71+, p < 0.01 with Bonferroni adjustment; note that the comparison between the 61–65 group and the 66–70 group (75.85%) approached significance]. It is also worth noting that approximately 30% of women aged 71 years or more prefer to be driven by another person, yet for this age group approximately 87 per cent of driving was undertaken alone.
Discussion
In-vehicle mobility declines with age and is not compensated for by an increase in walking – instead, mobility drops with age for all modes except the oldest males, who show a non-significant increase in travel as a passenger. However, the apparent shift to shorter driving trips (since driving time decreases, but number of days of driving does not) may reflect a realignment of mobility objectives (such as social and shopping trips) towards closer destinations.
The high amount of driving reported by the participants, in comparison with travel as a passenger or walking, is noteworthy. On average, this sample spent almost 7 hours per week driving, approximately 1.5 hours as a passenger and approximately 2.5 hours walking. This is roughly consistent with data reported by Zeitler and Buys (Reference Zeitler and Buys2015), although they only had travel information for 13 participants and it was reported in terms of kilometres rather than time. In other Australian research reported recently, older pedestrians were interviewed in three locations in Sydney, Australia's largest city (Gorrie, Larsen and Waite Reference Gorrie, Larsen and Waite2013). As in the current study, Gorrie, Larsen and Waite's sample reported fewer trips and less time spent walking with age, though this effect did not appear until over the age of 75 years. The number of hours walked was much greater in the Sydney study: weekly walking time was greater than five hours for more than half of the oldest age group (aged 85–96 years) rising to around 85 per cent for those aged less than 75 years, whereas in the current study the average time spent walking each week ranged from two to three hours, depending on age and gender. However, the nature of Gorrie, Larsen and Waite's sampling meant that people who walked more would have been over-sampled, and the sample may have had a high proportion of non-drivers; unfortunately, licence status was not one of the items surveyed (C. Gorrie, personal communication). Earlier UK data on mobility by age reported by Banister and Bowling (Reference Banister and Bowling2004) show much less driving being done than in the current sample, though this might be because the current sample is restricted to licensed drivers, and because Queensland is a far more car-dependent setting.
From a health perspective, the levels of walking may be a concern, unless other forms of physical activity are being undertaken. Woodward et al. (Reference Woodward, Lu, Levandowski, Kostis and Bachmann2015) conducted a systematic review of exercise guidelines for older adults, noting a lack of definitive advice; they refer instead to the World Health Organization recommendation of at least 150 minutes (2.5 hours) weekly of moderate-intensity exercise (e.g. brisk walking). In this study, males aged over 70 and females aged 66 or more reported lower average walking time, and even for the groups with higher averages it is unlikely that all of the reported walking could be classed as moderate-intensity. There was no indication that the drop in driving that occurred with age was offset by increases in walking, or to some extent travel as a passenger. While there is existing evidence that the health reasons that lead to driving cessation also mean that walking and travel on public transport are more difficult, this study was restricted to people who still had a driver's licence. If, in addition to the health benefits of physical activity, it is considered important for mental health for older people to maintain their mobility in terms of physical movement across the transport system in a car-dependent geographical context like Brisbane, then both the decline in driving with age and the lack of a compensatory increase in other travel need to be addressed. For example, instead of focusing on programs that are aimed at facilitating the transition to non-driving (such as the UQDRIVE programme evaluated by Liddle et al. Reference Liddle, Haynes, Pachana, Mitchell, McKenna and Gustafsson2014), it may be better to focus on programmes that presume older people will continue to drive and that view physical movement across the transport system holistically as a function that can be shared between different travel modes. This kind of programme would also serve as a means of transitioning to being without a driver's licence, but more as a side-effect rather than as an explicit goal.
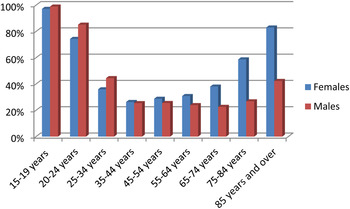
Gender emerges as an important issue, though there were sample size limitations on the degree to which this could be explored. The high decline in male driving after 61–65 years might be accounted for by cessation of employment. The data for females is of more interest. Figure 5 indicates that there is an accelerating increase in the proportion of unmarried women in Australia from 65 years of age onwards. The decline in hours as a passenger for women over 70 years might be accounted for by this change, as they are less likely to have a partner who can drive them. This interpretation is supported by data in Table 2, which indicate that females are significantly more likely to be the only vehicle occupant (77.4% versus 59.6% of males) with the disparity increasing with age – in the 71 years and older age group, 87 per cent of females are the only vehicle occupant, compared with 54 per cent of males. It is worth noting that approximately 30 per cent of women aged 71 years or more prefer to be driven by another person, but 87 per cent of their driving is undertaken alone. While the counting bases for the two figures are different, it suggests that a substantial proportion of women over 70 years old drive alone out of necessity rather than choice, and would prefer to be driven.
Percentage of people not married by age group, Australian Census 2011.

The non-significant decline in females travelling as passengers with age (Figure 3) is not matched by an increase in driving (Figure 2). This has some broad similarity to the findings of Stjernborg, Emilsson and Stahl (Reference Stjernborg, Emilsson and Stahl2014), who report Swedish pre/post-research into the impact of loss of a partner in the previous two years on mobility. They found that about half (55%) experienced no change in mobility, but the proportion with decreased mobility (32%) was more than double the proportion who experienced an increase (13%). Stjernborg, Emilsson and Stahl further note that this group of older people have been little researched in terms of mobility and health.
Ziegler and Schwanen (Reference Ziegler and Schwanen2011) found that, as in other research, loss of a driver's licence can have a profound effect on wellbeing. In car-dependent settings like Queensland, where we can expect the majority of older people will remain licensed into their eighties, it appears that physical movement across the transport system is likely to be dominated by travel as a driver. This points to a need to keep people driving for as long as possible, or alternatively, in considering transition to non-driving, a focus on the psychological impacts of the shift rather than the mobility impacts. However, drivers are at increasing risk of fatality or serious injury as they age, and are overwhelmingly considered to be at fault in their crashes (Rakotonirainy et al. Reference Rakotonirainy, Steinhardt, Delhomme, Darvell and Schramm2012). Findings emerging from the OzCanDrive study show that older drivers with lower average mileage tend to have higher crash rates (Langford et al. Reference Langford, Charlton, Koppel, Myers, Tuokko, Marshall, Man-Son-Hing, Darzins, Di Stefano and Macdonald2013), which implies that the decrease in mobility observed with age in this study flags an increased crash risk. However, Coxon et al. (Reference Coxon, Chevalier, Lo, Ivers, Brown and Keay2015) found that most drivers over 75 years drove close to home, regardless of function, with a limited number of better-functioning drivers accounting for longer mileages. Any measures that seek to make it possible for older drivers to drive for longer need to address the factors that contribute to any enhanced risk related to ageing, and public perceptions regarding liability.
Limitations of the research
In order to keep questionnaire administration time short, this research sought relatively simple information regarding hours spent travelling by mode, and did not conduct a detailed survey of trips and trip purpose. Specific information on marital status was not requested, and such information would be useful in future research. It would also have been useful to survey other forms of ‘mobility of the self’ to address a broader view of mobility; however, a decision was taken to focus on physical movement across the transport system because of the clearer data on the link between this form of mobility and health outcomes. The quantitative approach meant that the meaning attached to mobility was not sought, whereas supplementary information on this would have been informative (Mollenkopf, Hieber and Wahl Reference Mollenkopf, Hieber and Wahl2011). This is revisited in the next section.
The definition of older driver used here (over 60 years) corresponds to the official definition of the Department of Transport and Main Roads, but does not address the ‘oldest old’, i.e. those aged 85 years or more. Data from King et al. (Reference King, Soole, Watson and Schramm2011) indicate that only about 2.5 per cent of drivers aged over 60 would fall in the ‘oldest old’ category, which would have represented about eight for the sample of 295 if it had been truly random (the actual figure was six), too small for any meaningful conclusions. Given that this category will grow rapidly in the future, it would be desirable to study a large sample of ‘oldest old’ drivers.
Further research needs
The focus on older drivers making a transition to non-driving has received a high degree of attention in the research, however, in car-dependent settings there is a need for further research into the mobility of older drivers who continue to drive. This group is growing and, with population ageing, will become an increasingly important group in terms of mobility and health. It is clear that the gender of the older adult is a significant factor, and the linking of social and gender roles with mobility mode needs to be further explored. In successive cohorts there will be an increase in the proportion of females who have always been drivers, and the longer life expectancy of females in conjunction with the lower average female age in couples implies that there will be many more women driving alone. At present, older women appear to be driving alone more often than they would prefer, and it is unclear whether successive cohorts will see a change in this preference.
Ziegler and Schwanen (Reference Ziegler and Schwanen2011) argue that confining the concept of mobility for older people to physical movement across the transport system is too narrow and ignores the essence of mobility as a social, rather than an individual, activity that involves engagement of the person with others. Viewed in this way, physical movement across the transport system is a means to an end, and the same ‘mobility of the self’ can be achieved through telephone calls, use of social media and being visited by others rather than visiting them. Approaching mobility as a social issue also has implications for the broader wellbeing of older adults; recent research suggests that social exclusion contributes to mental health problems such as depression, which further contributes to social exclusion (Pate Reference Pate2014). The role of mobility as physical movement across the transport system compared with broader ‘mobility of the self’ needs to be explored further, from both a social perspective (i.e. can physical movement across the transport system be replaced by other forms of mobility such as social media while achieving the same social objectives?) and a health perspective (i.e. does a shift from physical movement across the transport system to other forms of mobility have beneficial health impacts, or does it foster a reduction in physical activity?).
Acknowledgements
Annette Deppe conducted the interviews and entered the data. Ides Wong assisted in preparation of the draft questionnaire and ethics application. Dale Steinhardt assisted with access to the InSPiRS database. This research was partially funded by a grant from Trust Company Philanthropic Services. The second author was supported by a National Health and Medical Research Council (NHMRC) Research Fellowship. The granting bodies played no role in the design, execution, analysis and interpretation of data, or writing of the study. This research received ethical clearance from the Queensland University of Technology Human Research Ethics Committee (reference 0900001404). Mark King oversaw all aspects of the research and prepared most of the manuscript. Bride Scott-Parker conducted the analyses and provided input into the discussion and interpretation of the results. There are no conflicts of interest.