1. Introduction
Condensed-phase explosives have long been known to exhibit a detonation velocity dependence with charge scale. Experiments in cylindrical and slab geometries have previously been used to study this effect and determine its dependence on both charge scale and shape. Despite these efforts, the physics governing the variation of detonation velocity for different geometries is not fully understood.
1.1. The size effect
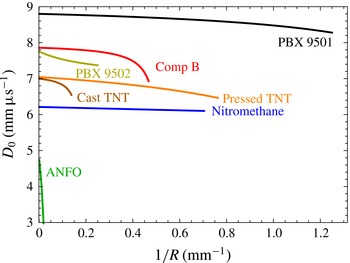
The influence of charge size on detonation velocity in a high explosive (HE) is generally measured in cylinders of constant diameter. This ‘rate-stick’ geometry generates a steady detonation when the cylinder is of sufficiently large aspect ratio. By performing tests at multiple diameters, it is observed that the explosive detonation velocity decreases monotonically with decreasing radius (Campbell & Engelke Reference Campbell and Engelke1976), as shown in figure 1. This ‘diameter-effect’ relationship is commonly plotted as axial detonation velocity
 $(D_{0})$
versus inverse charge radius
 $(1/R)$
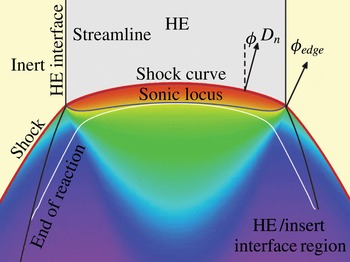
. It is due to lateral expansion of high-pressure reaction zone gases, the pressure of which (ranging from a few GPa in non-ideal HEs to a few tens of GPa in ideal HEs) exceeds the strength of any confining material. The expansion leads to streamline divergence in the reaction zone and a curved detonation shock as shown in figure 2. The energy balance between the detonation shock and the sonic plane influences the detonation speed (Bdzil Reference Bdzil1981). As the charge radius decreases, more energy is lost to streamline divergence, while the curved sonic plane progresses towards decreasingly reacted states. These effects reduce the chemical energy available to drive the detonation shock, leading to the manifestation of lower detonation velocities at smaller charges. There are two limiting cases; steady detonation propagation is not possible below a critical failure diameter
 $2R_{c}$
, whereas for infinite-radius charges the flow is one-dimensional and the detonation propagates at the Chapman–Jouguet (CJ) detonation velocity.
The diameter effect for several HEs with no confinement: the curves for PBX 9501, PBX 9502 and ANFO are from works cited in tables 3, 6 and 8; the others are from Campbell & Engelke (Reference Campbell and Engelke1976).

Curvature on the detonation shock induced by radial flow expansion into the reaction zone; the colouring of postshock flow indicates relative pressure, with low-pressure flow in blue and high-pressure flow in red. Figure adapted from Bdzil et al. (Reference Bdzil, Aslam, Henninger and Quirk2003).

The quantitative aspects of the diameter-effect curves, including their level of concavity and
 $R_{c}$
, differ with explosive formulation, microstructure and reaction kinetics. The sum of these effects cannot currently be predicted a priori. Despite this limitation, coarse classifications exist based on the relative lengths of each explosive’s CJ detonation reaction zone and its diameter-effect variation over engineering scales. Ideal explosives, such as cyclo-tetramethylene-tetranitramine (HMX), have short reaction zone lengths of order
 $0.1~\text{mm}$
and are observed to have small variations in detonation velocities from the CJ speed over a wide range of charge diameters. Insensitive high explosives, such as 2,4,6-triamino-1,3,5-trinitrobenzene (TATB), exhibit two disparately sized zones of heat release that combine for an overall reaction zone size of order
 $1~\text{mm}$
, a more pronounced diameter effect (i.e. steeper slope on
 $D_{0}$
versus
 $R^{-1}$
plots) and a larger failure diameter. Non-ideal HEs, such as prilled ammonium nitrate and fuel oil (ANFO), typically have reaction zone lengths on the scale of centimeters, i.e.
 $\mathit{O}(10~\text{mm})$
, very strong diameter effects and very large failure diameters.
Rectangular slabs are sometimes used as a second fundamental geometry for analysis of the dependence of detonation velocity with charge size. Slabs exhibit analogous behaviour to rate sticks, but can be used to generate two-dimensional reaction zone flow (detailed in § 2). These slab reaction zones expand laterally only in the thickness dimension, in contrast to the two-dimensional (radial and azimuthal) expansion for the rate stick. Because of this geometric effect, less reaction zone energy is lost to flow divergence for a given slab thickness
 $T$
as compared to a rate stick with equivalent radius
 $2R=T$
; as a result, slabs exhibit a higher detonation velocity relative to comparably sized rate sticks. While not explicitly named previously, we refer to the detonation-velocity dependence with inverse slab thickness as the ‘thickness effect’, the combined diameter- and thickness-effect relationships as the ‘size effect’ and the critical slab thickness as
 $T_{c}$
.
1.2. Prior scaling measurements
For a given HE, we define the steady propagation scale factor
 $R(D_{0})/T(D_{0})$
as a comparison of the rate-stick radius and slab thickness that give the same detonation velocity in the two geometries (for the same confinement conditions). We also define the critical scale factor
 $R_{c}/T_{c}$
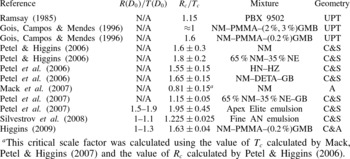
as the ratio of the critical radius and critical thickness in the cylinder and slab geometries, respectively. The variation of these scale ratios for a variety of explosives, as well as the implications for detonation dynamics in different geometries, has received much attention recently and forms the motivation for the current paper. Previously measured scale factors for steady detonation propagation and failure are summarized in table 1. The scope of prior work is limited, with only nine formulations having been studied by four research groups. These formulations span a range of detonation behaviour, from homogeneous liquids with relatively flat diameter-effect curves, to heterogeneous plastic-bonded explosives with moderately sloped diameter-effect curves, to non-ideal emulsion explosives with steep diameter-effect curves. Most of the studies were equipped with a witness plate diagnostic to measure
 $R_{c}/T_{c}$
, while
 $R(D_{0})/T(D_{0})$
was reported for only three emulsion explosives. Additionally, most experiments did not monitor the detonation front for the occurrence of transverse instabilities, which have been observed to occur in liquid and liquid-emulsion explosives (Engelke & Bdzil Reference Engelke and Bdzil1983). The presence of such instabilities would both alter the detonation physics from that described in §§ 1.1 and 3 and also probably affect any scale-factor measurements.
Summary of prior work (
 $\text{AN}=\text{ammonium}$
nitrate,
 $\text{DETA}=\text{diethylenetriamine}$
,
 $\text{GB}=\text{glass}$
beads,
 $\text{GMB}=\text{glass}$
microballoons,
 $\text{HN}=\text{hydrazine}$
nitrate,
 $\text{HZ}=\text{hydrazine}$
,
 $\text{NM}=\text{nitromethane}$
,
 $\text{NE}=\text{nitroethane}$
; the geometries are
 $\text{UPT}=\text{unsteady}$
prism test,
 $\text{C}\& \text{S}=\text{cylinder}$
and slab,
 $\text{A}=\text{annulus}$
,
 $\text{C}\& \text{A}=\text{cylinder}$
and annulus).

 $^{a}$
This critical scale factor was calculated using the value of
 $T_{c}$
calculated by Mack, Petel & Higgins (Reference Mack, Petel, Higgins, Elert, Furnish, Chau, Holmes and Nguyen2007) and the value of
 $R_{c}$
calculated by Petel & Higgins (Reference Petel, Higgins, Furnish, Elert, Russell and White2006).
Ramsay (Reference Ramsay1985) evaluated
 $T_{c}$
of PBX 9502 under both confined and unconfined conditions using a ‘prism test’, involving a wedge-shaped cuboid of PBX 9502 initiated with a line wave generator (Jackson, Austin & Shepherd Reference Jackson, Austin and Shepherd2006; Morris, Jackson & Hill Reference Morris, Jackson, Hill, Elert, Buttler, Furnish, Anderson and Proud2009) at one trapezoidal face. A witness plate on the opposing face was dented if detonation successfully transited the wedge. This geometry was intended to be used to evaluate a range of explosive thicknesses in a single test, as opposed to fielding multiple slab tests. At room temperature, Ramsay (Reference Ramsay1985) found a critical prism thickness of 3.8 mm. Comparison with the cylindrical data of Campbell & Engelke (Reference Campbell and Engelke1976) yielded
 $R_{c}/T_{c}=1.15$
. Given the inherent unsteadiness of the test design, this value is likely to be an overestimate: detonation will travel at a higher velocity in thicker regions of the wedge, overdriving and delaying incipient failure in adjacent thinner regions. Additionally, the short detonation run length (50 mm) may have been insufficient for the detonation to relax from any booster overdrive to steady propagation. For these reasons, Ramsay (Reference Ramsay1985) noted that the prism provided only a preliminary estimate of
 $T_{c}$
, which could be improved with constant-thickness slab tests.
Gois et al. (Reference Gois, Campos, Mendes, Schmidt and Tao1996) also performed prism tests to measure
 $T_{c}$
for emulsion explosives composed of nitromethane (NM) with small concentrations of glass microballoons (GMBs) and dissolved PMMA. The dissolved PMMA sufficiently increases the mixture viscosity to suspend the GMBs, which increase the sensitivity of the mixture. Gois et al. (Reference Gois, Campos, Mendes, Schmidt and Tao1996) measured a critical scale ratio
 $R_{c}/T_{c}$
that was close to unity for 2 % and 3 % GMB concentrations, compared to previous tests (Gois, Presles & Vidal Reference Gois, Presles, Vidal, Kuhl, Leyer, Borisov and Sirignano1991) in the cylindrical geometry. For 3 % GMB concentration,
 $R_{c}/T_{c}<1$
; but for 2 % GMB concentration,
 $R_{c}/T_{c}>1$
. For 1 % GMB concentration,
 $R_{c}/T_{c}\approx 0.7$
; however,
 $R_{c}/T_{c}$
abruptly increased to 1.6 for very low GMB concentrations of 0.2 %. Like Ramsay (Reference Ramsay1985), Gois et al. (Reference Gois, Campos, Mendes, Schmidt and Tao1996) probably overestimated
 $R_{c}/T_{c}$
due to the prism geometry.
Petel & Higgins (Reference Petel, Higgins, Furnish, Elert, Russell and White2006) reported the critical radius and thickness of two liquid explosive mixtures, pure NM and a blend of 65 % NM and 35 % nitroethane (NE) by mass, under aluminium confinement. They measured
 $R_{c}/T_{c}$
values of 1.6 and 1.8 for the NM and NM–NE mixtures, respectively. Note, however, that the detonation velocities of pure NM and NE are approximately 6.2 and
 $5.4~\text{mm}~{\rm\mu}\text{s}^{-1}$
, respectively (Engelke & Bdzil Reference Engelke and Bdzil1983; Yoshinaka & Zhang Reference Yoshinaka, Zhang, Furnish, Gupta and Forbes2004), while the longitudinal sound speed of the confining aluminium alloy is
 $6.4~\text{mm}~{\rm\mu}\text{s}^{-1}$
. If the detonation velocity is lower than the confiner sound speed, the flow in the confiner becomes subsonic and shockless. Precursor waves in the confiner can then be driven ahead of the detonation (Sharpe & Bdzil Reference Sharpe and Bdzil2006; Jackson, Kiyanda & Short Reference Jackson, Kiyanda and Short2011; Short & Jackson Reference Short and Jackson2015), potentially influencing both the detonation propagation speed and the failure process (Short et al.
Reference Short, Quirk, Kiyanda, Jackson, Briggs and Shinas2010).
Mack et al. (Reference Mack, Petel, Higgins, Elert, Furnish, Chau, Holmes and Nguyen2007) performed critical thickness experiments with pure NM in an annular channel confined by an inner aluminium rod and an outer aluminium tube. Mack et al. (Reference Mack, Petel, Higgins, Elert, Furnish, Chau, Holmes and Nguyen2007) argue that for an annular channel thickness much less than the annular radius, the axisymmetric component of curvature is negligible. They measured a critical thickness of
 $1.45\pm 0.15~\text{mm}$
, a factor of two larger than their group’s previous
 $T_{c}$
measurement of
 $0.75\pm 0.1~\text{mm}$
. They proposed that Petel & Higgins (Reference Petel, Higgins, Furnish, Elert, Russell and White2006) may not have allowed the detonation to propagate for a sufficiently long distance in either the slab or the cylindrical geometry (
 ${>}10$
aspect ratio) to quantify detonation failure. In addition, an estimate for the magnitude of the axisymmetric curvature component in the annulus was not given. A non-negligible axisymmetric curvature component could cause an increase in the calculated value of
 $T_{c}$
relative to the 2-D slab geometry. As with their previous study, precursor motion in the aluminium confiner may also be present. Using the
 $R_{c}$
value for pure NM from Petel & Higgins (Reference Petel, Higgins, Furnish, Elert, Russell and White2006) together with the new critical thickness
 $T_{c}=1.45\pm 0.15~\text{mm}$
gives a revised critical scale factor of
 $R_{c}/T_{c}=0.81\pm 0.15$
.
Petel et al. (Reference Petel, Mack, Higgins, Turcotte and Chan2006, Reference Petel, Mack, Higgins, Turcotte and Chan2007) performed rate-stick and slab tests with four explosive formulations: (i) a 65 % NM and 35 % NE mixture sensitized with solid glass beads (GBs); (ii) an ammonium nitrate and aluminium flake-based commercial blasting emulsion called Apex Elite manufactured by Orica Mining Services; (iii) a NM mixture sensitized with diethylenetriamine (DETA) and GBs; and (iv) a mixture of hydrazine nitrate (HN) and hydrazine (HZ). The slab geometry used by Petel et al. (Reference Petel, Mack, Higgins, Turcotte and Chan2006, Reference Petel, Mack, Higgins, Turcotte and Chan2007) was similar to that used by Petel & Higgins (Reference Petel, Higgins, Furnish, Elert, Russell and White2006). Aluminium confinement was used for the NM–NE–GB and HN–HZ mixtures, whereas the NM–DETA–GB explosive was confined by glass and the Apex Elite by PMMA. While
 $R_{c}/T_{c}$
was measured for all explosives,
 $R(D_{0})/T(D_{0})$
was measured only for Apex Elite. For the NM–NE–GB mixture,
 $R_{c}/T_{c}$
was
 $1.15\pm 0.05$
. For the NM–DETA–GB mixture,
 $R_{c}/T_{c}$
was
 $1.65\pm 0.15$
. For the HN–HZ mixture,
 $R_{c}/T_{c}$
was
 $1.55\pm 0.15$
. For Apex Elite,
 $R_{c}/T_{c}$
was
 $1.95\pm 0.45$
while
 $R(D_{0})/T(D_{0})$
ranged from 1.5 to 1.9, with the scale factor increasing as
 $D_{0}$
decreased.
Subsequently, Silvestrov et al. (Reference Silvestrov, Plastinin, Karakhanov and Zykov2008) also performed rate-stick and slab tests with an ammonium nitrate-based emulsion explosive. They measured
 $R_{c}/T_{c}=1.225\pm 0.025$
and
 $R(D_{0})/T(D_{0})=1$
–1.1. Finally, Higgins (Reference Higgins, Elert, Buttler, Furnish, Anderson and Proud2009) evaluated the geometric scaling for the lowest-GMB-concentration mixture (NM–PMMA–(0.2 wt%) GMB) tested by Gois et al. (Reference Gois, Presles, Vidal, Kuhl, Leyer, Borisov and Sirignano1991). The experimental geometries tested were cylindrical rate sticks and annular channels similar to those used in Mack et al. (Reference Mack, Petel, Higgins, Elert, Furnish, Chau, Holmes and Nguyen2007) but with PVC confinement. Higgins (Reference Higgins, Elert, Buttler, Furnish, Anderson and Proud2009) reported
 $R_{c}/T_{c}=1.63\pm 0.04$
and
 $R(D_{0})/T(D_{0})=1$
–1.3.
Citing the correlation between detonation velocity and shock curvature that had long been observed (Bdzil Reference Bdzil1981), Petel et al. (Reference Petel, Mack, Higgins, Turcotte and Chan2006, Reference Petel, Mack, Higgins, Turcotte and Chan2007), Silvestrov et al. (Reference Silvestrov, Plastinin, Karakhanov and Zykov2008) and Higgins (Reference Higgins, Elert, Buttler, Furnish, Anderson and Proud2009) suggested that curvature-based theories of detonation propagation and failure should predict scale factors where
 $R(D_{0})/T(D_{0})=1$
and
 $R_{c}/T_{c}=1$
. Their conjecture is based on the geometric observation that detonation in a cylinder experiences two orthogonal components of reaction zone flow expansion, whereas detonation in a slab expands only along a single axis. Under the assumption that all components experience equal curvature (which we address in § 3.1.2), they concluded that a cylinder and slab will have the same total curvature and detonation velocity when
 $R=T$
, hereafter referred to as the ‘
 $R=T$
scaling’. Scaling measurements deviating from unity (which encompass essentially all existing size-effect data) were then attributed to factors other than curvature dominating the physics of detonation propagation and failure.
1.3. Paper outline
We examine the variation of the scale factor
 $R/T$
for three characteristically different explosives by experimentally measuring their slab thickness effect (§ 2). Prior cylindrical diameter-effect data are then used to find the experimentally observed scaling between these two geometries. The experimental results are compared with predictions from two detonation shock dynamics (DSD) models (§ 3). A lower-order theory relates detonation velocity to front curvature, while a higher-order theory includes front acceleration and transverse flow terms. We show that lower-order theories are entirely consistent with the variable non-unity scale factors observed experimentally, because the orthogonal curvature components in the rate stick are not, in general, equal. The higher-order theory is required to describe the
 $R/T$
variation for ANFO. Finally, an asymptotic study is used to provide insight into the variation of the
 $R/T$
scale factor for detonation velocities approaching the CJ limit (§ 4).
2. Experiments
2.1. Slab test geometry
The rectangular slab configuration was initially proposed as a simple configuration to measure HE Gurney energy (Kennedy Reference Kennedy, Zukas and Walters1997) and has since been used to characterize interactions between explosives and various inert confiners (Eden & Wright Reference Eden and Wright1965; Eden & Belcher Reference Eden and Belcher1989; Hill & Aslam Reference Hill, Aslam, Furnish, Gupta and Forbes2004; Anderson, Aslam & Jackson Reference Anderson, Aslam and Jackson2014). It was also used by Collyer et al. (Reference Collyer, Dunnett, Swift and White1998) to measure thickness-effect curves and detonation shock shapes to derive a DSD calibration for the insensitive TATB-based explosive EDC35 (95/5 TATB/Kel-F wt%).
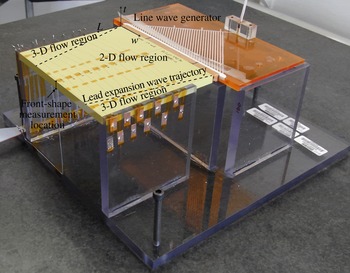
In this study, slab geometry experiments are designed to generate a region of quasi-steady two-dimensional flow, in which detonation velocities and front shapes can be measured. The slabs in the current study have no confinement, in order to match the previously obtained data on unconfined rate sticks. An example of the slab configuration (for PBX 9502) is shown in figure 3. The experiments consist of a large-aspect-ratio rectangular-cuboid HE main charge that is initiated by a high-precision detonation line wave generator. For PBX 9502 and ANFO, the wave is then transmitted to a rectangular-cuboid booster charge that is composed of an explosive with sufficient output strength to promptly initiate a linear detonation wave in the adjacent main charge. The detonation then propagates along the main charge to the front-shape measurement surface located at the centreline (across the thinnest dimension
 $T$
) of the output face. Time-of-arrival wires (or pins) track the phase velocity of the detonation along the charge centreline.
Test geometry for a PBX 9502 slab. The slab is initiated with a line wave generator and boosted by a rectangular cuboid of composition B. The dashed lines are illustrative of the path of the wavehead that propagates disturbances from the slab edges toward the slab centre, rendering the following flow three-dimensional. A spatially decreasing region of two-dimensional flow remains in the centre of the slab.

For a linear detonation input and a main charge of finite length, the charge will contain a region of two-dimensional flow as indicated in figure 3. The transition of the HE region to air at the sides of the charge creates rarefaction waves which propagate laterally into the HE, rendering the following flow three-dimensional. Nominally, we expect the disturbance wavehead to propagate along the shock at the local sound speed of the shocked reactants. However, using a small resolved heat release model in a 2-D configuration, Bdzil & Stewart (Reference Bdzil and Stewart1986) showed that the propagation of a two-dimensional disturbance from the edge of a charge consisted of a two-wave hierarchy. The main disturbance is carried in a region of parabolic flow connected to the edge of the charge. The parabolic flow region is connected to the region of one-dimensional undisturbed flow by a hyperbolic wave regime, whose wavehead amplitude is small. Consequently, significant modifications to the one-dimensional regime occur only with the arrival of the parabolic flow region. Bdzil & Davis (Reference Bdzil and Davis1975) contains a reference to unpublished experiments on unconfined Composition B rate sticks which indicate that the velocity of the laterally moving side rarefaction in the explosive is about
 $1/4$
of the detonation velocity. This is consistent with the study by Bdzil & Stewart (Reference Bdzil and Stewart1986). Experiments and analysis have also been performed by Jackson & Short (Reference Jackson, Short, Elert, Buttler, Borg, Jordan and Vogler2012) for PBX 9502 and by Chiquete, Jackson & Short (Reference Chiquete, Jackson and Short2014) for PBX 9501, which verified the presence of a large two-dimensional flow region at the downstream shock breakout surface for slab charges with similar aspect ratios to those in the present experiments. In the present work, main charge dimensions are selected such that a two-dimensional region is maintained over the time-of-arrival pin and front-shape measurement region.
The axial charge length in the direction of detonation propagation must also be sufficiently long that a steady two-dimensional detonation velocity can be achieved. Typically, this requires a length of several charge thicknesses
 $(T)$
to both damp out any booster overdrive or underdrive and allow the two-dimensional flow to be established. With a single exception (shot 8-1661), the experiments in this study had length-to-thickness ratios
 $L/T\geqslant 10$
. Thus, charges had to be as long as possible to achieve a steady-state velocity and as wide as possible to maintain a sufficient two-dimensional measurement region. For less-ideal detonations with larger reaction zones, these two considerations require very large charges compared to more sensitive formulations (detonations are considered ideal when the wavefront radius of curvature is significantly larger than the reaction zone length, i.e.
 $1/{\it\kappa}\gg \ell _{RZ}$
). This will be apparent in the relative test dimensions of each formulation presented below.
2.2. PBX 9501 slab experiments
Nine slab experiments were performed with the PBX 9501 formulation. PBX 9501 is a polymer-bonded explosive composed of 95.0 wt% HMX explosive crystals bonded with a binder mixture of 2.5 wt% Estane and a 2.5 wt% eutectic mixture of bis(2,2-dinitropropyl)acetal and bis(2,2-dinitropropyl)formal (BDNPA/BDNPF). PBX 9501 is considered to be a conventional HE with a spatially small reaction zone of
 $\mathit{O}(0.1~\text{mm})$
, a nominal detonation velocity
 $D_{0}$
of
 $8.8~\text{mm}~{\rm\mu}\text{s}^{-1}$
and a critical radius near 0.76 mm (Gibbs & Popolato Reference Gibbs and Popolato1980).
PBX 9501 slab experiments were boosted with a line wave generator composed of XTX-8003 (80 % PETN, i.e. pentaerythritol tetranitrate, and 20 % silicone resin, specifically Sylgard 182 elastomer). The line wave generator had an output width and a thickness of 157 and 3.2 mm, respectively. Due to the high shock sensitivity of PBX 9501, no additional boosting charge was used. The PBX 9501 main charges were approximately 130 mm in length and 150 mm in width, with thicknesses varying from 0.8 to 8.0 mm. Nominal densities were
 $1.83~\text{g}~\text{cm}^{-3}$
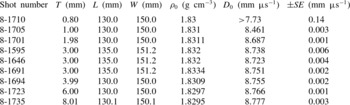
. Specific dimensions and densities are listed in table 2.
PBX 9501 slab experiment dimensions and thickness-effect data. PBX 9501 lot was HOL89C730-010; shots were fired at
 $22.5\pm 2.5\,^{\circ }\text{C}$
. Shot 8-1710 only indicates a minimum possible velocity due to non-planar initiation, as described in the text. Densities were measured with multiple instruments, which yielded varying significant figures as shown.

Ionization probes were used as the time-of-arrival diagnostic for the PBX 9501 test series. Each ionization probe consisted of a copper wire of 79.8
 ${\rm\mu}\text{m}$
diameter (40-AWG) that was located along the axial centreline of one face of the charge. The wires were bent into a chevron shape and oriented with the chevron tip along the axial charge centreline so that the detonation would first contact this tip. These wires were raised to an electrical potential of 75.0 V through use of an RC circuit. A single thicker copper grounding wire was located on the axial centreline of the opposing charge surface. Arrival of the ionization front associated with the detonation wave at each probe allowed current to flow from the high-voltage wire to ground, resulting in a measured voltage drop across the resistor in the RC circuit. Probe locations were measured to better than
 $30~{\rm\mu}\text{m}$
, and the pin voltage was sampled with a bandwidth of 1 GHz (
 $5~\text{GS}~\text{s}^{-1}$
sample rate) during each test.
For each test, either 11 or 22 ionization probes were used on the main charge. The first probe was located 30 mm from the upstream (initiating) end of the PBX 9501 charge. Subsequent probes were equidistantly spaced over the remaining distance to the downstream end of the charge, resulting in probe separation spacings of 9.1 mm. Probe position versus detonation arrival time data were fitted to a line using a least-squares fit optimization. The slope of the line was the steady-state detonation velocity
 $D_{0}$
. These velocities are reported in table 2 along with the standard error
 $(\mathit{SE})$
associated with the fit to
 $D_{0}$
.
As expected, the detonation velocity is seen to increase with slab thickness. Except for a single abnormally initiated test (described below), the standard error values were all less than
 $\pm 0.006~\text{mm}~{\rm\mu}\text{s}^{-1}$
, or 0.07 %
 $D_{0}$
, indicating that the detonation velocity is steady. The three repeat shots performed at an identical thickness of 3.00 mm exhibit a velocity range of
 $0.028~\text{mm}~{\rm\mu}\text{s}^{-1}$
, or 0.3 %
 $D_{0}$
. This range was likely influenced by charge density variations, which were present in the experiments.
The slab of thickness 0.8 mm was inadequately boosted by the line wave generator and initiated only at one corner. The resulting detonation expanded cylindrically across the charge. The
 $D_{0}$
value listed in table 2 was inferred from a series of framing camera images of the experiment, substantially increasing the
 $\mathit{SE}$
uncertainty relative to the ionization pin diagnostic. This result indicates that (i) the planar detonation velocity would probably have exceeded this cylindrically diverging detonation velocity, and (ii) the slab of thickness 0.8 mm required a stronger booster for successful initiation.
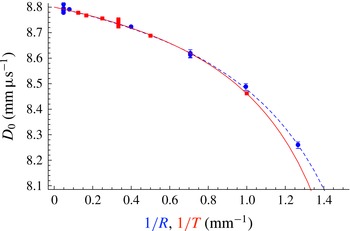
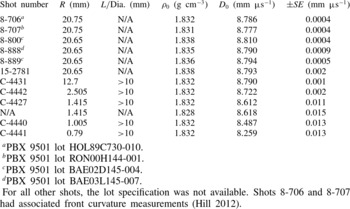
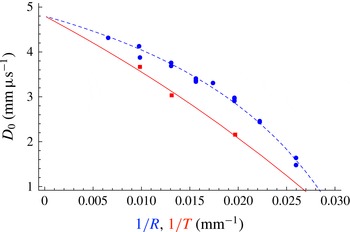
Table 3 contains historical data from rate-stick experiments in the cylindrical geometry that were recently compiled by Hill (Reference Hill2012). The cylindrical and slab rate-stick data are plotted against each other in figure 4. The horizontal axis represents the inverse charge radius
 $1/R$
or the thickness
 $1/T$
, so that the two geometries will overlay if the
 $R=T$
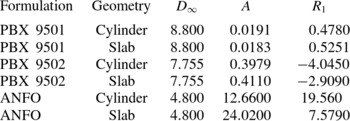
scaling, discussed in § 1, is satisfied. The data points indicate each experimental measurement. The curves shown were fitted to the experimental data using a modified form of the empirical Eyring equation (Campbell & Engelke Reference Campbell and Engelke1976),
 $$\begin{eqnarray}D_{0}(\ell )=D_{\infty }\left(1-\frac{A}{\ell -R_{1}}\right),\end{eqnarray}$$
where
 $D_{\infty }$
(the CJ detonation velocity),
 $A$
and
 $R_{1}$
are fitting parameters. The variable
 $\ell$
represents either the cylinder radius
 $R$
or the slab thickness
 $T$
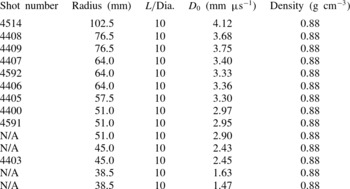
. For fitting to the slab thickness-effect and rate-stick diameter-effect PBX 9501 data in tables 2 and 3,
 $D_{\infty }$
is fixed for both geometries based on estimates of
 $D_{CJ}$
for PBX 9501 obtained previously at Los Alamos National Laboratory. The parameters
 $A$
and
 $R_{1}$
are then fitted using a least-squares approximation. PBX 9501 parameters for (2.1) are listed in table 4. Figure 4 shows the diameter- and thickness-effect curves resulting from the modified Eyring fitting form. Overall, the experimental PBX 9501 data is reasonably approximated by the
 $R=T$
scaling over the range of test conditions. For thicker charges (
 $R>1.25~\text{mm}$
and
 $T>1.25~\text{mm}$
) and higher detonation velocities (
 $D_{0}>8.55~\text{mm}~{\rm\mu}\text{s}^{-1}$
), agreement between the two geometries is excellent. Deviations exist only for the smallest (1.0 mm) slab that was properly initiated, where the detonation flow is less ideal due to increasing lateral expansion losses and lengthening reaction zone widths.
Size-effect data for PBX 9501. Blue circles and red squares denote experimental cylindrical rate-stick and slab test detonation velocities from tables 2 and 3. Blue dashed and red solid lines are modified Eyring form fits to the cylindrical and slab experimental data, respectively. Error bars are plotted for each symbol, but may be smaller than the symbol.

PBX 9501 diameter-effect data for cylindrical rate sticks. Data points are taken from a recent compilation by Hill (Reference Hill2012). The shots were taken approximately at room temperature; N/A means that record is not available.

 $^{a}$
PBX 9501 lot HOL89C730-010.
 $^{b}$
PBX 9501 lot RON00H144-001.
 $^{c}$
PBX 9501 lot BAE02D145-004.
 $^{d}$
PBX 9501 lot BAE03L145-007.
For all other shots, the lot specification was not available. Shots 8-706 and 8-707 had associated front curvature measurements (Hill Reference Hill2012).
Parameters for the modified Eyring fitting form curves (2.1).

2.3. PBX 9502 slab experiments
Nine slab experiments were performed with PBX 9502. PBX 9502 is a plastic-bonded explosive composed of 95.0 wt% TATB explosive bonded with 5.0 wt% Kel-F 800, which is a proprietary name for the thermoplastic chlorofluoropolymer polychlorotrifluoroethylene or PCTFE (Gibbs & Popolato Reference Gibbs and Popolato1980). PBX 9502 is an insensitive HE with a nominal detonation velocity of
 $7.8~\text{mm}~{\rm\mu}\text{s}^{-1}$
and a failure diameter near 8.0 mm. The PBX 9502 reaction zone structure is considered moderate in spatial scale, exhibiting both fast reactions of
 $\mathit{O}(0.1~\text{mm})$
and slower reactions of
 $\mathit{O}(1.0~\text{mm})$
.
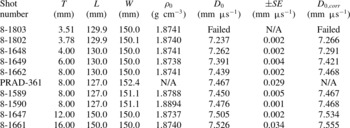
PBX 9502 slab experiments were boosted with segments of Composition B formed in rectangular cuboids that were 8.0 mm long by 150 mm wide with a thickness equivalent to that of the PBX 9502 main charge. The Composition B charge was detonated by the same type of line wave generator as used in the PBX 9501 tests. The PBX 9502 main charges were 127–150 mm in length and 150 mm in width, with thicknesses varying from 3.5 to 16.0 mm. Nominal densities were
 $1.87~\text{g}~\text{cm}^{-3}$
. Specific dimensions are listed in table 5.
PBX 9502 slab experiment dimensions and thickness-effect data. All slabs were manufactured from lot 008 material; shots were fired at
 $22.5\pm 2.5\,^{\circ }\text{C}$
;
 $D_{0}$
is the experimentally measured detonation velocity, and
 $D_{0,corr}$
is the detonation velocity after correction to an initial charge density of
 $1.886~\text{g}~\text{cm}^{-3}$
. The data for PRAD-361 are from Aslam, Jackson & Morris (Reference Aslam, Jackson, Morris, Elert, Buttler, Furnish, Anderson and Proud2009).

The ionization probes and velocity reduction method used with the PBX 9502 test series were identical in design to those used for the PBX 9501 tests. Interprobe spacings were also equivalent. The distance of the first probe from the upstream end of the main charge varied with charge length. For charges of 127–130 mm in length, this distance was 30 mm; for charges of 150 mm in length, it was 50 mm.
As with the PBX 9501 data, the PBX 9502 detonation velocity increases with both slab thickness and slab initial density. Standard error values were all less than
 $\pm 0.005~\text{mm}~{\rm\mu}\text{s}^{-1}$
, or 0.07 % of
 $D_{0}$
, indicating that the detonation velocity is steady. The three repeat shots performed at an identical thickness of 8.00 mm exhibit a velocity range of
 $0.037~\text{mm}~{\rm\mu}\text{s}^{-1}$
, or 0.5 % of
 $D_{0}$
, which, as discussed below, is dependent on the density of each charge. Framing camera images show that the charge of thickness 3.50 mm was properly boosted but failed a short distance downstream, indicating that the PBX 9502 slab was not able to support 2-D detonation at this thickness.
2.3.1. PBX 9502 density-adjusted velocities
The PBX 9502 data in table 5 exhibit a range of density variation that is four times larger than that present in the PBX 9501 data (
 ${\rm\Delta}{\it\rho}_{9502}=0.0157~\text{g}~\text{cm}^{-3}$
versus
 ${\rm\Delta}{\it\rho}_{9501}=0.0035~\text{g}~\text{cm}^{-3}$
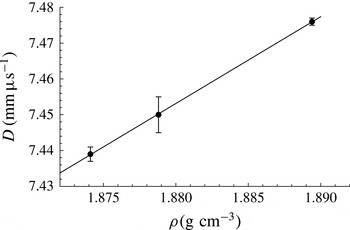
). These variations can have a significant effect on the detonation velocity for each test, making it worthwhile to correct for them. Initial explosive density affects the detonation velocity by varying the available energy release per unit volume of explosive. The exact manner in which the diameter- and thickness-effect curves vary with initial charge density is unknown and likely to depend nonlinearly on charge geometry and scale. To leading order, however, we assume a linear relationship between charge density and detonation velocity. The three rate sticks with slab thickness 8.0 mm, namely 8-1589, 8-1590 and 8-1662, allow determination of this relationship for the PBX 9502 slab tests. Figure 5 plots the detonation velocity versus charge density for these tests. A linear least-squares fit to the three data points yields
 $D_{0}=2.424{\it\rho}+2.896$
, with a standard error of
 $0.026~(\text{mm}~{\rm\mu}\text{s}^{-1})/(\text{g}~\text{cm}^{-3})$
associated with the linear slope. (Performing a similar fit across all tests except the 16 mm one yields a value of
 $2.52~(\text{mm}~{\rm\mu}\text{s}^{-1})/(\text{g}~\text{cm}^{-3})$
.) The linear slope of
 $2.424~(\text{mm}~{\rm\mu}\text{s}^{-1})/(\text{g}~\text{cm}^{-3})$
can be used to adjust the experimentally measured detonation velocities to the expected velocity at a uniform density. In the last column of table 5, we report detonation velocities corrected to a density value of
 $1.886~\text{g}~\text{cm}^{-3}$
as
 $D_{0,corr}$
.
Experimental detonation velocity versus charge density for three shots with a thickness of 8.0 mm: 8-1662, 8-1589 and 8-1590.

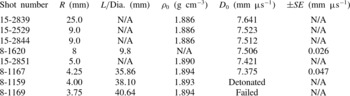
PBX 9502 diameter effect for cylindrical rate sticks of PBX 9502 (lot 008). Shots were fired at
 $22.5\pm 2.5\,^{\circ }\text{C}$
. The data for shots 15-2839, 15-2529, 15-2844 and 15-2851 are taken from Hill et al. (Reference Hill, Bdzil, Davis and Critchfield2006); the data for shots 8-1159, 8-1167, 8-1169 and 8-1620 are from diagnostics tests conducted by the present authors at Los Alamos National Laboratory in 2008 and 2012. Test 8-1159 used only a witness plate to evaluate failure and did not measure velocity due to failure of the ionization diagnostic.

2.3.2. PBX 9502 size-effect scaling
Table 6 contains prior data from cylindrical rate-stick experiments fielded with an identical PBX 9502 explosive lot (008) to that used in the present slab tests. The data indicate a critical radius between 3.75 and 4.00 mm, while table 5 indicates a critical thickness between 3.50 and 3.75 mm. Thus, at failure,
 $R/T$
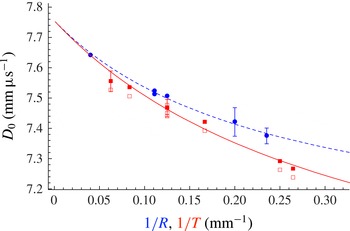
is between 1.00 and 1.14, consistent with our analysis (see § 1) of the prism tests by Ramsay (Reference Ramsay1985). Figure 6 compares the diameter- and thickness-effect curves. As with the PBX 9501 data, the curves result from fitting (2.1) to the experimental data. The density-corrected slab data were used in the curve-fitting process, and the fit parameters are given in table 4. The experimental PBX 9502 scale-effect data do not correspond well to the
 $R=T$
scaling over the range of conditions tested. The detonation velocity points for the slab geometry are consistently below those for the cylindrical rate sticks, and the deviation between the two increases as the charge size decreases. Specifically, the experimentally observed
 $R/T$
ratio is near 0.83 and consistently below unity.
Size-effect data for PBX 9502. Blue circles are cylindrical rate-stick detonation velocities (table 6). Empty and filled red squares denote, respectively, experimental and density-corrected detonation velocities from the slabs (table 5). Blue dashed and red solid lines are the modified Eyring form fits to the cylindrical and density-corrected slab experimental data, respectively. Error bars are plotted for the data represented by filled symbols using
 $\mathit{SE}$
values from tables 5 and 6, but may be smaller than the symbols.

2.4. ANFO
Unlike PBX 9501 and PBX 9502, ANFO detonation does not occur due to decomposition of a metastable molecule. Instead, ANFO is a heterogenous mixture of a hydrocarbon-based fuel oil (FO) and an ammonium nitrate (AN) oxidizing agent that remains molecularly distinct at typical atmospheric temperatures. Shock loading mechanically mixes and ionizes these two components sufficiently to support the detonation reaction. The heterogenous nature of the mixture results in a very insensitive explosive (technically classified as a blasting agent) with a long spatial reaction zone of
 $\mathit{O}(10~\text{mm})$
and a failure diameter near 75 mm. Due to the non-ideal nature of the explosive, the detonation velocity is sensitive to reaction zone flow divergence, and experimentally observed velocities range from 1.5 to
 $4.0~\text{mm}~{\rm\mu}\text{s}^{-1}$
, depending on charge size and confinement. A large range of detonation velocity variation is characteristic of non-ideal explosives.
Three slab experiments were performed with a standard ANFO formulation composed of 94 wt% ammonium nitrate prills mixed with 6 wt% No. 2 diesel fuel. Porous, explosive-grade ammonium nitrate from Dyno Nobel was used, with a typical bulk density of
 $0.80~\text{g}~\text{cm}^{-3}$
and an average prill diameter ranging from 1.4 to 2.0 mm. Mixing was accomplished by combining the prills and diesel fuel in a rotating barrel mixer for a minimum of 15 min. Unlike the PBX 9501 and PBX 9502 slab experiments, which were unconfined, the granular nature of ANFO required confinement to form a main charge. For this purpose, rectangular forms were constructed of plywood of
 $3/4$
in. thickness, as a shock polar analysis indicated that plywood does not provide any effective confinement for ANFO detonation (Bdzil et al.
Reference Bdzil, Aslam, Catanach, Hill and Short2002). After mixing, ANFO was poured into each experimental assembly in 1 kg increments. Each incremental fill was hand-tamped to prevent significant clumping or void formation. This methodology was sufficient to achieve an ANFO density of
 $0.87{-}0.93~\text{g}~\text{cm}^{-3}$
. The main charge was initiated by a booster charge and line wave generator composed of PETN-based sheet explosive. The booster charge width and thickness matched those of the adjacent main charge, while the booster length was approximately equal to the main charge thickness. The line wave generator thickness was 12 mm. Slab thicknesses of 50.8, 76.2 and 101.6 mm were fielded. Specific dimensions are listed in table 7. Shorting pins (Model CA-1038 from Dynasen, Inc.) were used for detonation time-of-arrival measurements. For the ANFO slab tests, the distance to the first shorting pin from the upstream end of the main charge was three charge thicknesses. A total of 11 shorting pins were used for each test. The probes were equally spaced over the remaining charge length, corresponding to interpin spacings of 38.1, 57.15 and 76.2 mm for the tests with slab thickness 50.8, 76.2 and 101.6 mm, respectively.
ANFO thickness effect in a slab geometry for a mass composition of 94 % ammonium nitrate (Dyno Nobel explosive grade) and 6 % No. 2 diesel fuel oil. Shots were fired at ambient temperature.

Detonation velocities are reported in table 7. The ANFO detonation velocity is seen to increase with the slab thickness. Standard error values range from 0.008 to
 $0.031~\text{mm}~{\rm\mu}\text{s}^{-1}$
(0.2–1.4 %) and decrease with increasing slab thickness. Examination of the fitted lines against the discrete time-of-arrival points for these tests indicates that the detonation is initially overdriven off the booster and decays as it propagates. We conjecture that the wave requires more distance to decay to the lower steady detonation velocities measured in the thinner slabs, which results in higher standard error.
Table 8 contains previously published cylindrical rate-stick data for ANFO from experiments of Bdzil et al. (Reference Bdzil, Aslam, Catanach, Hill and Short2002) performed with cardboard confinement, which provides a similar explosive-confined impedance match to the plywood used in the present ANFO slab tests. Figure 7 compares the diameter- and thickness-effect curves for ANFO obtained using experimental data from tables 7 and 8 and curves based on (2.1) with fit parameters from table 4. The experimental ANFO size-effect data do not correspond well to the
 $R=T$
scaling over the range of conditions tested. The detonation velocity points for the slab geometry are consistently below those for the cylindrical rate sticks. Specifically, the experimentally observed
 $R/T$
ratio is near 0.7 and consistently below a value of 1.
ANFO cylindrical rate-stick diameter effect for a mass composition of 94 % ammonium nitrate and 6 % No. 2 diesel fuel oil. Shots were performed at ambient temperature with Titan Energy explosive-grade AN. Standard errors are not available. The test series is as described in Bdzil et al. (Reference Bdzil, Aslam, Catanach, Hill and Short2002), with quantitative values of
 $D_{0}$
against radius supplied to the authors by Larry Hill.

Size-effect data for ANFO. Red squares and blue circles denote, respectively, the experimental slab and cylindrical geometry detonation velocities from tables 7 and 8. Blue dashed and red solid lines are modified Eyring form fits to the cylindrical and slab experimental data, respectively. Error bars are plotted for the slab data only and may be smaller than the symbols.

The ratio
 $R(D_{0})/T(D_{0})$
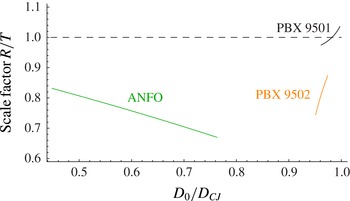
for PBX 9501, PBX 9502 and ANFO.

2.5. Measured scale factor
 $R/T$
for common
$D_{0}$


The modified Eyring form fits can be used to evaluate the evolution of the
 $R/T$
scaling inferred from experiment. Figure 8 plots the ratio of
 $R$
to
 $T$
using values derived from (2.1) and table 4 for common values of
 $D_{0}$
. The black, orange and green curves represent PBX 9501, PBX 9502 and ANFO, respectively. Extrapolation is avoided and each curve spans only the experimentally observed range of
 $D_{0}$
from tables 2, 5 and 7. The detonation velocity
 $D_{0}$
is normalized by
 $D_{CJ}$
, which is taken to be 8.8, 7.755 and
 $4.8~\text{mm}~{\rm\mu}\text{s}^{-1}$
for PBX 9501, PBX 9502 and ANFO, respectively. The
 $R/T$
ratio for PBX 9501 is seen to increase from 0.974 to 1.036 for
 $D_{0}/D_{CJ}=0.961{-}0.997$
. (Note that for larger
 $D_{0}$
, the limited fitting parameters in (2.1) prevent an accurate determination of the variation of the
 $R/T$
scale close to the CJ value. A more sophisticated DSD fitting form (Aslam Reference Aslam, Elert, Furnish, Chau, Holmes and Nguyen2007) applied to the rate-stick data alone gives a scale factor
 $R/T<1$
at the larger phase velocities.) The
 $R/T$
ratio for PBX 9502 ranges from 0.744 to 0.874 for
 $D_{0}/D_{CJ}=0.951{-}0.974$
. Finally,
 $R/T$
for ANFO ranges from 0.670 to 0.832 for
 $D_{0}/D_{CJ}=0.448{-}0.763$
. Averaging over the interpolated region for each formulation gives average
 $R/T$
values of 0.998, 0.813 and 0.753 for PBX 9501, PBX 9502 and ANFO, respectively. Thus, the
 $R/T$
ratio is seen to decrease from unity as the explosive formulation becomes less ideal. Additionally, the PBX 9501 and PBX 9502
 $R/T$
values each decrease from unity as
 $D_{0}$
decreases. In contrast, the ANFO
 $R/T$
values increase towards unity as
 $D_{0}$
decreases. In the following section, DSD is used to further understand the relationship between the thickness- and diameter-effect curves in the slab and rate-stick geometries for PBX 9501, PBX 9502 and ANFO.
3. Detonation shock dynamics
Detonation shock dynamics (DSD) is an intrinsic surface propagation concept that replaces the detonation shock and reaction zone with a surface that evolves according to a prescribed intrinsic surface evolution law. Developed by Bdzil and Stewart (Bdzil & Stewart Reference Bdzil and Stewart1986; Stewart & Bdzil Reference Stewart, Bdzil, Buckmaster and Takeno1988a
,Reference Stewart and Bdzil
b
; Bdzil, Fickett & Stewart Reference Bdzil, Fickett and Stewart1989; Bdzil & Stewart Reference Bdzil and Stewart1989), it provides an advanced capability to describe detonation wave sweep through an arbitrarily complex geometry. There are two assumptions that underpin the DSD concept. The first is that the detonation shock front evolves quasi-steadily, i.e. the transit time of a particle through a characteristic reaction zone thickness is short relative to the temporal scale of changes in the shock shape. Secondly, the local curvature of the shock is small compared with the inverse of the characteristic reaction zone thickness. Under these assumptions, at leading order, the motion of the DSD surface relates the normal velocity of the surface
 $(D_{n})$
to the local surface curvature (
 ${\it\kappa}$
). For the purposes of this paper, we refer to this as lower-order DSD. Higher-order effects, which account for the effects of front acceleration and transverse flow, can be introduced in a systematic way. We refer to the inclusion of such terms in the DSD evolution laws as higher-order DSD.
3.1. Lower-order DSD
For the lower-order DSD theory, we define the existence of a general surface DSD propagation law given by
 $$\begin{eqnarray}{\it\kappa}=f(D_{n})\end{eqnarray}$$
for some arbitrary function
 $f$
of
 $D_{n}$
. The curvature
 ${\it\kappa}$
represents the sum of the principal curvatures for any three-dimensional surface. In order to determine the evolution law (3.1) for a given HE, a specified functional form for
 $f$
is assumed, and the functional form parameters are fitted to the shock shapes and size-effect curve obtained from experiments. This is typically done using the rate-stick geometry. In the rate-stick configuration, the DSD surface curvature has two components: the slab component, which is the two-dimensional curvature along a diameter of the rate stick, and the axisymmetric component. The slab curvature component is determined by measuring the shock breakout times along a cylinder diameter at the end of the charge via a streak camera and mirror destruction (or turning) technique (Hill et al.
Reference Hill, Bdzil, Davis and Critchfield2006). Experimental calibration of lower-order DSD relations has been done for a variety of explosives, including PBX 9501 (Aslam Reference Aslam, Elert, Furnish, Chau, Holmes and Nguyen2007), PBX 9502 (Bdzil, 2003, personal communication; Hill & Aslam Reference Hill and Aslam2010) and ANFO (Bdzil et al.
Reference Bdzil, Aslam, Catanach, Hill and Short2002; Bdzil, 2008, personal communication). In particular, we note that for these explosives in an unconfined rate-stick geometry, the slab component of curvature has the property that it increases monotonically with increases in the radial coordinate from the cylinder axis.
For a given DSD form, determination of the surface motion also requires information on how the HE is confined. This is done at the HE/material interface through specification of the ‘edge’ angle between the shock normal direction and the tangent to the material interface, which reflects the degree of HE confinement (Bdzil & Stewart Reference Bdzil and Stewart2007). Note that in the lower-order DSD theory, since
 $D_{n}$
is a function of curvature, the different
 $D_{n}{-}{\it\kappa}$
curves obtained in rate sticks of different radii (or slabs of different thicknesses) should overlap where there are common curvature points and ultimately combine to form a single curve in
 $D_{n}{-}{\it\kappa}$
space. Close grouping of such
 $D_{n}$
–
 ${\it\kappa}$
curves has been observed for PBX 9501 (Chiquete et al.
Reference Chiquete, Jackson and Short2014) and PBX 9502 (Hill & Aslam Reference Hill and Aslam2010), but not for ANFO (Bdzil et al.
Reference Bdzil, Aslam, Catanach, Hill and Short2002). We emphasize that the relation (3.1) is an intrinsic, coordinate-free surface propagation law. Thus, a given HE calibrated in one geometry, e.g. the cylindrical rate stick, should be able to accurately reproduce detonation propagation dynamics in other geometries, such as the slab geometry considered here.
As noted above, Petel et al. (Reference Petel, Mack, Higgins, Turcotte and Chan2006, Reference Petel, Mack, Higgins, Turcotte and Chan2007), Silvestrov et al. (Reference Silvestrov, Plastinin, Karakhanov and Zykov2008) and Higgins (Reference Higgins, Elert, Buttler, Furnish, Anderson and Proud2009) proposed that curvature-based theories of detonation propagation and failure should result in the recovery of scale factors where
 $R(D_{0})/T(D_{0})=1$
and
 $R_{c}/T_{c}=1$
. Consequently, with the size-effect and failure scale factors in their experiments showing deviations away from unity, they surmised that other factors, in addition to curvature, are contributing significantly to the physics of detonation propagation and failure. The curvature-based lower-order DSD model (3.1), though, is able to dissociate contributions made from the axisymmetric and slab curvature components in a rate-stick configuration. These two components are generally not equal, except on the rate-stick axis, and so we generally would not expect a steady propagation scale factor
 $R(D_{0})/T(D_{0})=1$
. In fact, we show in § 3.1.2 that any detonation whose propagation can be adequately represented by (3.1) must necessarily have a scale factor
 $R/T<1$
, provided that the slab component of curvature increases monotonically with radius.
Bdzil (Reference Bdzil1981) has shown that the scale factor
 $R(D_{0})/T(D_{0})=1$
can be approached in the limit where the streamline angle deflection behind the detonation shock is small. Thus, for example, heavily confined explosives are more likely to approach the limiting small-streamline-deflection case of
 $R(D_{0})/T(D_{0})=1$
(see § 4). For larger streamline deflection angles, Bdzil (Reference Bdzil1981) showed that the diameter- and thickness-effect curves diverge, where, for the specific reaction rate model used, it was found that
 $R(D_{0})/T(D_{0})<1$
. This result is consistent with the analysis in the present paper.
While DSD-based theories should be expected to capture the propagation scale factor
 $R(D_{0})/T(D_{0})$
across a range of explosives, DSD (lower- or higher-order) should not be expected to accurately determine the ratio of the critical diameter to thickness. The detonation failure process is inherently unsteady and involves significant increases in the characteristic reaction zone thickness. Additionally, there is no prior evidence that a purely curvature-based theory would predict failure. Therefore, we do not examine the critical diameter-to-thickness ratio further, and restrict our attention to examination of the steady propagation scale factor
 $R(D_{0})/T(D_{0})$
.
3.1.1. Lower-order DSD: steady propagation in rate-stick and slab geometries
Consider the steady propagation of an axisymmetric detonation in the positive axial
 $z$
direction of a cylindrical explosive, where the DSD surface is given as a function of the radial coordinate
 $r$
by
 $z=z_{s}(r)$
, with a surface normal orientated in the direction of fresh reactants. Defining a level-set function
 $S=z-z_{s}(r)$
, the normal to the surface is
 $$\begin{eqnarray}\boldsymbol{n}=\frac{\boldsymbol{{\rm\nabla}}S}{|\boldsymbol{{\rm\nabla}}S|}=\frac{1}{\sqrt{1+[\text{d}z_{s}(r)/\text{d}r]^{2}}}\left(-\frac{\text{d}}{\text{d}r}z_{s}(r)\boldsymbol{e}_{r}+\boldsymbol{e}_{z}\right),\end{eqnarray}$$
with a total curvature given by the sum of the slab (
 ${\it\kappa}_{s}$
) and axisymmetric (
 ${\it\kappa}_{a}$
) components, where
 $$\begin{eqnarray}{\it\kappa}=\boldsymbol{{\rm\nabla}}\boldsymbol{\cdot }\boldsymbol{n}={\it\kappa}_{s}+{\it\kappa}_{a},\quad {\it\kappa}_{s}=-\frac{z_{s}^{\prime \prime }(r)}{(1+[z_{s}^{\prime }(r)]^{2})^{3/2}},\quad {\it\kappa}_{a}=-\frac{z_{s}^{\prime }(r)}{r(1+[z_{s}^{\prime }(r)]^{2})^{1/2}}.\end{eqnarray}$$
Here
 $\text{}^{\prime }$
denotes
 $\text{d}/\text{d}r$
. With
 $D_{0}$
as the steady axial detonation phase speed, the shock angle
 ${\it\phi}$
between the axial direction and the surface normal
 $\boldsymbol{n}$
at any point on the surface is determined by
 $$\begin{eqnarray}\cos {\it\phi}=\frac{D_{n}}{D_{0}}=\frac{1}{|\boldsymbol{{\rm\nabla}}S|}=\frac{1}{(1+[z_{s}^{\prime }(r)]^{2})^{1/2}},\quad \frac{\text{d}z_{s}}{\text{d}r}=-\text{tan}\,{\it\phi},\end{eqnarray}$$
so that
 ${\it\kappa}$
can be written as
 $$\begin{eqnarray}{\it\kappa}={\it\kappa}_{s}+{\it\kappa}_{a},\quad {\it\kappa}_{s}=\frac{\text{d}{\it\phi}}{\text{d}{\it\xi}},\quad {\it\kappa}_{a}=\frac{\sin {\it\phi}}{r},\end{eqnarray}$$
where
 ${\it\xi}$
is the surface arclength. Switching to
 ${\it\phi}$
as the independent variable, the
 $(r,z)$
components of the surface shape can then be calculated by integration of
 $$\begin{eqnarray}\frac{\text{d}r}{\text{d}{\it\phi}}=\frac{\cos {\it\phi}}{{\it\kappa}_{s}},\quad \frac{\text{d}z}{\text{d}{\it\phi}}=-\frac{\sin {\it\phi}}{{\it\kappa}_{s}},\end{eqnarray}$$
subject to
 $$\begin{eqnarray}z({\it\phi}=0)=0,\quad r({\it\phi}=0)=0\quad \text{and}\quad r({\it\phi}={\it\phi}_{edge})=R,\end{eqnarray}$$
where
 ${\it\phi}_{edge}$
is the shock angle at the edge of the explosive
 $(r=R)$
. For all the experiments described in § 2, the explosive is unconfined, and the edge angle will correspond to the sonic angle
 $({\it\phi}_{edge}={\it\phi}_{s})$
of the explosive (Bdzil & Stewart Reference Bdzil and Stewart2007). Because of the
 $1/r$
term in the axisymmetric curvature component in (3.5c
), the integration of (3.6) is started at a finite small value of
 ${\it\phi}$
, where
 $$\begin{eqnarray}r\sim \frac{{\it\phi}}{{\it\kappa}_{s}({\it\phi}=0)},\quad z\sim -\frac{{\it\phi}^{2}}{2{\it\kappa}_{s}({\it\phi}=0)}\quad \text{with }{\it\phi}\ll 1;\end{eqnarray}$$
and on
 ${\it\phi}=0$
,
 $$\begin{eqnarray}D_{n}=D_{0},\quad {\it\kappa}_{s}({\it\phi}=0)={\it\kappa}_{a}({\it\phi}=0),\quad {\it\kappa}=2{\it\kappa}_{s}({\it\phi}=0),\quad \text{where}~{\it\kappa}_{s}({\it\phi}=0)=f(D_{0})/2.\end{eqnarray}$$
If both
 ${\it\phi}_{edge}$
and the phase speed
 $D_{0}$
are specified, the surface shape
 $z_{s}(r)$
and rate-stick radius
 $R$
are determined by a single integration of (3.6) from
 ${\it\phi}=0$
to
 ${\it\phi}={\it\phi}_{edge}$
. On the other hand, if both
 ${\it\phi}_{edge}$
and
 $R$
are specified, the phase speed
 $D_{0}$
consistent with these specifications would be determined by a sequence of integrations of (3.6) and iteration on
 $D_{0}$
until
 $r=R$
at
 ${\it\phi}={\it\phi}_{edge}$
.
For the 2-D slab geometry, the above analysis is repeated, except that now
 ${\it\kappa}_{a}=0$
while
 $r$
refers to the distance from the slab centre to the slab edge. Boundary conditions (3.7) with
 $r({\it\phi}={\it\phi}_{edge})=T/2$
, where
 $T$
is the slab thickness, can be applied directly to the integration of (3.6).
3.1.2. The
$R/T<1$
scaling for lower-order DSD

Here we show that any steady detonation whose propagation can be represented by the lower-order DSD form (3.1) with
 $\text{d}{\it\kappa}_{s}/\text{d}r>0$
, i.e. where the slab curvature component increases with increasing
 $r$
, must have
 $R/T<1$
. Consider the rate-stick configuration. Note that the slab component of curvature can be written as
 $$\begin{eqnarray}{\it\kappa}_{s}=\cos {\it\phi}\frac{\text{d}{\it\phi}}{\text{d}r}=\frac{\text{d}(\sin {\it\phi})}{\text{d}r},\end{eqnarray}$$
where
 ${\it\kappa}_{s}>0$
. From (3.3), the total curvature
 ${\it\kappa}$
is then
 $$\begin{eqnarray}{\it\kappa}=\frac{\text{d}(\sin {\it\phi})}{\text{d}r}+\frac{\sin {\it\phi}}{r}.\end{eqnarray}$$
We now additionally assume that
 $$\begin{eqnarray}\frac{\text{d}{\it\kappa}_{s}}{\text{d}r}=\frac{\text{d}^{2}(\sin {\it\phi})}{\text{d}^{2}r}>0\quad \text{for}~r>0,\end{eqnarray}$$
where
 $\text{d}{\it\kappa}_{s}/\text{d}r=0$
on
 $r=0$
from (3.8). Application of the mean value theorem to the function (3.11) with the constraint (3.12) implies that
 $$\begin{eqnarray}\frac{\text{d}(\sin {\it\phi})}{\text{d}r}>\frac{\sin {\it\phi}}{r}\quad \text{for}~r>0,\end{eqnarray}$$
i.e. at each radial component
 $r$
, the slab component of curvature is greater than the corresponding axisymmetric component. The two components are equal on
 $r=0$
. Now, for a given phase velocity
 $D_{0}$
, the rate-stick radius
 $R$
at which
 ${\it\phi}={\it\phi}_{edge}$
is determined from integration of
 $$\begin{eqnarray}\left.\frac{\text{d}(\sin {\it\phi})}{\text{d}r}+\frac{\sin {\it\phi}}{r}\right|_{rs}=\,f(D_{0}\cos {\it\phi}),\end{eqnarray}$$
where
 $|_{rs}$
denotes the rate-stick geometry. Similarly, in the slab geometry, the slab height
 $T/2$
at which
 ${\it\phi}={\it\phi}_{edge}$
for the same phase velocity
 $D_{0}$
is determined from integration of
 $$\begin{eqnarray}\left.\frac{\text{d}(\sin {\it\phi})}{\text{d}r}\right|_{slab}=\,f(D_{0}\cos {\it\phi}),\end{eqnarray}$$
where
 $|_{slab}$
denotes the slab geometry. However, by applying the inequality (3.13) to (3.14), it can also be shown that
 $$\begin{eqnarray}\left.2\frac{\text{d}(\sin {\it\phi})}{\text{d}r}\right|_{rs}=\left.\frac{\text{d}(\sin {\it\phi})}{\text{d}(r/2)}\right|_{rs}>f(D_{0}\cos {\it\phi}).\end{eqnarray}$$
By comparing (3.15) and (3.16), it follows that for each phase velocity
 $D_{0}$
,
 $R$
and
 $T$
must satisfy the inequality
 $$\begin{eqnarray}R/2<T/2,\quad \text{or}\quad R/T<1.\end{eqnarray}$$
The implication of (3.17) for the size-effect curves is that when
 $D_{0}$
is plotted against
 $1/R$
for the rate stick and against
 $1/T$
for the slab, the slab thickness-effect curve must lie to the left of the rate-stick diameter-effect curve. In § 2, this was shown to be the case for the experimentally determined size-effect curves for PBX 9501, PBX 9502 and ANFO.
3.1.3.
$D_{n}{-}{\it\kappa}$
forms for PBX 9501, PBX 9502 and ANFO

We now examine the previously calibrated lower-order DSD (or
 $D_{n}{-}{\it\kappa}$
) fits for PBX 9501, PBX 9502 and ANFO. These have the functional form
 $$\begin{eqnarray}\frac{D_{n}}{D_{CJ}}=1+A((C_{1}-{\it\kappa})^{e_{1}}-C_{1}^{e_{1}})-B{\it\kappa}\left(\frac{1+C_{2}{\it\kappa}+C_{3}{\it\kappa}^{2}}{1+C_{4}{\it\kappa}+C_{5}{\it\kappa}^{2}}\right),\end{eqnarray}$$
where
 $A$
,
 $B$
,
 $C_{1}$
,
 $C_{2}$
,
 $C_{3}$
,
 $C_{4}$
,
 $C_{5}$
and
 $e_{1}$
(if
 $A\neq 0$
) are fitting parameters. In some cases, the CJ velocity
 $D_{CJ}$
and the sonic angle
 ${\it\phi}_{s}$
are also used as fitting parameters or, alternatively, prescribed fixed values that are associated with the state properties of the explosive. Parameter values for the
 $D_{n}{-}{\it\kappa}$
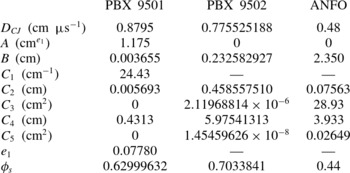
relation (3.18) for each explosive are listed in table 9, where each calibration is based solely on experimental data obtained in the rate-stick configuration.
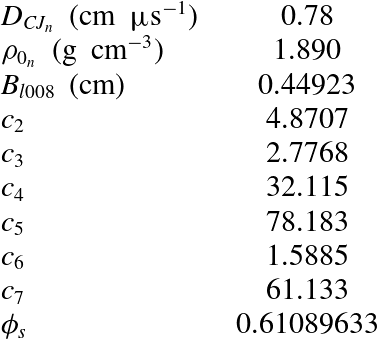
Fits to the DSD propagation law given by (3.18) for PBX 9501, PBX 9502 (lot 008) and ANFO, with units as originally published.

For PBX 9501, the calibration is from Aslam (Reference Aslam, Elert, Furnish, Chau, Holmes and Nguyen2007), based on the twelve rate-stick diameter-effect points along with the two shock shape records reported in table 3. The calibration for PBX 9502 is specific to lot 008 and was calculated by Bdzil (2003, personal communication) using the rate-stick diameter-effect points and associated shock shape data from shots 15-2839, 15-2529 and 15-2851 in table 6. The calibration for ANFO was again done by Bdzil (2008, personal communication). The calibration was based on the 14 rate-stick diameter-effect points shown in table 8 along with the 10 shock shapes that were available from the tests (these tests have the recorded shot numbers in table 8). It represents a fit of the non-overlapping
 $D_{n}{-}{\it\kappa}$
data reported in Bdzil et al. (Reference Bdzil, Aslam, Catanach, Hill and Short2002).
For PBX 9502, we explore a second
 $D_{n}{-}{\it\kappa}$
relation, due to Hill & Aslam (Reference Hill and Aslam2010), which accounts for the effect of an initial density variation relative to a nominal density. The
 $D_{n}{-}{\it\kappa}$
relation is of the form
 $$\begin{eqnarray}\frac{D_{n}}{D_{CJ}}=1-B_{1}{\it\kappa}\left(\frac{1+c_{2}B_{1}{\it\kappa}+c_{3}(B_{1}{\it\kappa})^{2}}{1+c_{4}B_{1}{\it\kappa}+c_{5}(B_{1}{\it\kappa})^{2}}\right),\end{eqnarray}$$
where
 $$\begin{eqnarray}D_{CJ}=D_{CJ_{n}}\left(1+c_{6}\left(\frac{{\it\rho}_{0}}{{\it\rho}_{0_{n}}}-1\right)\right)\quad \text{and}\quad \frac{B_{1}}{B_{l008}}=1+c_{7}\left(\frac{{\it\rho}_{0}}{{\it\rho}_{0_{n}}}-1\right).\end{eqnarray}$$
Here
 $D_{CJ_{n}}$
is the CJ speed at the nominal density
 ${\it\rho}_{0_{n}}$
. The calibration in Hill & Aslam (Reference Hill and Aslam2010), which also involved the effect of initial temperature variations relative to room temperature, was done using 50 rate-stick diameter-effect points and 22 shock shapes obtained from experiments across a range of PBX 9502 lots and initial density and temperature conditions. The available density range used in the calibration was
 $1.890\pm 0.005~\text{g}~\text{cm}^{-3}$
. The PBX 9502 calibration parameters for (3.19) and (3.20) specific to lot 008 at room temperature are given in table 10.

3.2. Higher-order DSD
It has been recognized previously that for certain explosives, especially those classified as non-ideal, the experimentally observed normal detonation velocity variation with curvature cannot be captured with the leading-order DSD theory (Kennedy Reference Kennedy1998; Bdzil et al.
Reference Bdzil, Aslam, Catanach, Hill and Short2002). Consequently, attempts have been made to incorporate additional physics, in particular effects resulting from detonation front acceleration and from transverse flow. Brun (see Brun, Kneib & Lascaux Reference Brun, Kneib and Lascaux1994) incorporated the acceleration term
 $\text{D}D_{n}/\text{D}t$
in an ad hoc fashion, proposing the higher-order intrinsic evolution equation
 $$\begin{eqnarray}\frac{\text{D}D_{n}}{\text{D}t}=-C(D_{n})({\it\kappa}-K(D_{n})),\end{eqnarray}$$
where
 $C$
and
 $K$
are functions of
 $D_{n}$
. Yao & Stewart (Reference Yao and Stewart1996) and Kasimov & Stewart (Reference Kasimov and Stewart2005) sought to incorporate the acceleration term
 $\text{D}D_{n}/\text{D}t$
in a more systematic way by examining the relative magnitudes of the
 $\text{D}D_{n}/\text{D}t$
,
 $D_{CJ}-D_{n}$
and
 ${\it\kappa}$
terms, and subsequently incorporating the
 $\text{D}D_{n}/\text{D}t$
and
 ${\it\kappa}$
contributions at the same order. Contributions arising from transverse flow terms were neglected. Consequently, the derived high-order evolution equations have hyperbolic wave-like characteristic properties. Aslam & Stewart (Reference Aslam and Stewart1999) calibrated a hyperbolic higher-order evolution equation of the form
 $$\begin{eqnarray}\frac{\text{D}D_{n}}{\text{D}t}=-\frac{D_{n}^{2}{\it\kappa}}{2}+{\it\beta}(D_{n})\end{eqnarray}$$
to properties of a reactive Euler model, and showed that solutions to the evolution equation provided a good approximation to a direct numerical simulation of the Euler equations in geometries with perfectly confining walls. For problems where the shape of the wave is specified at the HE/material boundary due to confinement effects, the direction of the characteristics in these hyperbolic higher-order equations may limit the range of edge angles that can be considered (Bdzil et al. Reference Bdzil, Aslam, Catanach, Hill and Short2002). To the authors’ knowledge, there have not been any attempts to parameterize the hyperbolic higher-order DSD evolution equations, which include only the addition of the front acceleration terms, to the rate-stick diameter effect or slab thickness effect and shock shapes for PBX 9501, PBX 9502 or ANFO; so we will not consider the hyperbolic forms further in this study.
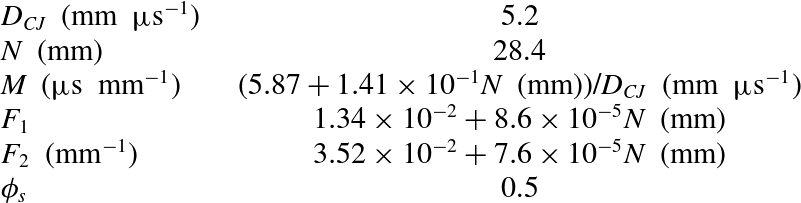
For insensitive and non-ideal HEs, a higher-order intrinsic surface evolution equation for DSD has been developed which accounts for the two effects of front acceleration and transverse flow (Aslam, Bdzil & Hill Reference Aslam, Bdzil and Hill1998; Bdzil et al. Reference Bdzil, Aslam, Catanach, Hill and Short2002). Due to the inclusion of transverse flow, the resulting higher-order evolution equation has a parabolic structure. In the axisymmetric rate-stick configuration, this evolution equation takes the form
 $$\begin{eqnarray}{\it\kappa}={\it\kappa}_{s}+\frac{\sin {\it\phi}}{r}=F(\mathscr{D})-M(\mathscr{D})\frac{\text{D}\mathscr{D}}{\text{D}t}+N(\mathscr{D})\frac{\partial ^{2}\mathscr{D}}{\partial {\it\xi}^{2}},\quad \mathscr{D}=\frac{D_{n}}{D_{CJ}}-1,\end{eqnarray}$$
while for the slab geometry the axisymmetric curvature component
 $(\sin {\it\phi})/r$
is omitted. Here
 $M(\mathscr{D})\geqslant 0$
,
 $N(\mathscr{D})\geqslant 0$
and
 $F(\mathscr{D})>0$
. The front acceleration
 $(M\cdot \text{D}\mathscr{D}/\text{D}t)$
and transverse flow (
 $N\cdot \partial ^{2}\mathscr{D}/\partial {\it\xi}^{2}$
) components arise as the first correction terms to the leading-order
 ${\it\kappa}=F(\mathscr{D})$
evolution equation in a systematic asymptotic analysis of the front propagation dynamics based on the standard DSD scalings of slow time evolution and small curvature (Aslam et al.
Reference Aslam, Bdzil and Hill1998).
3.2.1. Higher-order DSD: steady propagation in rate-stick and slab geometries
We now consider steady solutions of the parabolic higher-order DSD evolution equation (3.23), where in a rate-stick or slab configuration,
 $$\begin{eqnarray}\displaystyle \left.\begin{array}{@{}c@{}}\displaystyle D_{n}=D_{0}\cos ({\it\phi}),\quad \frac{\text{D}\mathscr{D}}{\text{D}t}=-D_{CJ}\left(\frac{D_{0}}{D_{CJ}}\sin ({\it\phi})\right)^{2}{\it\kappa}_{s},\\ \displaystyle \frac{\partial ^{2}\mathscr{D}}{\partial {\it\xi}^{2}}=-\frac{D_{0}}{D_{CJ}}\left(\sin ({\it\phi})\frac{\text{d}{\it\kappa}_{s}}{\text{d}{\it\xi}}+\cos ({\it\phi}){\it\kappa}_{s}^{2}\right).\end{array}\right\} & & \displaystyle\end{eqnarray}$$
For a rate stick, the steady form of (3.23) becomes
 $$\begin{eqnarray}{\it\kappa}_{s}\frac{D_{0}}{D_{CJ}}\sin ({\it\phi})\frac{\text{d}{\it\kappa}_{s}}{\text{d}{\it\phi}}=-\frac{D_{0}}{D_{CJ}}\cos ({\it\phi}){\it\kappa}_{s}^{2}-\frac{1}{N}\left({\it\kappa}_{s}+\frac{\sin ({\it\phi})}{r}-F-D_{CJ}\left(\frac{D_{0}}{D_{CJ}}\sin ({\it\phi})\right)^{2}M{\it\kappa}_{s}\right).\end{eqnarray}$$
Given
 ${\it\phi}_{edge}$
and
 $R$
, the phase velocity
 $D_{0}$
is obtained by solving (3.25) together with (3.6) subject to the boundary conditions (3.7). Again, integration must begin at a small finite value of
 ${\it\phi}$
using (3.8), where on
 ${\it\phi}=0$
,
 $$\begin{eqnarray}{\it\kappa}_{s}=\frac{D_{CJ}}{D_{0}N}\left(-1+\left[1+\frac{D_{0}}{D_{CJ}}NF_{c}\right]^{1/2}\right),\quad F_{c}=F\left(\frac{D_{0}}{D_{CJ}}-1\right).\end{eqnarray}$$
Similarly, for a slab, the phase velocity
 $D_{0}$
is obtained by solving (3.25), omitting the
 $\sin ({\it\phi})/r$
term, together with (3.6) subject to (3.7). However, as for the rate stick, integration must also begin at a small finite value of
 ${\it\phi}$
using (3.8), where on
 ${\it\phi}=0$
,
 $$\begin{eqnarray}{\it\kappa}_{s}=\frac{D_{CJ}}{2D_{0}N}\left(-1+\left[1+4\frac{D_{0}}{D_{CJ}}NF_{c}\right]^{1/2}\right),\quad F_{c}=F\left(\frac{D_{0}}{D_{CJ}}-1\right).\end{eqnarray}$$
3.2.2.
$\text{D}D_{n}/\text{D}t-D_{n,{\it\xi}{\it\xi}}-D_{n}-{\it\kappa}$
form for ANFO

A calibration of the higher-order DSD equation (3.23) for ANFO has been provided by Bdzil et al. (Reference Bdzil, Aslam, Catanach, Hill and Short2002) assuming the functional forms
 $$\begin{eqnarray}F(\mathscr{D})=-F_{1}\mathscr{D}\exp (-F_{2}/(\mathscr{D}+1)),\quad M(\mathscr{D})=\text{constant},\quad N(\mathscr{D})=\text{constant}.\end{eqnarray}$$
Parameter values are shown in table 11. The parameter calibration was again based on the 14 rate-stick diameter-effect points shown in table 8 along with the 10 shock shapes that were available from the tests. (Note that the expression for
 $M$
in table 11 is that reported in Bdzil et al. (Reference Bdzil, Aslam, Catanach, Hill and Short2002) divided by a factor of
 $D_{CJ}$
, since the
 $D_{CJ}$
term correctly multiplying the steady front acceleration term in (3.25) was omitted in the analysis of Bdzil et al. (Reference Bdzil, Aslam, Catanach, Hill and Short2002). Consequently, the leading-order transverse signalling speed, which is proportional to the inverse of the square root of
 $M$
, should be greater than that observed by Bdzil et al. (Reference Bdzil, Aslam, Catanach, Hill and Short2002). This correction results in a faster relaxation time to steady-state propagation for the unsteady higher-order DSD evolution equation (3.23) for ANFO, potentially addressing a point of concern regarding the use of higher-order DSD theories raised in Bdzil et al. (Reference Bdzil, Aslam, Catanach, Hill and Short2002).)

3.3. Comparison of DSD predictions with slab and rate-stick experimental results
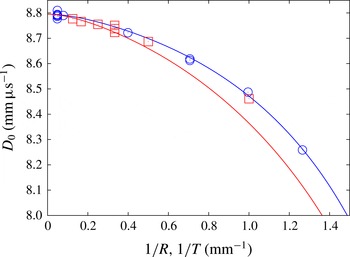
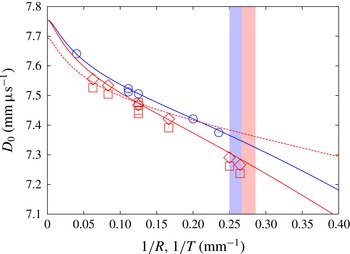
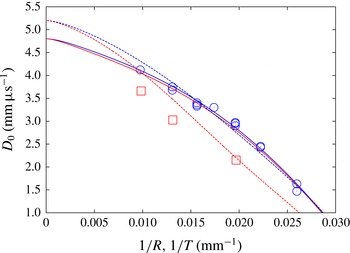
Figure 9 shows the lower-order DSD-calculated PBX 9501 diameter- and thickness-effect curves using the
 $D_{n}{-}{\it\kappa}$
relation (3.18) with table 9 parameters for unconfined,
 ${\it\phi}={\it\phi}_{s}$
, rate-stick (
 $D_{0}$
versus
 $1/R$
) and slab (
 $D_{0}$
versus
 $1/T$
) geometries. Also plotted are the corresponding experimentally calculated points from tables 2 and 3. Given that the PBX 9501
 $D_{n}{-}{\it\kappa}$
relation was calibrated using the rate-stick data only, unsurprisingly we observe a good fit between the DSD diameter-effect curve and the rate-stick data. Using the
 $D_{n}{-}{\it\kappa}$
relation (3.18) with table 9 parameters, the DSD thickness-effect curve for the slab geometry captures the experimental data reasonably well for thicker slabs, but deviates from the experimental data for thinner slabs, particularly for thicknesses of 1 and 2 mm. For the PBX 9501
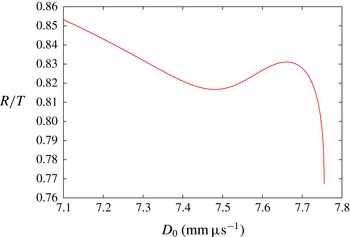
 $D_{n}{-}{\it\kappa}$
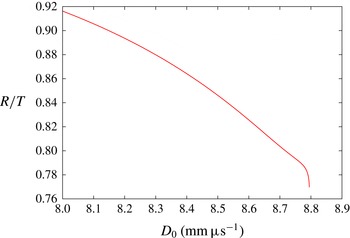
curve (3.18), the
 $R/T$
scaling as a function of phase velocity
 $D_{0}$
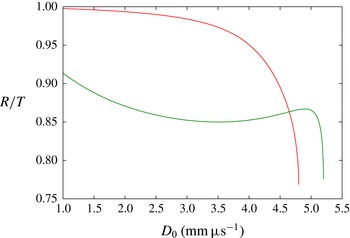
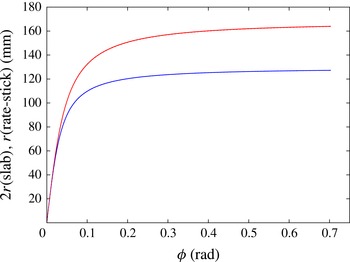
is shown in figure 10. For
 $D_{0}$
close to
 $D_{CJ}$
, there is a rapid increase in
 $R/T$
, whereafter the scale factor
 $R/T$
increases more slowly as
 $D_{0}$
decreases, reaching a value of
 $R/T=0.916$
when
 $D_{0}=8~\text{mm}~{\rm\mu}\text{s}^{-1}$
.
Diameter-effect variation for PBX 9501 rate sticks (
 $D_{0}$
versus
 $1/R$
, ○) and thickness-effect variation for PBX 9501 slabs (
 $D_{0}$
versus
 $1/T$
, ▫), along with the corresponding rate-stick (blue line) and slab (red line) lower-order DSD predictions.

Variation of the PBX 9501 detonation phase velocity
 $D_{0}$
with the ratio of rate-stick radius
 $R$
to slab thickness
 $T$
that correspond to
 $D_{0}$
when
 ${\it\phi}={\it\phi}_{s}$
at the rate-stick or slab edge.

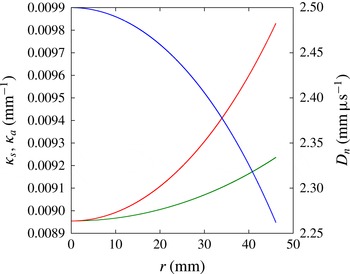
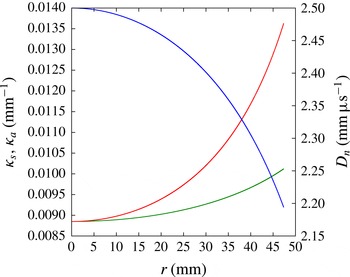
The components
 ${\it\kappa}_{s}$
and
 ${\it\kappa}_{a}$
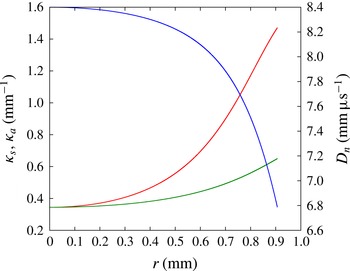
as functions of radius in the DSD rate-stick calculation for
 $D_{0}=8.4~\text{mm}~{\rm\mu}\text{s}^{-1}$
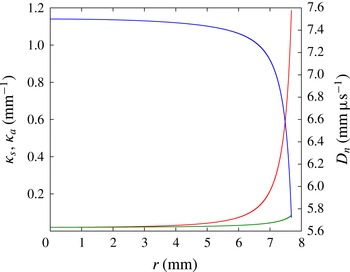
are shown in figure 11. Near the origin, the components are close in magnitude, but as the radius increases the slab component increasingly grows in magnitude relative to the axisymmetric component. From figure 9, the slab thickness-effect curve when plotted as
 $D_{0}$
versus
 $1/T$
lies to the left of the rate-stick diameter-effect curve when plotted as
 $D_{0}$
versus
 $1/R$
and, with
 ${\it\kappa}_{s}>{\it\kappa}_{a}$
across the rate stick, reinforces the discussion in § 3.1.2 on the consequence of differing components of curvature. The disparity in the curvature components across the rate stick for the lower-order DSD model may indicate that a higher-order DSD model is required to fit the smaller-diameter rate sticks. Also shown in figure 11 is the magnitude of the normal velocity component
 $D_{n}$
across the rate stick. A significant decrease in
 $D_{n}$
relative to the phase velocity
 $D_{0}$
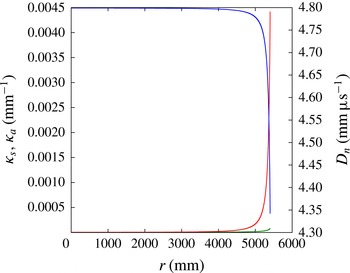
occurs with increasing radius. The curvature components
 ${\it\kappa}_{s}$
and
 ${\it\kappa}_{a}$
and the normal detonation velocity
 $D_{n}$
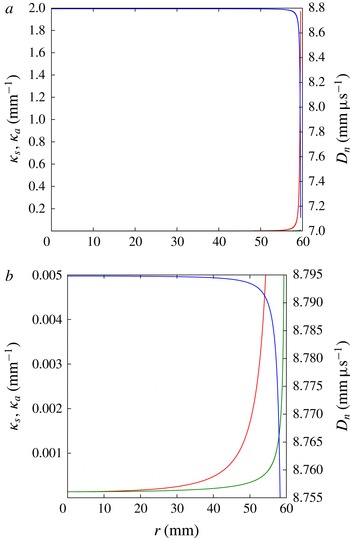
as functions of the radius for the PBX 9501 DSD rate-stick calculation for
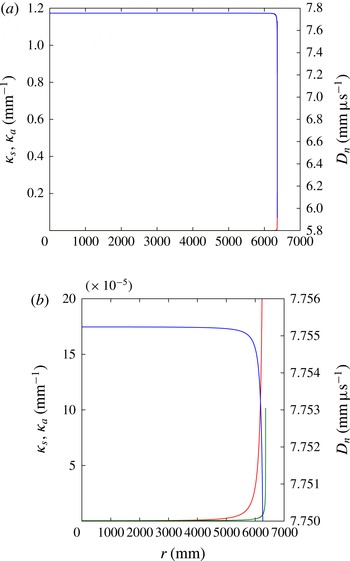
 $D_{0}=8.7948~\text{mm}~{\rm\mu}\text{s}^{-1}$
are shown in figure 12. This is in a regime in which
 $D_{0}\sim D_{CJ}$
, explored asymptotically in § 4. For most of the rate stick the curvature components are small, but
 ${\it\kappa}_{s}>{\it\kappa}_{a}$
everywhere except at
 $r=0$
, where
 ${\it\kappa}_{s}={\it\kappa}_{a}$
. The magnitude of the slab component
 ${\it\kappa}_{s}$
rises rapidly in a boundary layer at the edge of the rate stick to meet the requirement that
 ${\it\phi}={\it\phi}_{s}$
.
Slab
 ${\it\kappa}_{s}$
(red) and axisymmetric
 ${\it\kappa}_{a}$
(green) components of curvature, along with
 $D_{n}$
(blue), in a PBX 9501 rate stick from
 $r=0$
to
 $r=R$
, calculated when
 $D_{0}=8.4~\text{mm}~{\rm\mu}\text{s}^{-1}$
.

Slab
 ${\it\kappa}_{s}$
(red) and axisymmetric
 ${\it\kappa}_{a}$
(green) components of curvature, along with
 $D_{n}$
(blue), in a PBX 9501 rate stick from
 $r=0$
to
 $r=R$
, calculated when
 $D_{0}=8.7948~\text{mm}~{\rm\mu}\text{s}^{-1}$
: (a) full range of
 ${\it\kappa}_{s}$
,
 ${\it\kappa}_{a}$
and
 $D_{n}$
shown; (b) magnified region for
 $({\it\kappa}_{s},{\it\kappa}_{a})<0.005$
.

Figure 13 shows the DSD-calculated PBX 9502 size-effect curves using the
 $D_{n}{-}{\it\kappa}$
relation (3.18) with table 9 parameters for unconfined,
 ${\it\phi}={\it\phi}_{s}$
, rate-stick (
 $D_{0}$
versus
 $1/R$
) and slab (
 $D_{0}$
versus
 $1/T$
) geometries. Also plotted are the corresponding experimentally calculated points from tables 5 and 6, the slab experimental points corrected to a density of
 $1.886~\text{g}~\text{cm}^{-3}$
using the method described in § 2, and the PBX 9502 thickness-effect curve for slabs using the density-dependent PBX 9502
 $D_{n}{-}{\it\kappa}$
relations (3.19) and (3.20) for the parameters in table 10 with
 ${\it\rho}_{0}=1.874~\text{g}~\text{cm}^{-3}$
. Again, given that the PBX 9502
 $D_{n}{-}{\it\kappa}$
calibration was obtained via use of the rate-stick data, we observe a good fit between the DSD diameter-effect curve and the rate-stick data. The slab thickness-effect curve generated using the
 $D_{n}{-}{\it\kappa}$
relation (3.18) together with table 9 parameters agrees reasonably well with the slab experimental data, even though the experimental data were generated using lower-density HEs than those used for the rate-sticks. When these slab data are corrected to a density of
 $1.886~\text{g}~\text{cm}^{-3}$
using the extrapolation procedure described in § 2, the agreement between the slab data and the DSD thickness-effect curve from the
 $D_{n}{-}{\it\kappa}$
relation (3.18) is good. The
 $D_{n}{-}{\it\kappa}$
relations (3.19) and (3.20) can also be used to generate a slab thickness-effect curve with
 ${\it\rho}_{0}=1.874~\text{g}~\text{cm}^{-3}$
, a value close to the density of the slabs used in the testing (table 5). Despite being used outside of its fitting regime (
 ${\it\rho}_{0}=1.890\pm 0.005~\text{g}~\text{cm}^{-3}$
), the DSD-generated thickness-effect curve approximates well the data from slabs of thickness 16, 12, and 8 mm, but thereafter generates a phase velocity that is significantly above the experimental data values.
Diameter- and thickness-effect variation for PBX 9502 rate sticks (
 $D_{0}$
versus
 $1/R$
, ○) and PBX 9502 slabs (
 $D_{0}$
versus
 $1/T$
, ▫), along with the corresponding rate-stick (solid blue line) and slab (solid red line) DSD predictions based on (3.18). Also shown are the slab data points (♢) modified to a starting density of
 $1.886~\text{g}~\text{cm}^{-3}$
and the slab thickness-effect DSD prediction from (3.19) and (3.20) with
 ${\it\rho}_{0}=1.874~\text{g}~\text{cm}^{-3}$
(dashed red line). The light blue and red blocks indicate the regions of
 $1/R$
(
 $3.75~\text{mm}<R<4~\text{mm}$
) and
 $1/T$
(
 $3.5~\text{mm}<T<3.75~\text{mm}$
) in which detonation failure occurs in the rate-stick and slab geometries, respectively.

Figure 13 also shows the regions of
 $1/R$
(rate stick) and
 $1/T$
(slab) in which detonation failure is observed to occur experimentally. As described in § 2, for PBX 9502 rate sticks, the failure region is located between radii of 4 and 3.75 mm, while for slabs the failure region is located between thicknesses of 3.75 and 3.5 mm. Thus, at failure
 $R_{c}/T_{c}>1$
, whereas for the velocity-effect curves
 $R/T<1$
. As noted above, since DSD is based on a quasi-steady flow assumption while detonation failure involves an inherently unsteady process, the DSD construction is not suitable for describing failure limits. However, an extrapolation of the diameter- and thickness-effect curves shown in figure 13 into their corresponding regions of failure implies that a crossing would occur and that the ratio
 $R/T$
at failure in each geometry would become greater than one.
For the PBX 9502
 $D_{n}{-}{\it\kappa}$
relation (3.18), the
 $R/T$
scaling as a function of phase velocity
 $D_{0}$
is shown in figure 14 for no confinement (
 ${\it\phi}={\it\phi}_{s}$
) at the explosive edge. For
 $D_{0}$
close to
 $D_{CJ}$
, there is a rapid increase in
 $R/T$
. The ratio
 $R/T$
subsequently increases at a slower rate and then decreases. The region in which
 $R/T$
begins to decrease corresponds approximately to a regime where there is a change in slope in the diameter- and thickness-effect curves (figure 13). The change in slope occurs when the sonic plane in the non-planar PBX 9502 detonation has transitioned through the slow carbon coagulation reaction layer and subsequently resides close to the end of the fast heat release layer (Bdzil et al.
Reference Bdzil, Short, Sharpe, Aslam and Quirk2006). Thereafter the scale factor
 $R/T$
increases as
 $D_{0}$
decreases, reaching a value of
 $R/T=0.853$
when
 $D_{0}=7.1~\text{mm}~{\rm\mu}\text{s}^{-1}$
. Figure 15 shows the curvature components
 ${\it\kappa}_{s}$
and
 ${\it\kappa}_{a}$
and the normal detonation velocity
 $D_{n}$
as functions of the radius in the DSD rate-stick calculation for
 $D_{0}=7.5~\text{mm}~{\rm\mu}\text{s}^{-1}$
and
 ${\it\phi}={\it\phi}_{s}$
at
 $r=R$
. Over half of the radius
 ${\it\kappa}_{a}\approx {\it\kappa}_{s}$
, but subsequently the slab component increasingly grows in magnitude relative to the axisymmetric component. Again, the slab thickness-effect curve when plotted as
 $D_{0}$
versus
 $1/T$
lies to the left of the rate-stick diameter-effect curve plotted as
 $D_{0}$
versus
 $1/R$
(cf. § 3.1.2). The normal detonation velocity shows an order-one decrease in magnitude across the rate stick.
Variation of the PBX 9502 detonation phase velocity
 $D_{0}$
with the ratio of rate-stick radius
 $R$
to slab thickness
 $T$
that correspond to
 $D_{0}$
when
 ${\it\phi}={\it\phi}_{s}$
at the rate-stick or slab edge.

Slab
 ${\it\kappa}_{s}$
(red) and axisymmetric
 ${\it\kappa}_{a}$
(green) components of curvature, along with
 $D_{n}$
(blue), in a PBX 9502 rate stick from
 $r=0$
to
 $r=R$
, calculated when
 $D_{0}=7.5~\text{mm}~{\rm\mu}\text{s}^{-1}$
and
 ${\it\phi}={\it\phi}_{s}$
at
 $r=R$
.

The curvature components
 ${\it\kappa}_{s}$
and
 ${\it\kappa}_{a}$
as functions of radius in the PBX 9502 DSD rate-stick calculation for
 $D_{0}=7.75524~\text{mm}~{\rm\mu}\text{s}^{-1}$
and
 ${\it\phi}={\it\phi}_{s}$
at
 $r=R$
are shown in figure 16. This is in a regime in which
 $D_{0}\sim D_{CJ}$
, and for most of the rate stick the curvature components are small, but
 ${\it\kappa}_{s}>{\it\kappa}_{a}$
everywhere. As is the case for PBX 9501, the magnitude of the slab component
 ${\it\kappa}_{s}$
rises rapidly in a boundary layer at the edge of the rate-stick to meet the requirement that
 ${\it\phi}={\it\phi}_{s}$
.
Slab
 ${\it\kappa}_{s}$
(red) and axisymmetric
 ${\it\kappa}_{a}$
(green) components of curvature, along with
 $D_{n}$
(blue), in a PBX 9502 rate stick from
 $r=0$
to
 $r=R$
, calculated when
 $D_{0}=7.75524~\text{mm}~{\rm\mu}\text{s}^{-1}$
and
 ${\it\phi}={\it\phi}_{s}$
at
 $r=R$
: (a) full range of
 ${\it\kappa}_{s}$
,
 ${\it\kappa}_{a}$
and
 $D_{n}$
shown; (b) magnified region for
 $({\it\kappa}_{s},{\it\kappa}_{a})<0.0002$
.

Figure 17 shows the lower-order DSD-calculated ANFO size-effect curves using the
 $D_{n}{-}{\it\kappa}$
relation (3.18) with table 9 parameters for unconfined,
 ${\it\phi}={\it\phi}_{s}$
, rate-stick (
 $D_{0}$
versus
 $1/R$
) and slab (
 $D_{0}$
versus
 $1/T$
) geometries. The ANFO
 $D_{n}{-}{\it\kappa}$
calibration was obtained via use of the rate-stick data, and consequently a good fit between the DSD diameter-effect curve and the rate-stick data is observed. However, when plotted as
 $D_{0}$
versus
 $1/T$
, the lower-order DSD-predicted thickness-effect curve for the slab lies close to the diameter-effect curve for the rate stick, but is a poor fit to the experimental thickness-effect data points for the slab. Also shown are the ANFO diameter- and thickness-effect curves based on the higher-order DSD theory (3.23) and (3.28) with table 11 parameters. The thickness-effect curve for the slab geometry generated by the higher-order DSD theory (calibrated to the rate-stick diameter-effect data) provides a significantly better representation of the slab data than the curve obtained with the lower-order
 $D_{n}{-}{\it\kappa}$
theory. This includes the presence of an inflection point in the thickness-effect curve that also appears to be a property of the slab data. The deviation of the higher-order DSD size-effect curves from the data at larger HE dimensions is due to the value of
 $D_{CJ}=5.2~\text{km}~\text{s}^{-1}$
used in the calibration of the higher-order DSD relation (Bdzil et al.
Reference Bdzil, Aslam, Catanach, Hill and Short2002). This was obtained from an extrapolation based on the ‘dice throw’ series of large-scale ANFO tests (Helm et al.
Reference Helm, Finger, Hayes, Lee, Cheung and Walton1976). Subsequent analysis by Bdzil (2008, personal communication) of the more carefully controlled ANFO rate-stick test series (Bdzil et al.
Reference Bdzil, Aslam, Catanach, Hill and Short2002) led to the recommendation to lower
 $D_{CJ}$
to
 $4.8~\text{km}~\text{s}^{-1}$
, as used by Bdzil (2008, personal communication) in the calibration of the lower-order
 $D_{n}{-}{\it\kappa}$
form of the DSD relation for ANFO (table 9). This suggests that a recalibration of the higher-order DSD theory for ANFO based on a lower value of
 $D_{CJ}$
would result in even closer agreement between the size-effect predictions of the higher-order DSD theory and the experimental data.
Diameter- and thickness-effect variation for ANFO rate sticks (
 $D_{0}$
versus
 $1/R$
, ○) and ANFO slabs (
 $D_{0}$
versus
 $1/T$
, ▫), along with the corresponding rate-stick (solid blue line) and slab (solid red line) DSD predictions based on (3.18) and table 9. Also shown are the rate-stick (blue dashed line) and slab (red dashed line) ANFO size-effect predictions based on the higher-order DSD theory (3.23) and (3.28) with table 11 parameters.

The relative closeness of the lower-order
 $D_{n}{-}{\it\kappa}$
theory-based size-effect curves for the slab and rate-stick geometries, when plotted as
 $D_{0}$
versus
 $1/T$
and
 $D_{0}$
versus
 $1/R$
, respectively, points to a
 $R/T$
scaling of unity. This is reflected in figure 18, where
 $D_{0}$
is plotted as a function of the scale factor
 $R/T$
using the lower-order
 $D_{n}{-}{\it\kappa}$
DSD relation. There is a rapid increase in
 $R/T$
as
 $D_{0}$
decreases slightly from
 $D_{CJ}$
. The scale factor reaches a value of 0.951 when
 $D_{0}=4~\text{mm}~{\rm\mu}\text{s}^{-1}$
and a value of 0.996 when
 $D_{0}=1.5~\text{mm}~{\rm\mu}\text{s}^{-1}$
. Relative to the observed
 $R/T$
scale factor in the experimental size-effect data, the
 $D_{n}{-}{\it\kappa}$
calibration via (3.18) and table 9 assigns too much weight to the axisymmetric curvature component
 ${\it\kappa}_{a}$
. This is confirmed in figure 19, where the components
 ${\it\kappa}_{s}$
and
 ${\it\kappa}_{a}$
are plotted as functions of radius in the DSD rate-stick calculation for
 $D_{0}=2.5~\text{mm}~{\rm\mu}\text{s}^{-1}$
. It is clear that
 ${\it\kappa}_{s}\approx {\it\kappa}_{a}$
. Based on the discussion in § 3.1.2, in order to match the ANFO slab thickness-effect data, the slab curvature component across the rate stick should be significantly greater than the axisymmetric component. Also shown in figure 18 is the scale factor
 $R/T$
calculated from the higher-order DSD theory. Again there is a rapid increase in
 $R/T$
as
 $D_{0}$
decreases slightly from
 $D_{CJ}$
(
 $5.2~\text{mm}~{\rm\mu}\text{s}^{-1}$
in this case). Subsequently,
 $D_{0}$
drops significantly for a moderate change in the scale factor. For the higher-order DSD-based theory, the slab component of curvature is now significantly larger than the axisymmetric component across the rate stick (figure 20).
Variation of the ANFO detonation phase velocity
 $D_{0}$
with the ratio of rate-stick radius
 $(R)$
to slab thickness
 $(T)$
that correspond to
 $D_{0}$
when
 ${\it\phi}={\it\phi}_{s}$
at the rate-stick or slab edge. The red line is based on the lower-order
 $D_{n}{-}{\it\kappa}$
form (3.18), while the green line is from the higher-order DSD theory (3.25) and (3.28).

Slab
 ${\it\kappa}_{s}$
(red) and axisymmetric
 ${\it\kappa}_{a}$
(green) components of curvature, along with
 $D_{n}$
(blue), in an ANFO rate stick from
 $r=0$
to
 $r=R$
, calculated when
 $D_{0}=2.5~\text{mm}~{\rm\mu}\text{s}^{-1}$
for the lower-order
 $D_{n}{-}{\it\kappa}$
-based DSD theory.

Slab
 ${\it\kappa}_{s}$
(red) and axisymmetric
 ${\it\kappa}_{a}$
(green) components of curvature, along with
 $D_{n}$
(blue), in an ANFO rate stick from
 $r=0$
to
 $r=R$
, calculated when
 $D_{0}=2.5~\text{mm}~{\rm\mu}\text{s}^{-1}$
for the higher-order DSD theory.

The curvature components
 ${\it\kappa}_{s}$
and
 ${\it\kappa}_{a}$
as functions of radius for the ANFO lower-order
 $D_{n}{-}{\it\kappa}$
-based DSD rate-stick calculation for
 $D_{0}=4.799~\text{mm}~{\rm\mu}\text{s}^{-1}$
are shown in figure 21. As seen previously for PBX 9501 and PBX 9502, the magnitude of the slab component
 ${\it\kappa}_{s}$
rises rapidly in a boundary layer at the edge of the rate stick to meet the requirement that
 ${\it\phi}={\it\phi}_{s}$
.
Slab
 ${\it\kappa}_{s}$
(red) and axisymmetric
 ${\it\kappa}_{a}$
(green) components of curvature, along with
 $D_{n}$
(blue), in an ANFO rate stick from
 $r=0$
to
 $r=R$
, calculated when
 $D_{0}=4.799~\text{mm}~{\rm\mu}\text{s}^{-1}$
for the
 $D_{n}{-}{\it\kappa}$
-based theory.

4. Scaling behaviour for
$D_{0}\rightarrow D_{CJ}$

Here we conduct an asymptotic analysis of the lower-order DSD model in the limit where the detonation phase velocity
 $D_{0}$
approaches
 $D_{CJ}$
. The analysis provides detailed insight into both the dynamics behind the variation in the propagation scale factor
 $R/T$
and the multilayer behaviour of the DSD surface shapes for different degrees of confinement. Rather than the more complex forms studied in § 3, here we assume a
 $D_{n}{-}{\it\kappa}$
law of the linear form
 $$\begin{eqnarray}\frac{D_{n}}{D_{CJ}}=1-B{\it\kappa},\end{eqnarray}$$
which allows the solutions in individual layers to be derived analytically. Note that the parameter
 $B$
represents a length scale that is characteristic of the reaction zone thickness. We are interested in the limit
 $D_{0}\rightarrow D_{CJ}$
, and define a small parameter
 ${\it\epsilon}$
such that
 $$\begin{eqnarray}{\it\epsilon}=1-\frac{D_{0}}{D_{CJ}},\quad {\it\epsilon}\ll 1.\end{eqnarray}$$
Consequently, with (4.1) and (3.4), the scaled curvatures
 $B{\it\kappa}_{s}$
and
 $B{\it\kappa}_{a}$
become
 $$\begin{eqnarray}B{\it\kappa}_{s}=1-(1-{\it\epsilon})\cos {\it\phi},\quad B{\it\kappa}_{s}+\frac{\sin {\it\phi}}{(r/B)}=1-(1-{\it\epsilon})\cos {\it\phi}\end{eqnarray}$$
in the slab and rate-stick geometries, respectively.
4.1. Slab geometry
For the slab geometry, the differential equations (3.6a,b
) for
 $r({\it\phi})$
and
 $z({\it\phi})$
become
 $$\begin{eqnarray}[1-(1-{\it\epsilon})\cos {\it\phi}]\frac{\text{d}(r/B)}{\text{d}{\it\phi}}=\cos {\it\phi},\quad [1-(1-{\it\epsilon})\cos {\it\phi}]\frac{\text{d}(z/B)}{\text{d}{\it\phi}}=-\text{sin}\,{\it\phi},\end{eqnarray}$$
subject to the boundary conditions (3.7). Although these equations can be integrated exactly (Bdzil Reference Bdzil1981), we are interested in the structure of the solutions for
 ${\it\epsilon}\ll 1$
. We find an inner layer in the central part of the charge described by the scalings
 ${\it\phi}=\mathit{O}(\sqrt{{\it\epsilon}})$
,
 $r/B=\mathit{O}(1/\sqrt{{\it\epsilon}})$
and
 $z/B=\mathit{O}(1)$
, where
 $$\begin{eqnarray}\frac{r}{B}=\sqrt{\frac{2}{{\it\epsilon}}}\tan ^{-1}\left(\frac{{\it\phi}}{\sqrt{2{\it\epsilon}}}\right)+\mathit{O}(\sqrt{{\it\epsilon}}),\quad \frac{z}{B}=\ln 2-\text{ln}\left[2+\frac{{\it\phi}^{2}}{{\it\epsilon}}\right]+\mathit{O}({\it\epsilon}).\end{eqnarray}$$
In this layer the scaled curvature
 $B{\it\kappa}_{s}$
is
 $\mathit{O}({\it\epsilon})$
, while deviations of
 $D_{n}$
from
 $D_{CJ}$
are
 $\mathit{O}({\it\epsilon})$
. Specifically, in terms of
 ${\it\phi}$
,
 $$\begin{eqnarray}B{\it\kappa}_{s}={\it\epsilon}\left(1+\frac{{\it\phi}^{2}}{2{\it\epsilon}}\right)+\mathit{O}({\it\epsilon}^{2}),\quad D_{n}=D_{CJ}\left[1-{\it\epsilon}\left(1+\frac{{\it\phi}^{2}}{2{\it\epsilon}}\right)\right]+\mathit{O}({\it\epsilon}^{2}).\end{eqnarray}$$
If the degree of confinement is such that
 ${\it\phi}_{edge}=\mathit{O}(\sqrt{{\it\epsilon}})$
, (4.5) describes the solution from the charge centre to the charge edge. Note that contained within the inner layer is a region of size
 ${\it\phi}=\mathit{O}({\it\epsilon})$
around
 $r=0$
where
 $r/B=\mathit{O}(1)$
and
 $z/B=\mathit{O}({\it\epsilon})$
, in which
 $$\begin{eqnarray}\frac{r}{B}\sim \frac{{\it\phi}}{{\it\epsilon}},\quad \frac{z}{B}\sim -\frac{{\it\phi}^{2}}{2{\it\epsilon}},\quad B{\it\kappa}_{s}\sim {\it\epsilon},\quad D_{n}=D_{CJ}(1-{\it\epsilon}).\end{eqnarray}$$
For
 ${\it\phi}_{edge}=\mathit{O}(1)$
, an outer layer must be appended to the inner layer which extends to the edge of the charge. In this layer,
 ${\it\phi}=\mathit{O}(1)$
,
 $r/B=\mathit{O}(1/\sqrt{{\it\epsilon}})$
and
 $z/B=\mathit{O}(\ln (1/{\it\epsilon}))$
, where
 $$\begin{eqnarray}\frac{r}{B}=\frac{{\rm\pi}}{\sqrt{2{\it\epsilon}}}-{\it\phi}-\frac{1}{\tan ({\it\phi}/2)}+\mathit{O}(\sqrt{{\it\epsilon}}),\quad \frac{z}{B}=-\text{ln}(1/{\it\epsilon})-\text{ln}(1-\cos {\it\phi})+\mathit{O}({\it\epsilon}\ln (1/{\it\epsilon}))\end{eqnarray}$$
after matching with (4.5). Correspondingly, the scaled curvature
 $B{\it\kappa}_{s}$
is
 $\mathit{O}(1)$
, while deviations of
 $D_{n}$
from
 $D_{CJ}$
are
 $\mathit{O}(1)$
; specifically,
 $$\begin{eqnarray}B{\it\kappa}_{s}=1-\cos {\it\phi}+\mathit{O}({\it\epsilon}),\quad D_{n}=D_{CJ}\cos {\it\phi}+\mathit{O}({\it\epsilon}).\end{eqnarray}$$
A composite solution can be derived for
 $r({\it\phi})/B$
as
 $$\begin{eqnarray}\frac{r}{B}=\sqrt{\frac{2}{{\it\epsilon}}}\tan ^{-1}\left(\frac{{\it\phi}}{\sqrt{2{\it\epsilon}}}\right)-{\it\phi}-\frac{1}{\tan ({\it\phi}/2)}+\frac{2}{{\it\phi}},\end{eqnarray}$$
while for
 $z({\it\phi})/B$
,
 $$\begin{eqnarray}\frac{z}{B}=-\text{ln}(1-\cos {\it\phi})-\text{ln}\left[2+\frac{{\it\phi}^{2}}{{\it\epsilon}}\right]+2\ln {\it\phi}.\end{eqnarray}$$
4.2. Rate-stick geometry
For the rate-stick geometry, the differential equation (3.6a
) for
 $r({\it\phi})/B$
becomes
 $$\begin{eqnarray}\left[1-(1-{\it\epsilon})\cos {\it\phi}-\frac{\sin {\it\phi}}{(r/B)}\right]\frac{\text{d}(r/B)}{\text{d}{\it\phi}}=\cos {\it\phi}.\end{eqnarray}$$
We again find an inner layer in the central part of the charge where
 ${\it\phi}=\mathit{O}(\sqrt{{\it\epsilon}})$
and
 $r/B=\mathit{O}(1/\sqrt{{\it\epsilon}})$
. Defining
 $$\begin{eqnarray}\hat{{\it\phi}}=\frac{{\it\phi}}{\sqrt{{\it\epsilon}}},\quad \frac{\hat{r}}{B}=\frac{\sqrt{{\it\epsilon}}r}{B},\quad \frac{\hat{r}}{B}\sim \frac{\hat{r}_{0}}{B}+\mathit{O}({\it\epsilon})\end{eqnarray}$$
and using (4.12), the equation governing
 $\hat{r}_{0}/B$
is given by
 $$\begin{eqnarray}\left(1+\frac{\hat{{\it\phi}}^{2}}{2}-\frac{\hat{{\it\phi}}}{(\hat{r}_{0}/B)}\right)\frac{\text{d}(\hat{r}_{0}/B)}{\text{d}\hat{{\it\phi}}}=1.\end{eqnarray}$$
The solution is
 $$\begin{eqnarray}\hat{{\it\phi}}=\frac{\sqrt{2}J_{1}(\hat{r}_{0}/\sqrt{2}B)}{J_{0}(\hat{r}_{0}/\sqrt{2}B)},\end{eqnarray}$$
where
 $J_{0}$
and
 $J_{1}$
are the order-zero and order-one Bessel functions of the first kind. In this layer, the scaled curvatures
 $B{\it\kappa}_{s}$
and
 $B{\it\kappa}_{a}$
are
 $\mathit{O}({\it\epsilon})$
, and deviations of
 $D_{n}$
from
 $D_{CJ}$
are
 $\mathit{O}({\it\epsilon})$
. Specifically, in terms of
 ${\it\phi}$
,
 $$\begin{eqnarray}\displaystyle \left.\begin{array}{@{}c@{}}\displaystyle B{\it\kappa}_{s}\sim -{\it\epsilon}\frac{({\it\phi}/\sqrt{{\it\epsilon}})}{(\hat{r}_{0}/B)}+{\it\epsilon}\left(1+\frac{{\it\phi}^{2}}{2{\it\epsilon}}\right),\quad B{\it\kappa}_{a}\sim {\it\epsilon}\frac{({\it\phi}/\sqrt{{\it\epsilon}})}{(\hat{r}_{0}/B)},\\ \displaystyle D_{n}\sim D_{CJ}\left[1-{\it\epsilon}\left(1+\frac{{\it\phi}^{2}}{2{\it\epsilon}}\right)\right].\end{array}\right\} & & \displaystyle\end{eqnarray}$$
As for the slab geometry, contained within the inner layer is a region near
 $r=0$
where
 ${\it\phi}=\mathit{O}({\it\epsilon})$
, in which
 $$\begin{eqnarray}\frac{r}{B}\sim \frac{2{\it\phi}}{{\it\epsilon}},\quad B{\it\kappa}_{s}\sim \frac{{\it\epsilon}}{2},\quad B{\it\kappa}_{a}\sim \frac{{\it\epsilon}}{2},\quad D_{0}\sim D_{CJ}(1-{\it\epsilon}).\end{eqnarray}$$
For
 ${\it\phi}_{edge}=\mathit{O}(1)$
, we must again insert an outer layer which extends to the edge of the charge. As for the slab geometry,
 ${\it\phi}=\mathit{O}(1)$
and
 $r/B=\mathit{O}(1/\sqrt{{\it\epsilon}})$
. With these scalings, the axisymmetric curvature component is
 $$\begin{eqnarray}B{\it\kappa}_{a}=\frac{\sin {\it\phi}}{(r/B)}=\mathit{O}(\sqrt{{\it\epsilon}}),\end{eqnarray}$$
and thus, up to
 $\mathit{O}(\sqrt{{\it\epsilon}})$
, the rate-stick solution describing the variation of
 $r/B$
with
 ${\it\phi}$
has a similar form to the slab solution in the outer layer. Matching with the inner layer gives
 $$\begin{eqnarray}\frac{r}{B}=\frac{\sqrt{2}{\it\beta}}{\sqrt{{\it\epsilon}}}-{\it\phi}-\frac{1}{\tan ({\it\phi}/2)}+\mathit{O}(\sqrt{{\it\epsilon}}),\end{eqnarray}$$
where
 ${\it\beta}\approx 2.40483$
is the first positive zero of
 $J_{0}({\it\beta})$
. In the outer layer, the scaled slab curvature component
 $B{\it\kappa}_{s}$
is
 $\mathit{O}(1)$
, the scaled axisymmetric component
 $B{\it\kappa}_{a}$
is
 $\mathit{O}(\sqrt{{\it\epsilon}})$
, while deviations of
 $D_{n}$
from
 $D_{CJ}$
are
 $\mathit{O}(1)$
; specifically,
 $$\begin{eqnarray}B{\it\kappa}_{s}=1-\cos {\it\phi}+\mathit{O}(\sqrt{{\it\epsilon}}),\quad D_{n}=D_{CJ}\cos {\it\phi}+\mathit{O}({\it\epsilon}).\end{eqnarray}$$
A composite solution can be written as
 $$\begin{eqnarray}\frac{r}{B}=\frac{r_{0}({\it\phi})}{B}-{\it\phi}-\frac{1}{\tan ({\it\phi}/2)}+\frac{2}{{\it\phi}},\end{eqnarray}$$
where
 $r_{0}/B$
is the solution to
 $$\begin{eqnarray}\frac{{\it\phi}}{\sqrt{{\it\epsilon}}}=\frac{\sqrt{2}J_{1}(\sqrt{{\it\epsilon}}r_{0}/\sqrt{2}B)}{J_{0}(\sqrt{{\it\epsilon}}r_{0}/\sqrt{2}B)}.\end{eqnarray}$$
Also, for the rate stick, the differential equation (3.6b
) for
 $z({\it\phi})/B$
is
 $$\begin{eqnarray}\left[1-(1-{\it\epsilon})\cos {\it\phi}-\frac{\sin {\it\phi}}{(r/B)}\right]\frac{\text{d}(z/B)}{\text{d}{\it\phi}}=-\sin {\it\phi},\quad \text{or}\quad \frac{\text{d}(z/B)}{\text{d}(r/B)}=-\tan {\it\phi}.\end{eqnarray}$$
In the inner layer, where
 ${\it\phi}=\mathit{O}(\sqrt{{\it\epsilon}})$
,
 $r/B=\mathit{O}(1/\sqrt{{\it\epsilon}})$
and
 $z/B=\mathit{O}(1)$
, we find that to leading order,
 $$\begin{eqnarray}\frac{z}{B}\sim 2\ln \left[J_{0}\left(\frac{\sqrt{{\it\epsilon}}r_{0}}{\sqrt{2}B}\right)\right],\end{eqnarray}$$
where
 $r_{0}({\it\phi})/B$
is again the solution to (4.22). Contained within this inner layer is a region near
 $z=0$
where
 ${\it\phi}=\mathit{O}({\it\epsilon})$
, in which
 $$\begin{eqnarray}\frac{z}{B}\sim -\frac{{\it\phi}^{2}}{{\it\epsilon}}.\end{eqnarray}$$
In the outer layer, where
 ${\it\phi}=\mathit{O}(1)$
,
 $r/B=\mathit{O}(1/\sqrt{{\it\epsilon}})$
and
 $z/B=\mathit{O}(1)$
, after matching with (4.24) we find that
 $$\begin{eqnarray}\frac{z}{B}\sim -\text{ln}(1/{\it\epsilon})+2\ln [J_{1}({\it\beta})]-\text{ln}(1-\cos {\it\phi}).\end{eqnarray}$$
A composite solution can be written as
 $$\begin{eqnarray}\frac{z}{B}=-\text{ln}(1-\cos {\it\phi})+2\text{ln}\left[\frac{{\it\phi}}{\sqrt{2}}J_{0}\left(\frac{\sqrt{{\it\epsilon}}r_{0}}{\sqrt{2}B}\right)\right].\end{eqnarray}$$
4.3. Scaling factors
The asymptotic analysis above reveals three cases of interest for the scaling factor ratio
 $R/T$
:
Case 1: strong confinement defined by
 ${\it\phi}_{edge}=\mathit{O}({\it\epsilon})$
.
In this case, there is a single layer describing the solution for
 $0\leqslant {\it\phi}\leqslant {\it\phi}_{edge}$
, given by (4.7) for the slab geometry and (4.17) for the rate-stick geometry. Relative to the length scale
 $B$
, the rate-stick diameter and slab height are both
 $\mathit{O}(1)$
. In the rate stick, the
 $\mathit{O}({\it\epsilon})$
slab
 $B{\it\kappa}_{s}$
and axisymmetric
 $B{\it\kappa}_{a}$
components of curvature are equal across the charge, i.e.
 ${\it\kappa}_{s}/{\it\kappa}_{a}\sim 1$
for
 $0\leqslant {\it\phi}\leqslant {\it\phi}_{edge}$
. It then follows from (4.7) and (4.17) that
 $$\begin{eqnarray}1-R/T=\mathit{O}({\it\epsilon})>0,\end{eqnarray}$$
i.e. the scale factor is unity to leading order for strong confinement defined by
 ${\it\phi}_{edge}=\mathit{O}({\it\epsilon})$
. Specifically, to
 $\mathit{O}({\it\epsilon})$
, it can be shown that
 $R/T\sim 1-{\it\phi}^{2}/12{\it\epsilon}$
.
Case 2: moderately strong confinement defined by
 ${\it\phi}_{edge}=\mathit{O}(\sqrt{{\it\epsilon}})$
.
In this case, there is again a single layer describing the solution for
 $0\leqslant {\it\phi}\leqslant {\it\phi}_{edge}$
, given by (4.5) for the slab geometry and (4.22) for the rate-stick geometry. Relative to the length scale
 $B$
, the rate-stick diameter and slab height are both
 $\mathit{O}(1/\sqrt{{\it\epsilon}})$
. In the rate stick, the scaled slab and axisymmetric curvature components are again of size
 $\mathit{O}({\it\epsilon})$
. However, in a region of this layer defined by
 $\mathit{O}({\it\epsilon})<{\it\phi}\leqslant {\it\phi}_{edge}$
, the two curvature components are no longer equal. Moreover,
 ${\it\kappa}_{s}/{\it\kappa}_{a}>1$
by (4.16), with the ratio
 ${\it\kappa}_{s}/{\it\kappa}_{a}$
increasing as
 ${\it\phi}$
increases. The fact that the curvature components are different in the region
 $\mathit{O}({\it\epsilon})<{\it\phi}\leqslant {\it\phi}_{edge}$
drives the scale factor below unity by
 $\mathit{O}(1)$
amounts, i.e.
 $$\begin{eqnarray}1-R/T=\mathit{O}(1)>0\end{eqnarray}$$
for moderately strong confinement defined by
 ${\it\phi}_{edge}=\mathit{O}(\sqrt{{\it\epsilon}})$
. The actual value of the ratio
 $R/T$
is determined through (4.5) and (4.22).
Case 3: weak or no confinement defined by
 ${\it\phi}_{edge}=\mathit{O}(1)$
.
In this case, the solution for
 $0\leqslant {\it\phi}\leqslant {\it\phi}_{edge}$
is described by two layers. The inner layer, represented by case 2 above for
 ${\it\phi}=\mathit{O}(\sqrt{{\it\epsilon}})$
, is joined to an outer layer where
 ${\it\phi}=\mathit{O}(1)$
. Relative to the length scale
 $B$
, the rate-stick diameter and slab height are again both
 $\mathit{O}(1/\sqrt{{\it\epsilon}})$
. The composite solutions for
 $0\leqslant {\it\phi}\leqslant {\it\phi}_{edge}$
when
 ${\it\phi}_{edge}=\mathit{O}(1)$
are given by (4.10) and (4.21). Significantly, in the outer layer, the curvature is dominated by the slab component where
 $B{\it\kappa}_{s}=\mathit{O}(1)$
while
 $B{\it\kappa}_{a}=\mathit{O}(\sqrt{{\it\epsilon}})$
. The outer-layer solutions (4.8) and (4.19) describing the extent of the slab and rate-stick charge size when
 ${\it\phi}_{edge}=\mathit{O}(1)$
show that in both cases the charge extent becomes independent of
 ${\it\phi}$
to leading order. Consequently, the scaling factor ratio
 $R/T$
is constant to leading order. Specifically, we find that
 $$\begin{eqnarray}R/T=\frac{{\it\beta}}{{\rm\pi}}+\mathit{O}({\it\epsilon}),\end{eqnarray}$$
where
 ${\it\beta}/{\rm\pi}\approx 0.7655$
, for weak or no confinement defined by
 ${\it\phi}_{edge}=\mathit{O}(1)$
. The specific value of the edge confinement angle influences the scaling factor ratio at
 $\mathit{O}({\it\epsilon})$
.
Figure 22 shows the variation of slab thickness and rate-stick radius as functions of
 ${\it\phi}$
for the linear
 $D_{n}{-}{\it\kappa}$
law (4.1) with parameters
 $B=0.1~\text{cm}$
and
 $D_{CJ}=0.775525188~\text{cm}~{\rm\mu}\text{s}^{-1}$
(this
 $D_{CJ}$
is the PBX 9502 value from table 9) at a fixed phase velocity of
 $D_{0}=0.775~\text{cm}~{\rm\mu}\text{s}^{-1}$
 $({\it\epsilon}=6.772\times 10^{-4})$
, calculated using the composite solutions (4.10) and (4.21) and also numerical solutions of (3.6) for the slab and rate-stick geometries. The agreement between the asymptotic and numerical solutions is excellent. Figure 23 shows the corresponding variation with
 ${\it\phi}$
of
 $z$
from the rate-stick geometry and
 $2z$
from the slab geometry. The factor of 2 in the slab geometry ensures that the ratio
 $z\,\text{(rate-stick)}/2z\,\text{(slab)}\sim 1$
in the layer where
 ${\it\phi}=\mathit{O}({\it\epsilon})$
, based on (4.7) and (4.25). Again, the agreement between the composite solutions (4.11) and (4.27) and the numerical solutions of (3.6) is excellent.
Comparison of the composite solutions (4.10) and (4.21) (dashed lines) with numerical solutions of (3.6) (solid lines) for slab thickness (red lines) and rate-stick radius (blue lines) as functions of
 ${\it\phi}$
. Here
 $B=0.1~\text{cm}$
and
 $D_{CJ}=0.775525188~\text{cm}~{\rm\mu}\text{s}^{-1}$
at a fixed phase velocity of
 $D_{0}=0.775~\text{cm}~{\rm\mu}\text{s}^{-1}$
 $({\it\epsilon}=6.772\times 10^{-4})$
. The corresponding composite and numerical solutions overlay in the plot.

Comparison of the variation with respect to
 ${\it\phi}$
of
 $z$
from the rate-stick geometry (blue lines) and
 $2z$
from the slab geometry (red lines) corresponding to figure 22 for composite solutions (4.11) and (4.27) (dashed lines) and numerical solutions of (3.6) (solid lines). Again, the corresponding composite and numerical solutions overlay in the plot.

Figure 24 compares the variation of the scale factor
 $R/T$
with
 ${\it\phi}$
derived from the composite solutions (4.10) and (4.21) (dashed line) and from numerical solutions of (3.6) (solid lines). The ratio
 $R/T$
is observed to decrease rapidly for small
 ${\it\phi}$
before approaching close to the limit defined by (4.30). Figure 25 shows the corresponding variation in the ratio of
 $z$
from the rate-stick geometry and
 $2z$
from the slab geometry for the composite solutions (4.11) and (4.27) and a numerical solution of (3.6). A rapid drop in the ratio is observed for small
 ${\it\phi}$
, and then it decreases more slowly for larger
 ${\it\phi}$
. Note that for sufficiently small
 ${\it\epsilon}$
the outer-layer solutions for
 $z$
, (4.8) and (4.26), indicate that
 $z\,(\text{rate-stick})/2z\,(\text{slab})\sim 1/2$
when
 ${\it\phi}_{edge}=\mathit{O}(1)$
. In both figures, the agreement between the asymptotic and numerical solutions is excellent.
Comparison of the variation of the scale factor
 $R/T$
with
 ${\it\phi}$
derived from the composite solutions (4.10) and (4.21) (dashed line) and from numerical solutions of (3.6) (solid lines). Here
 $B=0.1~\text{cm}$
and
 $D_{CJ}=0.775525188~\text{cm}~{\rm\mu}\text{s}^{-1}$
at a fixed phase velocity of
 $D_{0}=0.775~\text{cm}~{\rm\mu}\text{s}^{-1}$
 $({\it\epsilon}=6.772\times 10^{-4})$
. The composite and numerical solutions almost overlay in the plot.

Comparison of the variation with
 ${\it\phi}$
of the ratio of
 $z$
from the rate-stick geometry and
 $2z$
from the slab geometry corresponding to figure 24 for the composite solutions (4.11) and (4.27) (dashed lines) and a numerical solution of (3.6) (solid lines). Again, the composite and numerical solutions overlay in the plot.

Figure 26 compares the variation of the scale factor
 $R/T$
with
 $D_{0}$
derived from the composite solutions (4.10) and (4.21) and from a numerical solution of (3.6) for an
 $\mathit{O}(1)$
edge angle
 ${\it\phi}_{edge}=0.7033841$
. For small
 ${\it\epsilon}$
, the composite and numerical solutions are in good agreement. As
 ${\it\epsilon}$
increases the solutions diverge, but the asymptotic solutions still provide a reasonable approximation to the numerical solution even at values of
 $D_{0}$
significantly below
 $D_{CJ}$
(at
 $D_{0}=7~\text{mm}~{\rm\mu}\text{s}^{-1}$
,
 ${\it\epsilon}=0.0974$
).
Variation of scale factor
 $R/T$
with changes in
 $D_{0}$
in the case where
 $B=0.1~\text{cm}$
and
 $D_{CJ}=0.775525188~\text{cm}~{\rm\mu}\text{s}^{-1}$
, for an edge angle
 ${\it\phi}_{edge}=0.7033841$
. A composite solution from (4.10) and (4.21) (dashed line) and a numerical solution of (3.6) (solid line) are shown.

5. Summary
Detonation-velocity thickness-effect curves were experimentally measured for ideal (PBX 9501), insensitive (PBX 9502) and non-ideal (ANFO) HEs by propagating detonation in a rectangular slab geometry. These data allowed examination of the geometric scaling factor
 $R(D_{0})/T(D_{0})$
when compared with previous diameter-effect data obtained from a cylindrical rate-stick geometry. The diameter- and thickness-effect data yielded a varying scaling value that was always such that
 $R(D_{0})/T(D_{0})<1$
for all explosives studied.
For PBX 9501 and PBX 9502, the lower-order form of the DSD model was found to provide a good approximation to the observed
 $R(D_{0})/T(D_{0})<1$
behaviour, and explains why, due to the difference in slab and axisymmetric components of curvature in the rate-stick configuration, a curvature-based theory should in general predict a scaling different from
 $R(D_{0})/T(D_{0})=1$
. For the non-ideal explosive ANFO, the lower-order DSD model did not reproduce the observed
 $R(D_{0})/T(D_{0})$
scaling. A higher-order DSD theory, which includes contributions due to detonation front acceleration and transverse flow, was found to be required to reproduce the experimental scaling. An asymptotic analysis of the lower-order DSD model provided insights into the behaviour of the geometric scaling factor
 $R(D_{0})/T(D_{0})$
when the detonation phase velocity approaches the CJ detonation velocity. Three cases were identified for different degrees of explosive confinement, yielding
 $R(D_{0})/T(D_{0})$
values that increasingly descended from a near-unity value with increasing charge edge angle, limiting to a constant value for
 $\mathit{O}(1)$
edge angles.
Comparisons of diameter- and thickness-effect curves provide fundamental validation of the predictive capability of detonation models such as DSD when model calibration is conducted using data from one geometry and then used to predict detonation-velocity effect curves in a different geometry. The thickness-effect data indicated that improved DSD model calibrations are needed for ANFO and low-velocity PBX 9501 detonation.
Acknowledgements
The authors are very grateful to the referees for a number of suggestions that have resulted in an improved paper. The authors are also grateful to S. Vincent, B. Olinger and S. Hagelberg for assistance with the experiments and HE manufacturing.