This study analyzes regional vowel variation in Standard Dutch pronunciation and compares traditional sociophonetic techniques for formant analysis of vowels with those taking into account the dynamics of the formants over time. The data to be discussed come from a study on regional variation in the pronunciation of Standard Dutch (Van de Velde, Kissine, Tops, Van der Harst, & Van Hout, Reference Van de Velde, Kissine, Tops, Van der Harst and Van Hout2010). Though Standard Dutch was originally defined as Dutch devoid of any regional traces (Van Haeringen, Reference Van Haeringen1924:65), the standard as it is actually spoken is not free of regional variation. On the morphosyntactic and lexical level, Dutch is tightly standardized and regional differences are small, whereas on the phonetic level, differences between regions are larger (Adank, Van Hout, & Van de Velde, Reference Adank, Van Hout and Van de Velde2007; Grondelaers & Van Hout, Reference Grondelaers and Van Hout2010; Van de Velde et al., Reference Van de Velde, Kissine, Tops, Van der Harst and Van Hout2010). First, there are two diverging pronunciation standards in two countries in the Dutch language area: Netherlandic Dutch in the Netherlands and Flemish (or Belgian) Dutch in Flanders, the northern part of Belgium (Van de Velde, Reference Van de Velde1996). Second, it was observed that, also within the two countries, speakers of the standard language, for example, newsreaders (Smakman, Reference Smakman2006), politicians, and teachers of Dutch (Grondelaers, Van Hout, & Steegs, Reference Grondelaers, Van Hout and Steegs2010; Pinget, Rotteveel, & Van de Velde, unpublished), clearly exhibit regional traces in their speech. In the current study, the speech of trained language professionals, that is, teachers of Dutch in secondary schools, was investigated and in particular their performance in reading aloud a word list that contained all Dutch vowels.
It will be shown that the dynamics of formant trajectories provides essential information in the sociophonetic study of vowel variation. We will compare three methods to measure vowel formants. Under the heading of the target approach, we measure monophthongs at one point in time and diphthongs at two points in time, following present-day sociophonetic practice (Thomas, Reference Thomas2011:150). The approaches to be qualified as dynamic can be split up in two alternatives depending on the way the time track is handled, by a series of successive time points (multiple time point approach) or by estimating a continuous time function, that is, by a regression approach, fitting polynomial regression equations to formant contours and using regression coefficients to describe the formant time track.
How do these approaches perform in distinguishing the regional origins of speakers of Standard Dutch who all read a systematically constructed word list? Self-monitoring is high in such a task, resulting in formal speech that is more limited in its range of regional accent than spontaneous speech is (cf. Labov's, Reference Labov1972, definition of style), but we are in need of a clear and complete set of vowel pronunciations to evaluate the different approaches. Interestingly, it has been reported that in carefully articulated speech (i.e., reading style) vowels show more formant movement than they do in conversational speech (Ferguson & Kewley-Port, Reference Ferguson and Kewley-Port2002). It could imply that a formal reading style still contains cues to distinguish regional differences on the basis of the dynamics of vowels, even though some sources of variation may be more restricted than in spontaneous speech. Adank et al. (Reference Adank, Van Hout and Van de Velde2007) found clear regional patterns of variation for the same set of speakers using a target approach to analyze the results of an even more monitored reading task triggering logatomes.
Several studies point to the added value of including formant trajectories in studying differences between speakers, even in monophthongs. Some forensic linguists have used formant dynamics for monophthongs successfully in speaker recognition (e.g., McDougall & Nolan, Reference McDougall, Nolan, Trouvain and Barry2007). Clopper, Pisoni, and De Jong (Reference Clopper, Pisoni and de Jong2005:1674) noted that “a preliminary inspection of the trajectories suggests that additional variation may also be present in how talkers from different regions manipulate spectral change to maintain vowel contrasts.” Hillenbrand, Clark, and Nearey (Reference Hillenbrand, Clarke and Nearey2001:758) showed that the vowel category of a monophthong can be better predicted when using formant values from two time points in a token than only taking single steady-state values as predictors (see also Neel, Reference Neel2008). However, Harrington and Cassidy (Reference Harrington and Cassidy1994) found that monophthongs in Australian English do not benefit from a three–time points representation compared to a single–time point representation, but this might be due to a difference in method. Whereas Hillenbrand et al. (Reference Hillenbrand, Clarke and Nearey2001) only used the first three formants to represent monophthongs, Harrington and Cassidy (Reference Harrington and Cassidy1994) used spectral bands ranging from 300 to 5250 Hz. The latter include a considerable amount of additional information—information that does not improve vowel recognition—whereas the former only uses formants that have been shown to be of crucial importance for vowel distinctions (Harrington, Reference Harrington, Laver and Hardcastle2010).
MEASURING THE FORMANTS OF VOWELS
Target approach: Monophthongs
A monophthong is defined as a vowel that has only one steady state, or target configuration (Clark, Yallop, & Fletcher, Reference Clark, Yallop and Fletcher2007; Harrington, Reference Harrington, Laver and Hardcastle2010; Ladefoged & Maddieson, Reference Ladefoged and Maddieson1996; Laver, Reference Laver1994). Harrington (Reference Harrington, Laver and Hardcastle2010:85) defined a vowel target as “a single time point that in monophthongs typically occurs nearest to the vowel's temporal midpoint, or a section of the vowel (again near the temporal midpoint) that shows the smallest degree of spectral change and which is part of the vowel least influenced by . . . contextual effects.” (Socio)phoneticians and language variationists commonly describe monophthongs acoustically with a single value per formant.
Several methods have been discussed to select the single time point that characterizes the vowel best (see, e.g., Harrington, Reference Harrington, Laver and Hardcastle2010; Harrington & Cassidy, Reference Harrington and Cassidy1999; Thomas, Reference Thomas2011; Van Son & Pols, Reference Van Son and Pols1990). We opted for the temporal midpoint of the vowel, which is presumed to be close to the vowel target (Harrington, Reference Harrington, Laver and Hardcastle2010; Harrington & Cassidy, Reference Harrington and Cassidy1999:60). This is the most common method in sociophonetic studies on vowel variation (e.g., Adank et al., Reference Adank, Van Hout and Van de Velde2007; Jacobi, Reference Jacobi2009; Torgersen & Kerswill, Reference Torgersen and Kerswill2004), with the notable exception of Labov and colleagues (Labov, Reference Labov1994, Reference Labov2001, Reference Labov2010; Labov, Ash, & Boberg, Reference Labov, Ash and Boberg2006). It is also the most straightforward method for our purposes, as a uniform criterion is used for all vowels, enabling objective comparison of vowels within and between varieties.
Target approach: Diphthongs
A diphthong is often defined as a vowel that exhibits two targets (Clark et al., Reference Clark, Yallop and Fletcher2007; Harrington, Reference Harrington, Laver and Hardcastle2010; Laver, Reference Laver1994) that differ from each other (Ladefoged & Maddieson, Reference Ladefoged and Maddieson1996). The second target is less stable due to contextual influence and undershoot (Gay, Reference Gay1968; Harrington & Cassidy, Reference Harrington and Cassidy1999). Recent phonetic and variationist studies often represent diphthongs by formant values at two time points, at the onset and offset of the vowel (e.g., Adank et al., Reference Adank, Van Hout and Van de Velde2007; Clopper et al., Reference Clopper, Pisoni and de Jong2005; Harrington, Reference Harrington, Laver and Hardcastle2010; Jacobi, Reference Jacobi2009; Thomas, Reference Thomas2011), or by an onset value and a glide value (Thomas, Reference Thomas2003; Thomas & Kendall, Reference Thomas and Kendall2007; Van Heuven, Edelman, & Van Bezooijen, Reference Van Heuven, Edelman and Van Bezooijen2002). Yet, some researchers select one time point to represent diphthongs (e.g., Labov, Reference Labov1994, Reference Labov2001, Reference Labov2010; Labov et al., Reference Labov, Ash and Boberg2006). However, as diphthongs have a dynamic nature (Holbrook & Fairbanks, Reference Holbrook and Fairbanks1962), several studies take this dynamicity into account by using multiple time points. Most of these studies focus on vowel dynamics in relation to perception (e.g., Jacewicz, Fujimura, & Fox, Reference Jacewicz, Fujimura, Fox, Sole, Recasens and Romero2003; Nábĕlek & Ovchinnikov, Reference Nábĕlek and Ovchinnikov1997; Peeters, Reference Peeters1991; Weismer & Berry, Reference Weismer and Berry2003), or specific subjects (e.g., forensic linguistics, Rose, Reference Rose, Warren and Watson2006).
In the target approach, we opted to measure the diphthongs at 25% (i.e., the onset) and 75% of the duration of the vowel. However, measuring the formants of diphthongs at two time points might not be enough to capture the spectral changes within these vowels, which is supported by forensic linguistic studies (Rose, Reference Rose, Warren and Watson2006) and perception studies (Peeters, Reference Peeters1991). In comparing German, Dutch, and English diphthongs, Peeters (Reference Peeters1991) showed that some of them could not be distinguished on the basis of onset and offset formant values, whereas they were perceptually clearly different. Information on the formant dynamics showed that the diphthongs indeed differed acoustically between languages. The question arises whether this type of formant dynamics also plays a role in detecting regional variation within languages.
Dynamic approaches
Sociophonetic studies often use single–time point representations for monophthongs and two–time point measurements for diphthongs (hence, target approaches). However, approaches that incorporate (more) trajectory or temporal information about vowel dynamics (hence, dynamic approaches), as used in forensic linguistics, seem to be needed to obtain a fuller view of the sociolinguistic variation in vowels and vowel systems. Thomas concluded, however, that with a larger number of time points, “the formant measures can wander in seemingly erratic directions through the course of a vowel” (Thomas, Reference Thomas2011:150), which is largely due to the influence of harmonics on Linear Predictive Coding (LPC) readings (Di Paolo, Yaeger-Dror, & Wassink, Reference Di Paolo, Yaeger-Dror, Wassink, Di Paolo and Yaeger-Dror2011; Vallabha & Tuller, Reference Vallabha and Tuller2002:145–146). We presume that a systematic approach to the time trajectories of vowel formants can extract additional and even substantial information that is relevant in investigating language variation.
The two dynamic approaches we want to investigate are the multiple time point approach and the regression approach. In the former approach vowels are measured at more than one (for monophthongs) or two time points (for diphthongs). In the latter approach, dynamic differences between speakers are quantified by fitting polynomial equations to formant contours to obtain time-related functions (cf. McDougall & Nolan, Reference McDougall, Nolan, Trouvain and Barry2007). A regression method can be used to fit the F1 and F2 contours of vowel tokens by applying linear (Equation (1)), quadratic (Equation (2)), cubic (Equation (3)), or even higher degree polynomials. The advantage of cubic polynomials is that they are able to capture asymmetries in the formant movement, whereas for quadratic regressions the rate of change in formant values is heavily influenced by the maximum or minimum value. The linear method is not suited for modeling minimum or maximum formant values unless they are at the onset or offset of the vowel. The functions can be written as follows:
 $$y=a_0 + a_1 t$$
 $$y=b_0 + b_1 t + b_2 t^2$$
 $$y=c_0 + c_1 t + c_2 t^2 + c_3 t^3$$
In these equations, y represents the formant value, t is the time point, and a 0, a 1 and b 0, b 1, b 2, and c 0, c 1, c 2, c 3 are the regression coefficients that are entered as predictors in the analysis for the linear, quadratic, and cubic regression, respectively. Time is a continuous function, which can be estimated by using multiple time points.
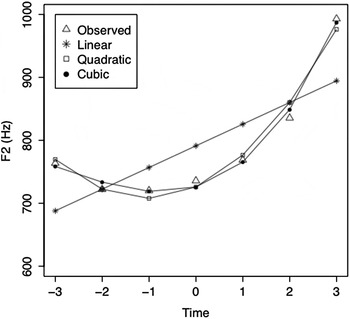
Suppose we have seven equidistant time points. The first time point was coded –3 and the last (i.e., seventh) time point was coded 3, such that the vowel's midpoint was 0. As a result, the constant (i.e., a 0, b 0, or c 0) is equal to the estimated value at the vowel's midpoint (t = 0). An example of the method is shown in Figure 1. The observed F2 values of (u), uttered by a young male speaker speaking Standard Dutch (from the N-M region; see the next section), are represented by open triangles. The three corresponding fitted regression equations, visualized in the graph, are given in Equations (4) to (6).
The observed F2 values (triangles) fitted by the linear (stars), quadratic (squares), and cubic (circles) regressions of the vowel (u), uttered by a young male speaker from N-M.

 $$y = 791 + 34.4t$$
 $$y = 726 + 34.4t + 16.4t^2$$
 $$y = 726 + 21.4t + 16.4t^2 + 1.9t^3$$
As is clearly visible in the figure, the quadratic (R = .978) and the cubic estimates (R = .992) exhibit a better fit to the F2 contour than the linear regression does (R = .584).
METHOD
Speakers
The present study investigates speech samples of 160 teachers of Dutch at high schools who were interviewed and recorded in 1999 and 2000. Teachers of Dutch were selected, because they are professional language users who are assumed to speak the standard language on a daily basis, as it is the medium of communication in class. Furthermore, as instructors of the standard language, they play an important normative role (Van de Velde & Houtermans, Reference Van de Velde, Houtermans, Huls and Weltens1999).
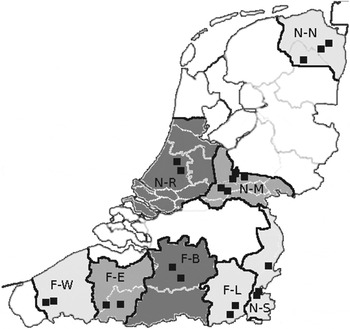
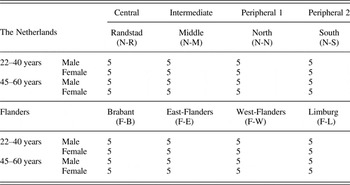
The speakers in this study were stratified for nationality (speech community), region, age, and gender (see Table 1). In each of the two countries (i.e., the Netherlands and Belgium, of which we included only Flanders, the Dutch-speaking area), from now on referred to as “communities,” four regions were distinguished. Both communities comprised a central region and two peripheral regions that are maximally distant geographically from the central region and from each other, and the dialects spoken in the peripheral regions are phonetically maximally distant from those of the central region (Hoppenbrouwers & Hoppenbrouwers, Reference Hoppenbrouwers and Hoppenbrouwers2001). Finally, the intermediate region is intermediate both geographically and linguistically, meaning that the region is closer to the central region than the peripheral regions and that its dialects are closer to the standard language. The map in Figure 2 shows the Dutch language area and the selected regions (for more details, see Van der Harst, Reference Van der Harst2011). In each region, 20 speakers were selected: five young males and females (22 to 40 years old) and five older males and females (45 to 60 years old). More information about the speakers can be found in Adank et al. (Reference Adank, Van Hout and Van de Velde2007) and Van de Velde et al. (Reference Van de Velde, Kissine, Tops, Van der Harst and Van Hout2010).
The eight selected regions and the towns in which the teachers worked at the time of the interview (filled squares). The central region in each community is dark gray, the intermediate region is somewhat lighter gray, and the peripheral regions are filled with the lightest shade of gray.

Overview of the distribution of the 160 Dutch language teachers over community, region, age, and gender

Word list reading task
As part of the interview, all speakers had to read two word lists containing a total of 318 words. The words were presented one by one on a computer screen (in standard orthography), automatically paced (2 sec), and with the possibility to interrupt and go back in cases of speech errors or hesitations. For this study, 14 monosyllabic words were selected that contained a stressed vowel in the nucleus and /s/ in the coda, such as boos /bos/ ‘angry’. The onset contained an optional consonant (compare kies /kis/ ‘molar’ and eis /εis/ ‘demand’) and could not be controlled due to the limited amount of words on the word list and the lexical gaps in Dutch.
The following phonological context (i.e., /s/) was chosen for two reasons. First, the change in vowel quality caused by surrounding consonants is minimized when they are alveolar (Van Hout, De Schutter, De Crom, Huinck, Kloots, & Van de Velde, Reference Van Hout, De Schutter, De Crom, Huinck, Kloots and Van de Velde1999). Second, the results of the present study allow direct comparison with Adank et al. (Reference Adank, Van Hout and Van de Velde2007), a study in which all vowels occurred in a /sVs/ logatome in a carrier sentence, and in which the same speakers participated.
For every vowel of Standard Dutch, one word was selected. There is a total of 15 full vowels in Standard Dutch: 9 monophthongs /a, ɑ, ε, i, ɪ, ʏ, y, u, ɔ/, 3 long mid-vowels /e, ø, o/, and 3 diphthongs /εi, œy, ɔu/. Due to a lexical gap, no word with /y/ followed by /s/ could be selected. The words included in this study were aas, gas, zes, kies, vis, zus, poes, vos, mees, neus, boos, ijs, huis, and kous, for the variables (a), (ɑ), (ε), (i), (ɪ), (ʏ), (u), (ɔ), (e), (ø), (o), (εi), (œy), and (ɔu), respectively. This results in 2240 vowel tokens: 160 speakers read out 14 words.
The long mid-vowels will be grouped with the diphthongs, as in the Netherlands community these vowels are diphthongized (Adank, Van Hout, & Van de Velde, Reference Adank, Van Hout and Van de Velde2004; Van de Velde, Reference Van de Velde1996; Verhoeven, Reference Verhoeven2005). In the following, these two sets of vowels together will be referred to as the group of “(semi)diphthongs.”
Acoustic measurements
Measurements of the first two formants were made using Praat (Boersma & Weenink, Reference Boersma and Weenink2007). All word tokens were segmented at the phoneme level. This was first done automatically, using a Praat-script developed by Vincent Ansaldi, and then checked by hand, following the segmentation procedure developed by Van Son, Binnenpoorte, Van den Heuvel, and Pols (Reference Van Son, Binnenpoorte, Van den Heuvel and Pols2001). Labels were placed at zero crossings of the glottal vibrations of the vocalic portion of the syllable that were defined as the onset and offset of the vowel by the segmentation procedure. The duration of each vowel token was defined as the interval between the segment labels.
The formants were estimated using the Burg algorithm with default settings in Praat, that is, 10 LPC coefficients, a window length of 25 msec that shifted every 10 msec, and the highest cutoff frequency set at 5000 Hz for male speakers and 5500 Hz for female speakers. The frequencies of F1 and F2 were automatically measured at seven equidistant points of the vowel token's duration, with the first point at 12.5% of the duration interval and the seventh point at 87.5% of the duration interval. All 31,360 formant values obtained were checked by hand, and, if necessary, corrected. In the present study, the formant values at the first and seventh time points were excluded in order to minimize coarticulatory effects.
Formant values were normalized using Lobanov's z-transformation. Both Van der Harst (Reference Van der Harst2011) and Adank (Reference Adank2003) showed that this normalization performs best in preserving phonemic and sociogeographic variation and in minimizing anatomical variation. Clopper et al. (Reference Clopper, Pisoni and de Jong2005:1674) noted that Lobanov's transformation is not suitable for normalization of formant frequencies at different time points in the vowel, as it obscures the changes between the time points. In order to keep the normalized values comparable across time points, we normalized formant values at all time points using only the means and standard deviations computed at the vowel's midpoint.
RESULTS
The current section presents the results for the target approach first, followed by the outcomes of the two dynamic approaches. In the last results section, the approaches are compared.
Target approach
The results for the monophthongs will be presented first, followed by the results for the (semi)diphthongs, where the effects of the explanatory variables are presented. Next, the formant measurements of F1 and F2 are used to predict the speakers' regional origins to obtain an estimate of the amount of regional information contained in the vowels.
Monophthongs in the target approach: One time point
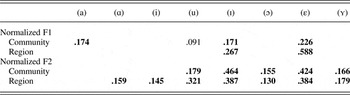
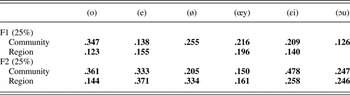
For the monophthongs, 16 univariate analyses of variance (ANOVAs) were run to test the effects of the variables community, region (nested under community), gender, and age. Two analyses, one per formant, were carried out for each of the eight monophthongs. The dependent variables were the normalized first and second formant values at the midpoint of the monophthong tokens. Table 2 shows the partial η2 values of only the significant main regional effects for the two formants.Footnote 1 The less numerous and generally weaker gender and age effects will not be presented here. The required alpha level for significance has been lowered to .01 to correct for the number of analyses. We preferred this correction over a Bonferroni correction, which is known to be too conservative.
Partial η2 for the significant regional effects (p < .01) for the ANOVAs on normalized F1 and F2 at the midpoint for the eight monophthongs (the target approach)

Note: Strong effects (partial η2>.10) are bold.
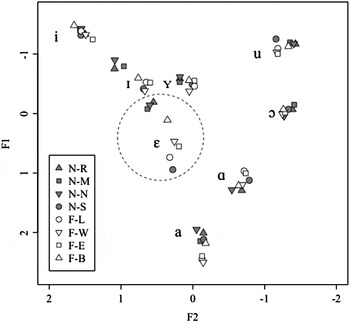
Given the aims of this study, the focus will be on regional differences, thereby restricting the discussion to the strong effects. The largest regional differences were found for F1 and F2 of (ε) and F2 of (ɪ). The effect sizes for community were also largest for the F2 of these two vowels. The two front vowels can therefore be expected to be salient markers of the region of origin of speakers. Note that for all vowels, except (a), strong regional effects show up for at least one of the formants.
The large regional differences for (ε) and (ɪ) are clearly visible in Figure 3. In addition, the figure reveals two striking patterns. First, N-R, N-N, and N-M cluster for almost all vowels, hence they are different from the other Dutch region N-S, which largely patterns with the Flemish regions. Second, the Flemish region F-B sometimes tends to be closer to the three Dutch regions than to the other Flemish regions.
Mean values of normalized F1 and F2 at the midpoint of the eight monophthongs, split up by region. The large area covered by (ε) is demarcated with a circle.

Post hoc analyses (Tukey, p < .01) confirm the clustering of the northern regions for F2 differences in some vowels. For instance, (ɪ) and (ε) are articulated more to the front in N-R, N-M, and N-N than in all other regions. Only for (ɔ) does a difference within the three northern regions show up: N-M and N-R are more fronted than N-N.
For F1, a less straightforward pattern is found, with the three Dutch regions only clustering for (ε), where N-R, N-M, N-N, and F-B show a less open (ε) than F-W, F-E, F-L, and N-S, and F-W and F-E have a less open (ε) than N-S. Finally, F-B clusters with the three Dutch regions for two vowels, namely (u) (F2) and (ε) (F1).
(Semi)diphthongs in the target approach: Two time points
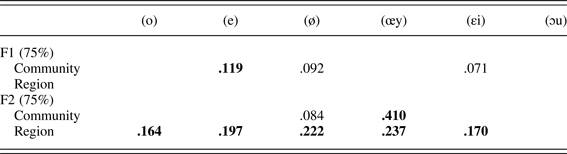
For the 6 (semi)diphthongs, 12 univariate ANOVAs were carried out for the formant values at the 25% and 75% time points. Tables 3 and 4 show the partial η2 values of the significant main effects (p < .01) for the normalized formant values at the 25% and 75% time points of the (semi)diphthongs, respectively.
Partial η2 for the significant effects (p < .01) for the ANOVAs on normalized F1 and F2 at the 25% time point of the (semi)diphthongs (the target approach)

Note: Strong effects (partial η2 > .10) are in bold.
Partial η2 for the significant effects (p < .01) for the ANOVAs on normalized F1 and F2 at the 75% time point of the (semi)diphthongs (the target approach)
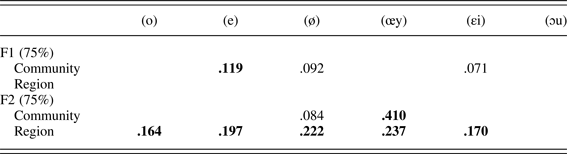
Note: Strong effects (partial η2 > .10) are in bold.
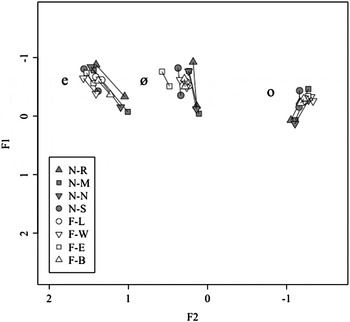
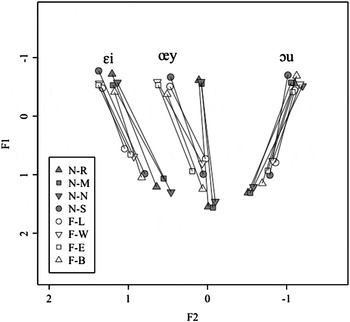
In Figure 4, the mean normalized formant values at the 25% and 75% time point of all long mid-vowels are plotted for all regions. Figure 5 shows the mean normalized formant values for all diphthongs. As for the monophthongs, N-R, N-N, and N-M cluster, particularly at the onset. Moreover, at the onset of the diphthongs, F-B exhibits a position closer to the three Dutch regions than to any other Flemish region.
Mean values of normalized F1 and F2 at the onset and offset of all long mid-vowels, split up by region.

Mean values of normalized F1 and F2 at the onset and offset of all diphthongs, split up by region.

For every (semi)diphthong, strong regional effects are found (cf. Tables 3 and 4). Post hoc analyses show less sharp divisions between the earlier mentioned clusters within the communities than for the monophthongs. For instance, for (o) N-N starts more open than N-S and the Flemish regions, whereas N-R and N-M start more open than the Flemish regions only. A similar pattern—that N-R, N-M, and N-N do not differ from each other, but at least one of these regions differs from more regions in openness than the others—recurs for F1 of (ø) and (ɔu) at 25%, and of (εi) and (œy) at 75%. The same is true for F2 at 25% in all (semi)diphthongs. Only for the 75% time point of (œy) does a clear break appear in that all northern regions are more back than N-S and Flanders.
As for N-S, there are some vowels for which there is no difference with one of the other Dutch regions: for (εi) to N-M (F1 at 25%) and for (o) to N-M (F2 at 25%) and N-R (F2 at 75%). The same is, again, true for F-B, which is the only Flemish region to pattern with N-R, N-N, or N-M, in other words, for (εi) to N-M (F1 at 25%), for (o) to N-R (F2 at 75%), and for (e) to N-R (F2 at 75%).
Predicting the region of origin of speakers: The target approach
The previous sections yield a first overview of sociogeographic differences in the pronunciation of the vowels in our study, using F1 and F2 values at the target points as the dependent variables. In the present section, it is investigated how well the regions can be discriminated on the basis of these formant values, which are measured with the target approach.
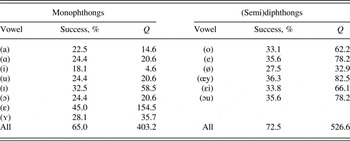
Following Adank, Smits, and Van Hout (Reference Adank, Smits and Van Hout2004), linear discriminant analyses (LDAs) were conducted for each vowel separately to investigate how successfully the regional origin of speakers can be predicted and what kind of confusion patterns between regions occur. Unless stated otherwise, the enter method was applied, that is, all factors were entered in the analysis simultaneously. For the monophthongs, F1 and F2 values at the temporal midpoint (50%) were entered as predictors of the region of origin of speakers. For the (semi)diphthongs, the onset (25%), and offset (75%) values of all tokens were entered as predictors. Because the predictors in an LDA need to be normally distributed, a Kolmogorov-Smirnov test was run for each of them to check their distribution. Although 13.8% of the predictors turned out to deviate significantly from normal distribution, a visual inspection of the distributions did not reveal alarming deviations from this distribution. Finally, an LDA was conducted in which the F1 and F2 values of all eight monophthongs were entered and an LDA in which the F1 and F2 values of all six (semi)diphthongs were entered. For each LDA, the predictive accuracy was additionally evaluated by calculating Press's Q. A higher value than the critical value (6.63) indicates that the classification is better than chance (p < .01).
The results of all LDAs are shown in Table 5. All success rates (predicting the right origin of the speaker, eight regions) are above chance level (12.5%) and all vowels, except (i), show a significantly high classification accuracy. The success rates for the individual monophthongs are in agreement with the ANOVA results (cf. Table 2). Vowels having strong regional effects (e.g., (ɪ), (ε)) show the highest success rates. All (semi)diphthongs are fairly successful predictors as well. When the formant values of all monophthongs or diphthongs are taken together, about two thirds of the speakers are placed into the correct region.
Success rates, for the target approach, of predicting the region of origin of speakers in LDAs, per vowel and for all vowels together

Note: The predictors were F1 and F2 at the midpoint for monophthongs, or at the onset and offset for (semi)diphthongs. For each LDA, Press's Q is also given.
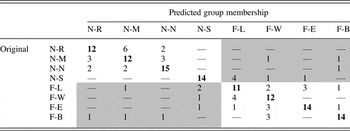
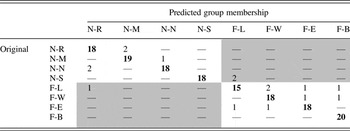
Table 6 shows the confusion matrix for the LDA that employed the F1 and F2 values of all monophthongs.Footnote 2 The matrix confirms the aforementioned outcome that N-R, N-M, and N-N cluster together. Speakers from one of these regions that are not correctly classified are almost always classified (18 of 21) in one of the other two regions. Only three speakers (14%) are misclassified outside the N-R/N-M/N-N cluster. Moreover, in only four cases (out of 35 misclassifications, 11%) were speakers from the other regions classified into one of these Dutch regions. None of these four speakers are from N-S, indicating a clear split within the Netherlands. Three of them are from F-B, as would have been predicted on the basis of the patterns in Figure 3. For the (semi)diphthongs, a similar picture is obtained, although no speakers from F-B are assigned to N-R, N-M or N-N.Footnote 3 Nevertheless, it should be remarked that the misclassification of Dutch speakers as Flemish (nine cases, 11%) and Flemish speakers as Dutch (eight cases, 10%) is somewhat surprising and not in line with everyday human perception, where Belgian and Dutch speakers are only exceptionally confused by native speakers, even in cases of migration. This might, however, be due to the fact that pronunciation differences between the Netherlands and Flanders mainly show up in consonants and (semi)diphthongs.
Confusion matrix for the LDA in which the region of origin of speakers (N = 160) was predicted on the basis of F1 and F2 at the midpoint of the monophthongs, 65% correct

Note: Press's Q = 403.2; p < .001. A dash indicates that none of the speakers were assigned to that specific cell.
In sum, the results of the ANOVAs and the LDAs in this section show that there is a considerable amount of regional variation found in the time points measured in the target approach. There is a clear split between, on the one hand, N-R, N-M, and N-N and, on the other hand, the other regions. However, particularly within the former group of regions, vowel pronunciations seem to overlap.
Dynamic approaches
LDAs for dynamic approaches: Entering all available information
As we have just seen, the target approach F1 and F2 values for the set of monophthongs and the set of diphthongs turn out to be successful predictors for the regional origin of the speakers, as shown by the LDA results in Table 5 (success rates of 65.0% for monophthongs and 72.5% for diphthongs). Can dynamic approaches discover or extract more region-specific information? The target approach uses one time point for the monophthongs and two for the diphthongs. Dynamic modeling means measuring more time points and optionally applying regression methods to estimate the time function in formant trajectories.
When we want to compare LDA outcomes for the target and the dynamic approaches, the type and number of predictors included in the LDAs need to be considered. Including more time points in the multiple time points approach has consequences for the number of predictors in the LDAs. Time points are treated as separate categories (nominal variables). The regression approach is based on parameters related to time as a continuous variable, in other words, the number of parameters (regression coefficients) directly related to the degree of the polynomial equation involved (degree 0, constant 1 parameter; degree 1, linear 2 parameters; degree 2, quadratic 3 parameters; etc.).
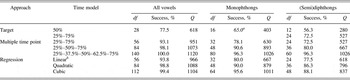
A series of LDAs was run for the target and dynamic approaches. We systematically varied the target approach by using one–, two–, three–, and five–time point values. For the regression approach, the degree 1 to 3 polynomials were entered as predictors. LDAs were done both for the sets of monophthongs and diphthongs separately and for all vowels. Table 7 gives an overview of the success rates of all relevant LDAs. The two success rates were presented in italics in Table 5.
Success rates in predicting the region of origin of speakers in LDAs, for the target (one time point for monophthongs; two for (semi)diphthongs) and dynamic (multiple targets and regression) approaches

Note: The success rates and Press's Q are given for all vowels, monophthongs, and (semi)diphthongs. The dfs give the degrees of freedom, which is the outcome of two formant values (F1 and F2) by number of vowels by number of time points or the number of parameters in the regression approach.
aThe two success rates from Table 5 are given in italics.
bTwo speakers, one young male from N-M and one young male from N-N, showed no F1 movement over time in (i) or (ɑ), respectively. Therefore, no regression line could be estimated for these formants. The missing constants for these formants were replaced by the normalized observed formant value, and the other coefficients were set to 0.
Table 7 reveals several differences. First, it is obvious that the target approach performs less well than the dynamic approaches, because its success rate is considerably lower, in particular when only the midpoint is involved. The dynamic approaches even attain (near) perfect scores. The multiple time point approach seems to perform better than the regression approach does, in particular when five time points are included. However, the regression approach appears more efficient, because the total number of predictors (see the column with the degrees of freedom, or df) is much lower. For instance, for the monophthongs, the five–time points approach (from 25% to 75%) uses 140 predictors (all vowels) to attain 100.0%, whereas the cubic regression approach uses 112 predictors (all vowels) to attain 99.4%.
Table 8 shows the confusion matrix that results from an LDA for the quadratic regression approach for monophthongs. The matrix draws a picture comparable to the one presented in Table 6 (target approach), but in Table 8 most of the speakers are correctly classified (90%). Again, the speakers of N-R, N-M, and N-N behave as a separate group; those that are misclassified end up in one of the two other regions, and only 1 of the 10 misclassified speakers from other regions are placed in N-R, N-M, or N-N. However, the most striking result is that for the regression approach N-R, N-M, and N-N can be well distinguished on the basis of the formant patterns, whereas for the target approach this was not the case. Yet, as pointed out before, the number of predictors used in the analysis to obtain this result is high (48, see Table 7).
Confusion matrix for the LDA in which the region of origin of speakers (N = 160) was predicted for the quadratic regression approach for monophthongs, 90% correct

Note: Press's Q = 879; p < .001. A dash indicates that none of the speakers were assigned to that specific cell.
Misclassified speakers of N-S (2) move across the state border but remain in the same dialect region (F-L). There is only one other cross-community misclassification.
Stepwise LDAs
The high number of predictors in entering all available information is perhaps part of the high success rates in predicting regional origin. In addition, it is reasonable to assume that a considerable number of predictors are (fairly) redundant in distinguishing regional accent varieties of standard Dutch, due to, for instance, the relationship between adjoining time points within a formant or systematic relationships between vowels within the vowel system, such as diphthongization of the mid-vowels or chain shifts. The number of predictors can be handled in a more selective way by using a stepwise method in which predictors are only added when they significantly contribute to improving the success rate of the model. For the second series of LDAs, at each step in the analysis the predictor was selected that minimized Wilks's lambda.Footnote 4 In addition, the variable was selected for the analysis only when the significance level of its F value was < .01. A variable was removed when the significance level was > .05. Seven stepwise LDAs were carried out for all vowels together. The results are given in Table 9.
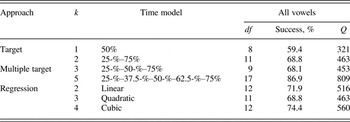
Success rates for all vowels in predicting the region of origin of speakers in the stepwise LDAs

Note: k gives the number of time points or the number of coefficients in the regression model. The degrees of freedom reflect the number of predictors selected and Q gives Press's Q.
The results for the stepwise analyses differ in two respects from those for all vowels in Table 7. It can be seen that for all approaches the number of predictors has dropped considerably (df), as is the case for the success rates, the dropping percentage ranging between 18% and 30%. Yet it still holds that dynamic approaches result in a better discrimination of the regions, the poorest result obviously being obtained for the one-target approach. However, where clear differences between the dynamic approaches were lacking for the LDA using the enter method, the stepwise LDA reveals that the approach that includes all five time points yields by far the highest success rate, helped by the higher number of predictors selected (i.e., 86.9% with 17 predictors). The runner-up is the cubic regression approach (74.4%, with 12 predictors).
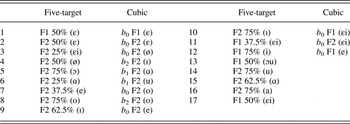
Which predictors were selected? Table 10 offers an overview of the selected predictors for the two most successful approaches, the five–time points approach and the cubic regression approach. For the first approach, the time points involved are given. The predictors are listed according to their strength, the strongest one listed first.
Predictors for the LDAs of the five time points (from 25% to 75%) approach, and the cubic regression approach

Note: Predictor 1 is the strongest predictor, predictors 17 and 12 are the weakest ones.
The predictors for the two approaches turn out to have considerable commonalities. In the first place, it confirms our observation from Figure 3 that (ε) shows the strongest regional variation, as for both approaches F1 and F2 at the midpoint of (ε) are the strongest predictors. Similarly, F2 at the midpoint of (ø) plays a large role in both predictions (fourth and third predictors).
For three vowels, two predictors of the same formant are selected in the five–time points approach: F2 of (ɪ) at 62.5% and 75% (9th and 10th predictors), F1 of (εi) at 37.5% and 50% (11th and 17th predictors), and F2 of (ɑ) at 25% and 62.5% (6th and 15th predictors). It should be noted that for (ɑ) the 25% time point of F2 is influenced by a coarticulatory effect with (regional) variation in the place of articulation of the onset consonant /ɣ/ (Van der Harst, Van de Velde, & Schouten, Reference Van der Harst, Van de Velde, Schouten, Trouvain and Barry2007).Footnote 5 More important is that for (ɪ) and (εi), two successive time points are selected, pointing out the importance of regional differences in the dynamics of these vowels, just as the selection of b1 (linear change, for F2 (u) and (ɑ)) and b2 (cubic, for F2 of (ɪ) and (o)) coefficients in the cubic approach.
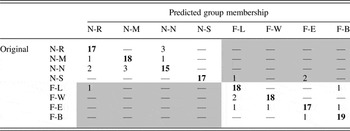
In sum, the stepwise LDAs help the researcher select those variables that differentiate the regions to the largest extent. Table 11 shows the confusion matrix for the stepwise five–time points approach that gave the best overall classification of speakers. It confirms the regional patterns that we have observed before—with somewhat more misclassifications (cf. Table 8). Importantly though, N-R, N-M, and N-N are distinguished, which is a better outcome than the target approach (see Table 6 for monophthongs).
Confusion matrix for the LDA in which the region of origin of speakers (N = 160) was predicted on the basis of F1 and F2, for the five–time points approach, 86.9% correct

Note: Press's Q = 809; p < .001. A dash indicates that none of the speakers were assigned to that specific cell.
Evaluating the approaches
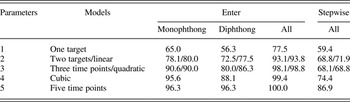
Target and dynamic approaches show an overlap in the number of parameters involved in estimating relevant formant values. The standard target approach makes a distinction between one and two target models depending on the type of vowels investigated—monophthongs versus diphthongs. To show the direct connection with the multiple time point models, Table 12 distinguishes the different models on the basis of the number of parameters they use to estimate the relevant formant information. The regression models are classified according to the same principle. The table gives an overview of the success rates of the different models, both when entering all relevant vowels and when the selective stepwise method was applied.
Success rates of the different models in predicting the region of origin of the speakers, ordered for the number of parameters involved, split up for entering all vowels and the selective stepwise method

Note: The values are percentages.
When the outcomes are charted as in Table 12, the most conspicuous outcome is the poor performance of the target approach that uses one time point, often applied in measuring the formants of monophthongs and even of diphthongs. Success rates rise sharply when one of the two parameter models is taken (always >10%). The same conclusion can be drawn for the three and higher parameter models when the enter method is applied. This rise seems to be located between the three- and four-parameter models as far as the stepwise method is concerned.
Another conclusion is that the regression models are competitive in relation to the multiple time point models with the same number of parameters. Especially the quadratic regression model, which shows a better fit with observed formant contours than the linear regression model does (cf. Figure 1) and seems a good competitor in predicting the regional origin of speakers. The advantage of a regression model is that time and the formant trajectories have a functional relationship that predicts the course of the trajectories.
DISCUSSION AND CONCLUSION
The main aim of this study was to show that the dynamics of formant trajectories provides essential information in the sociophonetic study of vowel variation, in particular in our data on regional variation in standard Dutch speech. We applied the standard target approach (midpoint for the monophthongs, onset, and offset for the diphthongs) and two dynamic approaches (i.e., multiple time point models and regression models) to represent formant values of vowels. The set of vowels was pronounced by speakers of standard Dutch, from four regions in the Netherlands and four regions in Flanders (Belgium). Do formant trajectories carry regional variation?
Target approach
As for the monophthongs, the analysis of the formant values at the vowel's midpoint showed clear differences between regions. This is remarkable, because the level of monitoring in a word list reading task is high, which reduces variation. Almost all vowels showed regional pronunciation differences, but the largest differences were found for (ε) (F1 and F2). Overall, N-R, N-M, and N-N cluster (in both F1 and F2); F-B behaves more like these Dutch regions than other Flemish regions; and N-S behaves more like a Flemish region than a Dutch region. The clustering of regions for (ε) seems to reflect a more general picture, illustrated by the confusion matrix in Table 6.
The overall picture is largely in accordance with the regional patterning that Adank et al. (Reference Adank, Van Hout and Van de Velde2007) found for the same speakers reading out logatomes. For a few vowels, for example, /i/, a small difference with their outcomes showed up. Similarly, Verhoeven and Van Bael (Reference Verhoeven, Van Bael and Verhoeven2002) showed that their F-B speakers mostly differ in vowel pronunciation from F-E and F-L speakers, but sometimes for different vowels than in the current study (e.g., /a/).
As for the (semi)diphthongs, all measured at two targets, strong regional differences were found. The (semi)diphthongs in the current study show a dichotomy, yet to a lesser extent than the monophthongs, between N-R, N-M, and N-N, on the one hand, and the other regions, on the other hand. Only sporadically does F-B behave similarly to the three Dutch regions, and N-S speakers tend to pronounce the (semi)diphthongs more similarly to the other Flemish regions than to the three Dutch regions. These results are comparable to Adank et al.'s (Reference Adank, Van Hout and Van de Velde2007) results, yet again slightly different. In the present study, more regional differences showed up, which might indicate that a difference in task plays a role. In the current study, less attention was drawn to the vowel, which would give room for more regional variation.
Dynamic approach
Two dynamic approaches were proposed to describe regional variation in the dynamics of formants of vowels: the multiple time point approach and the regression approach. Both proved to be a clear improvement on the target approach, the standard procedure in sociophonetic research. For instance, the LDAs that employed the enter method yielded higher success rates in predicting the region of origin of speakers for the dynamic approaches than for the standard target approach. Where speakers from N-R, N-M, and N-N are easily confused for the latter approach, for the former approaches they can be easily distinguished. This is a clear effect for the monophthongs. Estimating the formant dynamics over time gives a different result in the LDA confusion matrix as given in Table 8 (in comparison to the confusion matrix in Table 6). There is hardly any confusion left between the two speech communities, a distinction that seems to match the overall idea that it is fairly easy to distinguish speakers from both speech communities.
These findings strongly suggest that variationist studies using the target approach may overlook important sociolinguistic patterns. A relevant question to pose is whether these findings are generalizable to other contexts. Because we wanted to keep variation due to internal (i.e., linguistic) factors, such as the following consonant, as small as possible, we only investigated vowels occurring before /s/. Van der Harst (Reference Van der Harst2011:180–201), however, showed that the dynamics of the same vowels before /t/ are largely similar. Most differences that show up can be explained by a larger degree of vowel centralization before /t/ than before /s/, which in turn seems to be caused by the shorter duration of vowels before /t/. Despite these differences, the /t/ context yields the same regional patterns. Therefore, it seems safe to conclude that the results presented in the current paper are generalizable.
Adank et al. (Reference Adank, Van Hout and Van de Velde2007) also supported our findings in their study on vowels occurring in logatomes before /s/, which they measured at three time points only (at 25%, 50%, and 75% of the duration of the vowel). The results showed largely the same regional differences as in our study. Finally, the findings presented here are also in agreement with findings from studies in perception that showed the importance of dynamics in vowel recognition (e.g., Strange, Reference Strange1989).
Although the LDAs using the enter method are successful in showing the importance of dynamics, they incorporate a too-abundant set of predictors in their analysis. Not only will the complete set contain redundant information, it will also have the effect that part of the increase in success rates is caused by mere random fluctuations in the large set of predictors. To be more restrictive, a series of stepwise LDAs was conducted. The stepwise LDA was successful in reducing the number of predictors, and, although the success rates dropped as well, the success rates were still high. The confusion matrix in Table 11 (for five time points) shows an excellent result, despite the restricted number of predictors, with hardly any confusion between the two speech communities.
The best result was found for the five–time points approach. Its performance in successfully predicting regional origin was better than the cubic regression approach that delivered the second best performance. A comparison of the predictors selected in the stepwise method shows that there is a good match in the vowels selected in the two approaches. It is remarkable that in both approaches F2 values are the majority of the selected predictors. In Dutch, F2 differences seem to outweigh F1 differences in carrying social meaning, but this needs further research.
In sum, the stepwise LDA showed that with a restricted set of predictors, a satisfactory result could be obtained. However, this method has two drawbacks. First, for variables that show a similar regional pattern, for example, vowels in a chain shift, only one will be selected by the stepwise LDA, because the inclusion of the second variable will not improve the success rate. Furthermore, the drop in success rate for the stepwise LDA, as compared to the enter method, suggests that there is still a substantial amount of regional variation that has not been captured by the stepwise LDA. The regional information lost could be more subtle information of which researchers have not been aware until now. The variables showing more subtle variation might be interesting variables to investigate in attitudinal and perceptional studies and could perhaps explain more of the variation in those studies.
Comparing the approaches
We explained that the standard target and the new dynamic approaches can be better interpreted in terms of the number of parameters involved in estimating relevant formant values. Doing so, Table 12 plainly demonstrates the poor performance of the one parameter (i.e., one-target) model in terms of its power to discriminate regional origin. Success rates rise sharply when one of the two parameter models (i.e., two–time points approach and linear regression approach) is taken. The same conclusion can be drawn for even higher parameter models (i.e., three– or five–time points approach and quadratic or cubic regression approach) when the enter method is applied. It seems to prove that measurements at more time points pay off in returning more social information.
It should also be noted that the predictors are to be found at different time points that do not always coincide with the midpoint or the intensity maximum (another popular technique in the one-target approach), even for monophthongs, indicating that regional characteristics are present at different time points in a vowel and that are inevitably missed in the traditional one-target approach. For other vowels, the regional differences are founded in the dynamics of the vowels themselves, as suggested by the selection of two successive time points (multiple time point method) and b 1 and b 2 coefficients (regression method).
Another conclusion is that regression models are competitive in relation to the multiple time point models with the same number of parameters. Especially the quadratic regression model seems a good competitor in predicting the regional origin of speakers. A strong advantage of regression modeling is that time is captured in a function relating time and formant trajectories. This approach has to be worked out in more detail in further research, to see what kind of functions can be expected. Thomas (Reference Thomas2011:151) stated that trajectory analyses make sense, for instance, to determine whether diphthongs show curvature in their course (in the F1/F2 space) or perhaps have the form of an S-curve.
The present study draws important conclusions for the field of language variation and change. It shows that variationists who focus on only one time point per vowel have to broaden their (time) view to avoid missing possibly crucial information in their analyses. This study shows that within formant analysis there is still much to win. Whereas in the past the study of vowel variation was limited by technical shortcomings, which made formant measurements difficult and time-consuming, computers nowadays offer the possibilities to conduct elaborate measurements easily in a minimal amount of time. Van der Harst (Reference Van der Harst2011), however, showed that we cannot rely on automatic measurements entirely, because they may result in a large amount of error (i.e., over one sixth of his measurements) and therefore need to be corrected manually.
Now that investigating vowel dynamics has proven to be fruitful for the sociolinguistic study on production, a next step would be to see whether regionally indexed formant dynamics are also salient to listeners. Grondelaers, Van Hout, and Van der Harst (unpublished), using the speech of a subset of the same speakers as the present study, show that listeners are able to distinguish N-R, N-N, and N-S speakers. It seems reasonable to expect that dynamic representations of vowels fit better with what people perceive. Studies that link production and perception of vowels should include dynamic acoustical descriptions of vowels.