





Obesity continues to represent a global health care challenge(1). Sugar-sweetened beverages are a major contributor of dietary sugar, which in excess contributes to weight gain and a greater risk of metabolic conditions(Reference Calcaterra, Cena and Magenes2–5). Dietary guidelines recommend drinking water or non-nutritive sweetened (NNS) beverages to reduce sugar consumption as part of a healthy diet and to aid weight management(6,7) . However, guidance from the WHO suggests that NNS beverages should not be used to help achieve weight control. The conclusions were driven primarily by the uncertainty of findings in prospective cohort studies rather than by clearer outcomes from randomised clinical trials. Several evidence-based reviews illustrate the beneficial effects of NNS beverages on weight outcomes when these more robust study designs are employed as appropriate, relevant evidence(4,Reference Lee, Khan and McGlynn8–Reference Zhang, Noronha and Khan11) .
The use of NNS beverages as part of a long-term weight-management strategy has been debated extensively(7,Reference Christofides12–Reference Wilk, Korytek and Pelczyńska14) . Some observational studies report a positive association between consumption of NNS beverages and increased body weight(Reference Fowler, Williams and Hazuda15,Reference Fowler, Williams and Resendez16) . In contrast, meta-analyses and systematic reviews of randomised controlled trials report reduced overall energy intake, modest weight loss and beneficial effects on cardiometabolic health with consumption of NNS beverages v. mostly sugar-sweetened beverages(Reference Miller and Perez17–Reference Rios-Leyvraz and Montez19). However, few randomised controlled trials have been of sufficient duration (≥ 1 year) or cohort size to provide robust data comparing the effects of NNS beverages with water on long-term weight maintenance after initial weight loss(Reference Pereira20).
In one of the initial studies, individuals with obesity who consumed NNS foods and beverages lost more weight and maintained their weight loss during a 2-year weight-management programme v. those who abstained from NNS foods and beverages(Reference Blackburn, Kanders and Lavin21). Later, the Colorado/Temple randomised controlled trial compared the effects of NNS beverages and water on weight loss and maintenance over 52 weeks(Reference Peters, Beck and Cardel22,Reference Peters, Wyatt and Foster23) . After the initial 12-week active weight loss period, the NNS beverages group had lost significantly more weight than the water group, and this significant difference was maintained at week 52, after the subsequent 40-week assisted weight-maintenance phase. The effectS of non-nutritive sweetened beverages on appetite during active weight loss(SWITCH) trial similarly included a 12-week active weight-loss phase followed by a 40-week assisted weight-maintenance phase, but with an additional voluntary 52-week unassisted weight-maintenance phase to investigate the effects over the following year(Reference Harrold, Hill and Radu24–Reference Masic, Harrold and Christiansen26). The intent-to-treat groups were also stratified to include NNS beverage-naïve (which the Colorado/Temple study did not include) and non-naïve participants(Reference Harrold, Hill and Radu24–Reference Masic, Harrold and Christiansen26), as habitual use of NNS beverages (rather than non-use) could influence the results. After the active weight-loss phase, weight loss was equivalent for the NNS beverages and water groups(Reference Harrold, Hill and Radu24). At week 52 (after the active weight-loss and assisted weight-maintenance phases), water and NNS beverages were non-equivalent, with significantly greater (but not clinically meaningful) weight loss in the NNS beverages group(Reference Harrold, Hill and Radu25).
We report the effect of water and NNS beverages on body weight at week 104 of the SWITCH trial, after the additional 52-week unassisted weight-maintenance phase.
Plain language text and infographic summaries of this article are available in the supplementary material.
Methods
Ethical approval
The trial was conducted at the University of Liverpool, England. This trial was conducted according to the guidelines laid down in the Declaration of Helsinki, and all procedures involving human patients were approved by the National Research Ethics Service Ethics Committee North West – Liverpool East; reference 16/NW/0347. Written informed consent was obtained from all patients. The protocol and amendments were reviewed and approved by the University of Liverpool. Full details on protocol amendments and approval, including ethical approval, have been reported(Reference Harrold, Hill and Radu24,Reference Masic, Harrold and Christiansen26) .
Population
The SWITCH trial design has been reported previously(Reference Harrold, Hill and Radu24–Reference Masic, Harrold and Christiansen26). Briefly, healthy adults aged 18–65 years with BMI 27–35 kg/m2, regularly consuming ≥ three cold beverages/week (water or < 2 l/day of NNS or sugar-sweetened beverages), and from within a 50-mile radius of Merseyside (of which Liverpool is the principal city), England, were included. Exclusion criteria were recent/current smokers; history of diabetes, gastrointestinal disease or CVD; food allergies; excessive alcohol intake; taking medication/supplements known to affect weight; regular intense exercise and dieting/significant weight loss/bariatric surgery before screening.
Trial design
SWITCH was a parallel-group, open-label, randomised controlled trial conducted at the University of Liverpool, England, in three phases: 12-week active weight-loss phase, 40-week assisted weight-maintenance phase and voluntary 52-week unassisted weight-maintenance extension phase (made optional if participants chose to continue, via an amendment to the original protocol). Participant remuneration was £300 for completing 52 weeks, £100 for completing the unassisted 52-week extension and either £130 (appetite probe days; data not reported here) or £200 for participating in additional assessments (dual-energy X-ray absorptiometry).
Interventions
Participants were randomised 1:1 to NNS beverages or water. Week 104 completion status was stratified by age, sex, BMI, body weight and NNS beverage naïveté (naïve defined as NNS beverages comprising ≤25 % of beverages in the 5 years before screening), to ensure a balance of characteristics(Reference Harrold, Hill and Radu24).
Participants consumed at least two 330 ml servings/day of intention-to-treat cold NNS beverages or water. For those drinking three servings/week pre-trial (minimum amount for trial inclusion), this represented a complete replacement above their usual consumption. For those drinking 2 l/day of NNS or sugar-sweetened beverages pre-trial (maximum amount) and randomised to the NNS beverage group, this meant replacing at least two daily servings with assigned trial beverages. Participants randomised to water were asked to abstain from all NNS beverages (including sweeteners added to hot beverages). Although participants were not asked to refrain from consuming sugar-sweetened beverages, they were provided with education on healthy dietary patterns and dietary advice, including reducing sugar consumption, with these drinks being one example of a source of sugar. Participants in the NNS group could also consume water.
Trial beverages were provided by the investigators, funded by the sponsor. NNS beverages included twenty different branded options (containing ≤ 20·9 kJ [5·0 kcal] per 8 oz/≤ 8·8 kJ [2·1 kcal] per 100 ml), incorporating diet colas, diet carbonated soft drinks, diet fruit drinks and diet fruit-flavoured sweetened waters (still or carbonated). Participants were not limited to consuming one single NNS beverage for the entire trial duration and could select different beverages from within the list at any time, depending on preference. The predominant sweeteners used in the NNS beverages were aspartame, acesulfame potassium and sucralose. Table S1 shows the maximum potential estimated daily intake of these sweeteners in the NNS beverages (assuming each is used at maximum permitted levels, as set by regulation), alongside established safety thresholds according to the European Food Safety Authority. Based on blinded and aggregated input from American Beverage Association member companies, average levels (and ranges) of these sweeteners across their respective beverages are summarised in Table S2. For participants randomised to receive water, at least two servings/day were from bottled sources (spring or mineral water, still or carbonated), with additional water from any source, as needed.
Adherence was assessed via daily online beverage logs; empty packaging returns; completed Food Frequency Questionnaires (FFQ) for consumption during the previous month at baseline, throughout the trial (monthly during weeks 0–12; quarterly during weeks 12–52) and at week 104 and completed 3-d food diaries (baseline and week 12, 52 and 104).
Participants attended weekly behavioural weight-loss sessions with a nutritionist during the active weight-loss phase before switching to monthly sessions during the assisted weight-maintenance phase. No sessions were provided for the final 52-week unassisted weight-maintenance phase.
Outcomes and assessments
The primary endpoint for the unassisted weight-maintenance phase was change in body weight (kg) from baseline to week 104. Secondary endpoints included changes from baseline to week 104 in: (i) body composition: waist and hip circumference and measurements using full-body dual-energy X-ray absorptiometry scans; (ii) metabolic outcomes: glycaemic control (determined by glycated haemoglobin [HbA1c] measurement), fasting plasma glucose, lipids and liver biochemistry; (iii) appetite response: hunger (0–100 mm visual analogue scale ranging from ‘not at all hungry’ to ‘extremely hungry’) and (iv) sugar/sweetener consumption: using the Sugar and Sweetener FFQ, with higher scores indicating higher consumption of estimated added sugar or sweeteners in the previous month(Reference Harrold, Hill and Radu24–Reference Masic, Harrold and Christiansen26).
Body weight was measured at baseline, weekly for 12 weeks and then monthly until week 104. Hunger visual analogue scale, waist circumference and hip circumference were measured monthly until week 104. Sugar and Sweetener FFQ were measured monthly for 12 weeks and at weeks 20, 52 and 104. Fasting blood samples, appetite responses (data not reported here) and dual-energy X-ray absorptiometry measurements (post-overnight fasting; in a subset of participants [maximum n 50]) were taken, where available in volunteers. Plasma glucose, HbA1c, lipids and insulin were measured using fasting blood samples, collected at baseline and weeks 12, 52 and 104, where available. Samples were drawn from 10-hour fasted participants (only water permitted) after a 5-minute rest, by trained personnel, and sent daily for analysis in accredited biochemical laboratories.
Physical activity (steps/day) was monitored using an activity tracker at baseline, week 12 and week 52, but not week 104(Reference Harrold, Hill and Radu24–Reference Masic, Harrold and Christiansen26). For the first 52 weeks, participants were asked to increase their activity, adding 10 min of walking into their daily routine, until they achieved 60 min on 6 days/week.
Protocol deviations
Deviations during COVID-19 restrictions (2020 and 2021) included: fewer deliveries of trial beverage, but in greater quantities, photographic submission of empty packaging to measure adherence and self-reported body weight and waist and hip measurements via a secure online questionnaire, using the same electronic scale and tape measure sent to participants’ homes with detailed instructions. Self-reported and clinic-collected body-weight measurements were compared to assess the potential impact of weight collection location on the primary endpoint. During and after the pandemic, some individual trial visits were conducted online using a questionnaire (Qualtrics® platform), which precluded blood pressure measurement and blood sampling in some participants.
Statistical analysis
This trial tested the equivalence of NNS beverages to water on weight loss, defined as a two-sided P value > 0·05 at week 104. Using an attrition rate of 27 %, reported in the Colorado/Temple trial(Reference Peters, Beck and Cardel22), a sample of 316 participants (n 158 per group; minimum 248 [n 124 per group] excluding attrition) would provide 90 % power to detect a 1·5-kg weight change difference between groups(Reference Masic, Harrold and Christiansen26).
Endpoints were assessed using ANCOVA, with the blinded trial group as a predictor and the baseline value of the outcome of interest as a covariate. Data from participants who completed the trial up to week 104 (complete cases analysis) were analysed and repeated on two datasets in which missing data were imputed via multiple imputation (with data imputed fifty times through predictive mean matching) and last observation carried forward analysis. Sensitivity analyses were conducted for the changes in body weight and waist and hip circumference, using the same ANCOVA but with the inclusion of additional covariates (age, sex, location of weight measurement [self-compared with clinic-collected] and NNS beverage naïveté).
Results
Participants
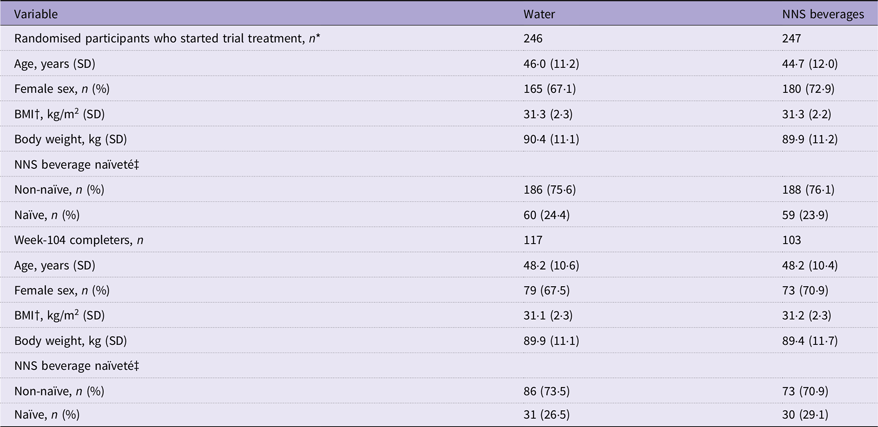
In total, 493 randomised participants initiated trial-assigned beverage consumption (water: n 246; NNS beverages: n 247) between July 2016 and December 2021. The 12- and 52-week time points were completed by 383(Reference Harrold, Hill and Radu24) and 262 participants, respectively(Reference Harrold, Hill and Radu25). The 104-week time point was completed by 220 participants (water: 117; NNS beverages: 103), representing the complete cases dataset (Table 1, Figure 1, Figure S1). In total, 273 participants withdrew or were prematurely excluded from the trial for non-compliance reasons (Figure 1).
Baseline characteristics for all randomised participants and week-104 completers

Table 1. Long description
A table comparing baseline characteristics of participants in a trial involving water and NNS beverages. The table has 12 rows and 10 columns. Column headers are Variable, Water Mean, Water SD, Water n, Water %, NNS beverages Mean, NNS beverages SD, NNS beverages n, NNS beverages %. Row labels include Randomised participants who started trial treatment, Age, Female sex, BMI, Body weight, NNS beverage naïveté, Non-naïve, Naïve, Week-104 completers, Age, Female sex, BMI, Body weight, NNS beverage naïveté, Non-naïve, Naïve. Row 1: Randomised participants who started trial treatment,246, 247. Row 2: Age, years, 46.0, 11.2,44.7, 12.0. Row 3: Female sex,165, 67.1,180, 72.9. Row 4: BMI, kg/m2, 31.3, 2.3,31.3, 2.2. Row 5: Body weight, kg, 90.4, 11.1,89.9, 11.2. Row 6: NNS beverage naïveté,. Row 7: Non-naïve,186, 75.6,188, 76.1. Row 8: Naïve,60, 24.4,59, 23.9. Row 9: Week-104 completers,117, 103. Row 10: Age, years, 48.2, 10.6,48.2, 10.4. Row 11: Female sex,79, 67.5,73, 70.9. Row 12: BMI, kg/m2, 31.1, 2.3,31.2, 2.3. Row 13: Body weight, kg, 89.9, 11.1,89.4, 11.7. Row 14: NNS beverage naïveté. Row 15: Non-naïve,86, 73.5,73, 70.9. Row 16: Naïve,31, 26.5,30, 29.1.
NNS, non-nutritive sweetened.
* Data have been reproduced with permission from Harrold et al. (Reference Harrold, Hill and Radu24).
† BMI was measured at screening as part of trial eligibility assessments.
‡ Naïve was defined as NNS beverages comprising 0–≤ 25 % of drink choices in the 5 years to screening; these individuals could be regular consumers of water or sugar-sweetened beverages. Non-naïve was defined as NNS beverages comprising > 26–100 % of drink choices in the 5 years to screening.
Flow of participants. Some data have been reproduced with permission from Harrold et al (Reference Harrold, Hill and Radu24).
*Week 12 data were missing for eleven participants (n 6 for water; n 5 for NNS beverages) who remained in the trial.
†Week 52 data were missing for four participants (n 2 for water; n 2 for NNS beverages) who remained in the trial.
‡Week 104 denoted the end of the trial, and there were no missing data for this time point. Any individuals without weight measurement at week 104 were considered to be dropouts. These individuals were, therefore, not included in the analyses using the complete cases dataset for the week-12, -52 and -104 time points but were included in the analyses using the multiple imputation and last observation carried forward datasets.
NNS, non-nutritive sweetened.

Figure 1. Long description
A flowchart illustrating the progression and randomization of participants in a clinical trial involving water and non-nutritive sweetened beverages. The flowchart begins with 27,516 individuals who inquired about the trial. Out of these, 20,017 did not respond, 4,601 withdrew after reading the patient information sheet, and 2,149 failed screening. This left 749 adults aged 18-65 years with a BMI of 27-35 kg/m² who were randomized into two groups: 374 to water and 375 to non-nutritive sweetened (NNS) beverages. Before the trial start, 128 participants from each group were excluded due to being lost to follow-up or having missing baseline data. The remaining participants started the trial treatment: 246 with water and 247 with NNS beverages. During the active weight-loss phase, 55 participants from each group withdrew or were excluded. Those who completed the week-12 timepoint were 191 from the water group and 192 from the NNS group. In the assisted maintenance phase, 54 from the water group and 67 from the NNS group withdrew or were excluded. The week-52 timepoint was completed by 137 from the water group and 125 from the NNS group. In the unassisted maintenance phase, 20 from the water group and 22 from the NNS group withdrew. The week-104 timepoint was completed by 117 from the water group and 103 from the NNS group.
Based on beverage logs, compliance with assigned trial beverages (two 330 ml servings per day) at week 104 was 98·4 % and 98·6 % in the NNS and water groups, respectively. Partial compliance (one 330 ml serving/day) was 0·9 % and 0·5 %, respectively, while non-compliance (zero servings/day) was 0·6 % and 0·9 %.
Baseline characteristics were generally similar with the overall population at weeks 12, 52 and 104 and when stratified by week-12, week-52 and week-104 completion status (Tables 1, S3 and S4).
Anthropometrics
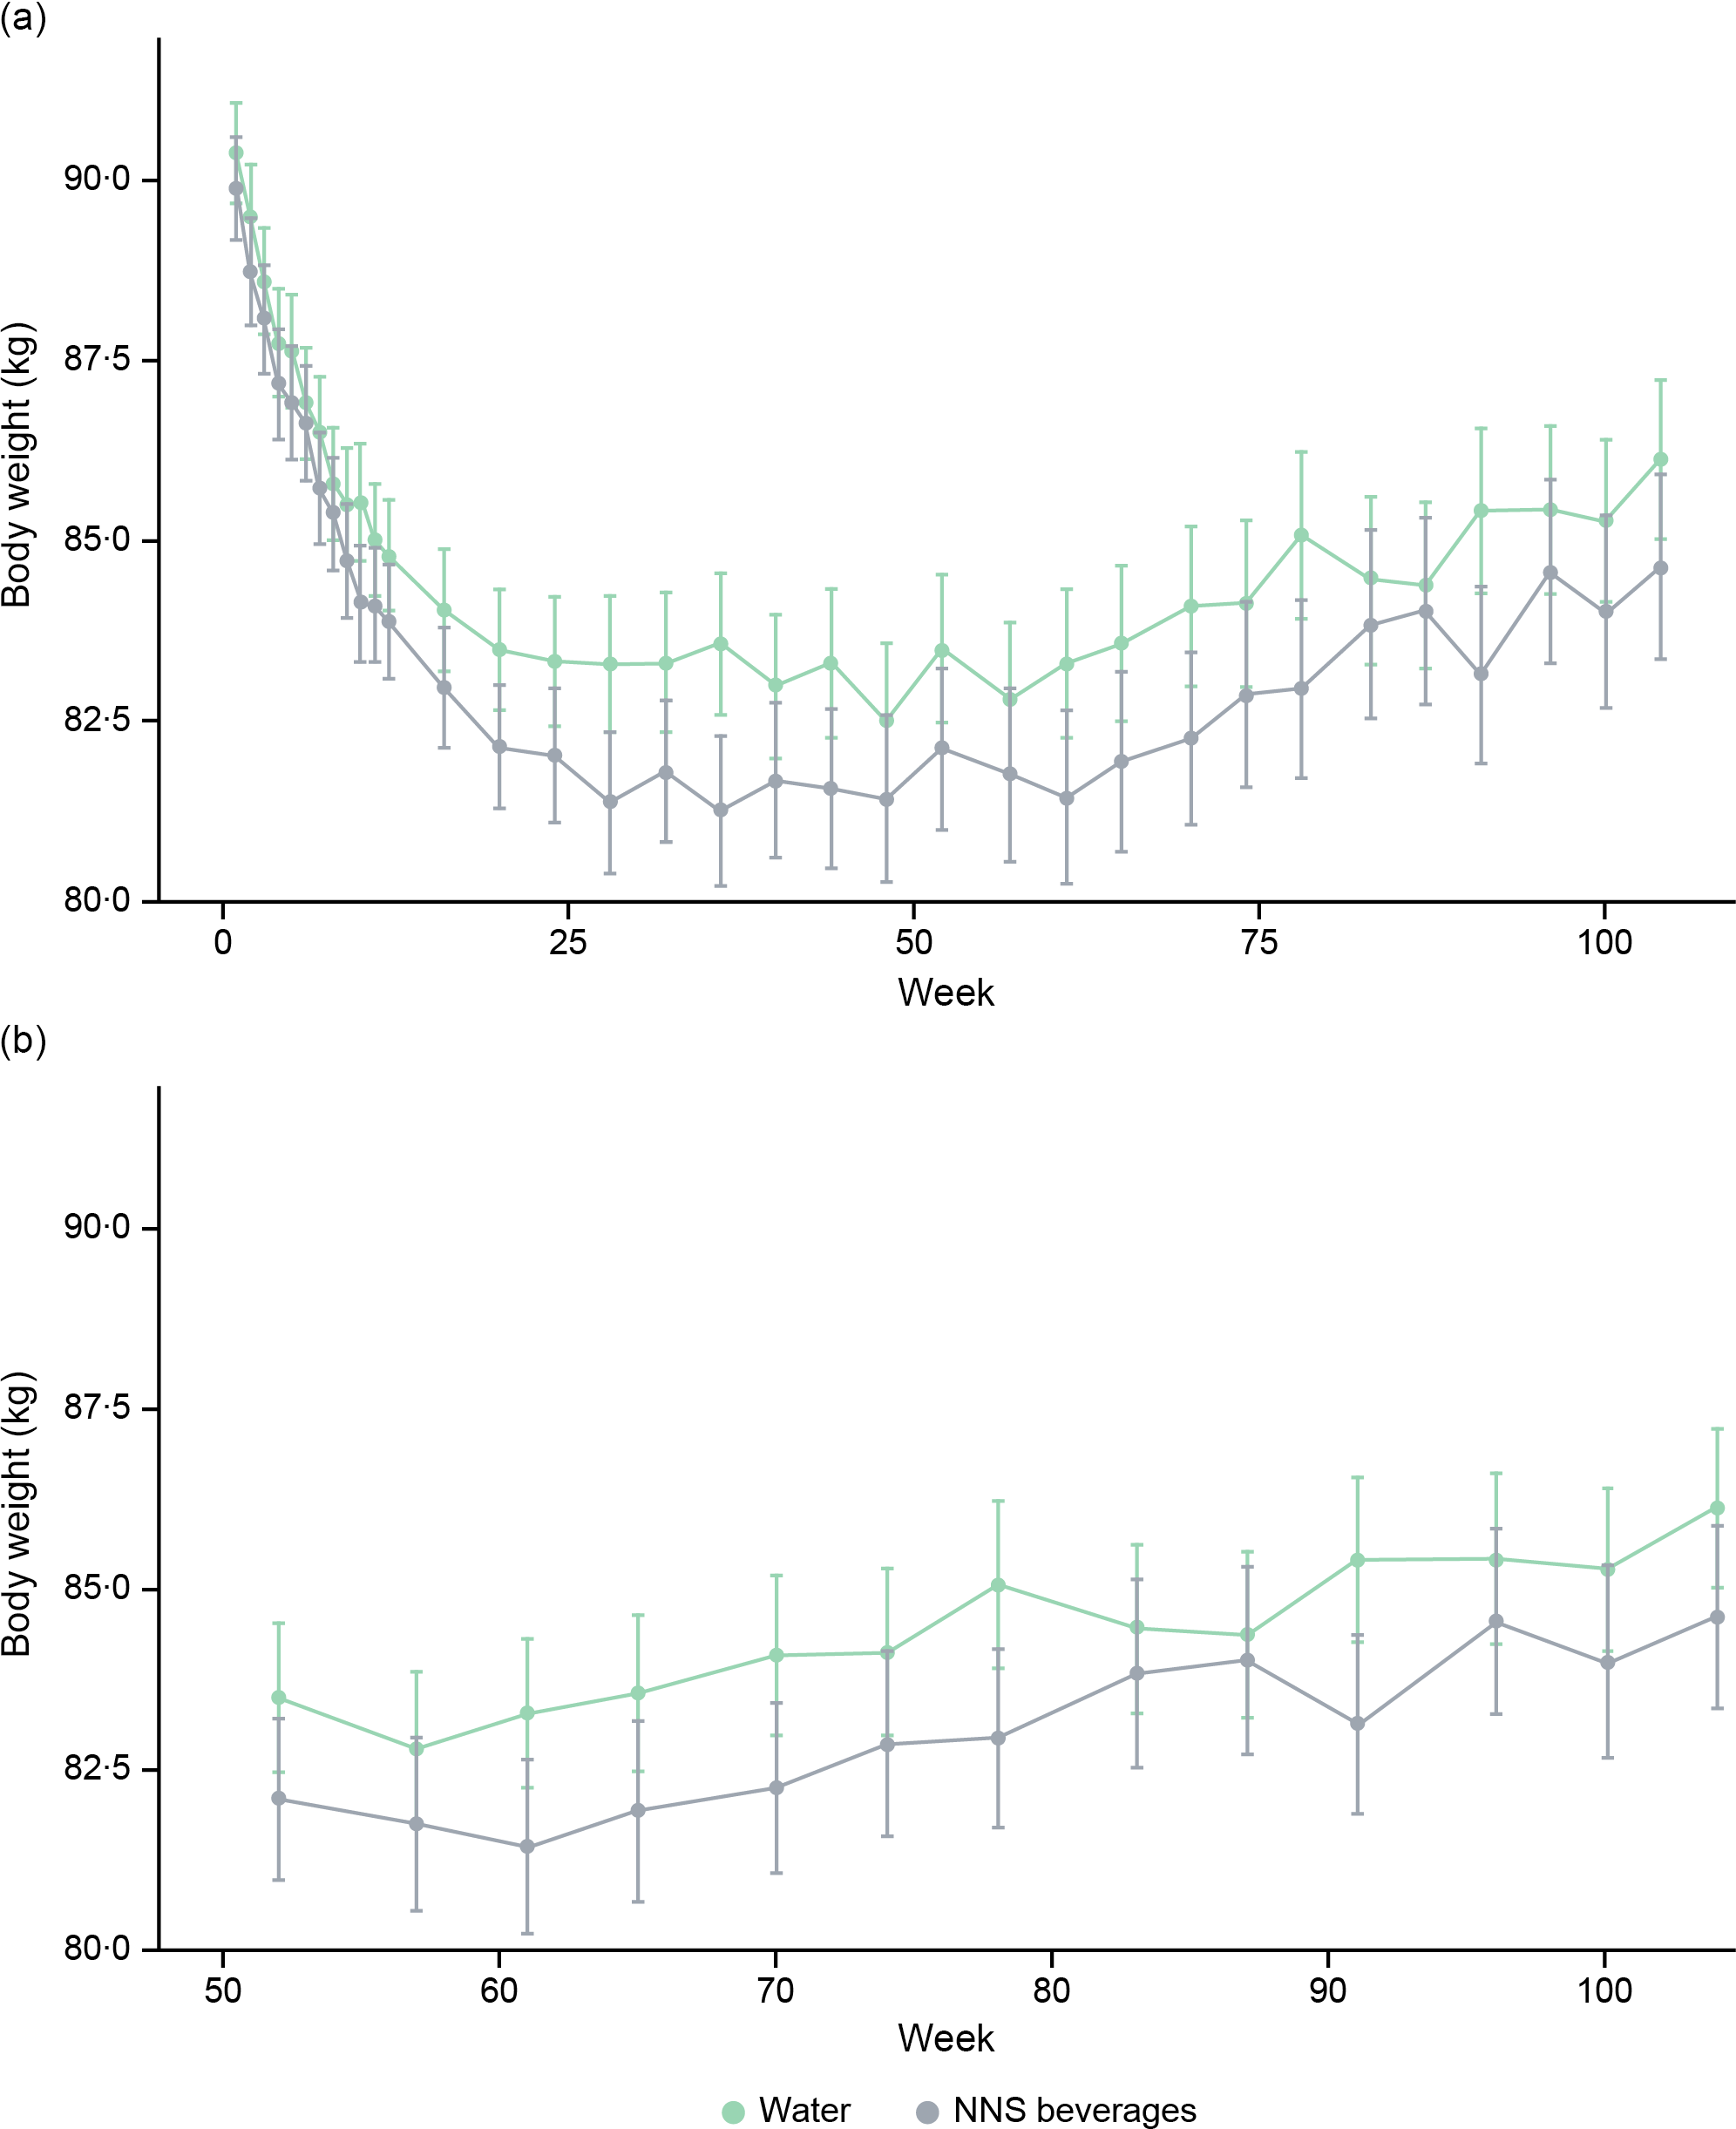
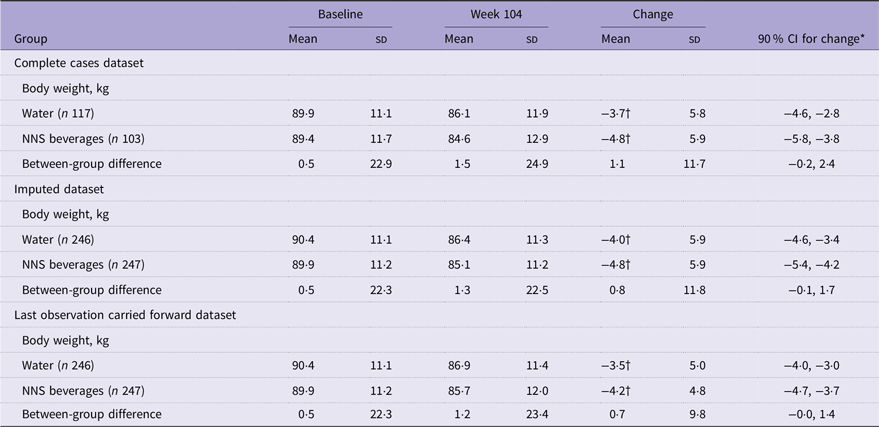
A total of 220 participants had body-weight measurements at baseline and week 104. The greatest rate of weight loss occurred during the first 12 weeks of the trial in both groups (Figure 2A). Weight loss appeared greater with NNS beverages than water from the beginning of the trial, with maximum loss reached at week 44 for water and week 36 for NNS beverages, after which both groups regained weight, with a slower increase in the NNS beverages v. the water group (Figure 2A). At week 104, both groups maintained significant reductions in body weight from baseline (Table 2, Figure 2), and the two groups were equivalent in terms of weight loss from baseline. Similarly, no significant differences in weight loss were found between the water and NNS beverage groups when using the imputed or last observation carried forward datasets (Table 2).
Time profile of body weight over 104 weeks in the complete cases dataset. (a) Body weight from baseline to week 104; (b) body weight from week 52 to week 104. Primary analysis of the complete cases dataset, which included all participants with data at baseline, week 52, and week 104. The error bars are the standard error of the mean. The week-16 time point represents the first body-weight measurement during the weight-maintenance phase. Randomised participants who started trial treatment (water v. NNS): n 246 v. n 247, respectively; week-12 completers: n 191 v. n 192, respectively; week-52 completers: n 137 v. n 125, respectively; week-104 completers: n 117 v. n 103, respectively.
NNS, non-nutritive sweetened.

Effects of trial beverage on primary endpoint at week 104 in the complete cases, multiple imputation and last observation carried forward datasets

Table 2. Long description
The table presents data on body weight changes in participants who consumed water or non-nutritive sweetened (NNS) beverages, measured at baseline and week 104. It includes three datasets: complete cases, imputed, and last observation carried forward. The table has 12 rows and 10 columns. Column headers are: Group, Baseline Mean, Baseline SD, Week 104 Mean, Week 104 SD, Change Mean, Change SD, and 90 percent CI for change. Row labels include groups for water and NNS beverages, with separate rows for each dataset and between-group differences. The table shows mean body weights and standard deviations at baseline and week 104, the mean change in body weight, and the 90 percent confidence interval for the change. For the complete cases dataset, the water group had a baseline mean weight of 89.9 kg and a week 104 mean weight of 86.1 kg, with a mean change of -3.7 kg. The NNS beverages group had a baseline mean weight of 89.4 kg and a week 104 mean weight of 84.6 kg, with a mean change of -4.8 kg. The between-group difference in mean change was 1.1 kg. Similar data is presented for the imputed and last observation carried forward datasets, showing consistent trends across all datasets.
Numbers differ between analyses based on whether only study completers or imputation of data were used. Primary analysis was of the complete cases dataset, which included all participants with data at baseline and week 104, the multiple imputation dataset, for which missing data were imputed using predictive mean matching (fifty imputations), and the last observation carried forward dataset, for which missing data were imputed using participants’ last observed value. Data were assessed using linear models comparing mean differences: between-group differences were assessed using an ANCOVA, with the blinded trial group as a predictor and the baseline value of the outcome of interest as a covariate. Data are mean (sd) unless otherwise specified.
NNS, non-nutritive sweetened.
* For the test of equivalence with two-sided P value > 0·05.
† P < 0·001.
When the impacts of various covariates on weight at week 104 were assessed in the complete cases dataset, baseline weight was significantly associated with week-104 weight (Table S5). After controlling for this, although those in the NNS beverages group had lower weight than the water group, the trial beverage did not have a significant effect on weight. Body-weight measurements were unaffected by collection location (self-collected or clinic-collected; Figure S2). In sensitivity analyses using the three datasets, only baseline body weight was significantly associated with week-104 weight (Tables S5, S6, and S7). The other predictors of age, sex, weight collection location, NNS beverage naïveté and NNS beverage assignment had no effect.
Waist and hip circumference were significantly reduced from baseline in both groups at week 104 (Figure 3A–C, Table 3), with no significant differences between groups. Using the complete cases dataset, baseline waist and hip circumference were significantly associated with week-104 waist and hip measurements, respectively (Tables S8 and S9). Sensitivity analyses showed that there was no significant effect of beverage assignment group, measurement location or other covariates on week-104 waist and hip measurements.
Violin plots showing the effect of trial beverage on selected variables at baseline and week 104 in the complete cases dataset. (a) Effect on body weight; (b) effect on waist circumference and (c) effect on hip circumference. Primary analysis of the complete cases dataset, which included all participants with data at baseline and week 104. The shaded areas refer to the kernel density (the probability that a member of the population will have a given value), the boxes show the interquartile range, the horizontal lines in the centre of the boxes are the median values and the whiskers refer to 1·5 × the interquartile range.
NNS, non-nutritive sweetened.

Effects of trial beverage on secondary endpoints at week 104 in the complete cases dataset

Table 3. Long description
The table presents data on the effects of trial beverage on various secondary endpoints at week 104 in the complete cases dataset. It includes measurements for baseline, week 104, change from baseline, and 95 percent confidence interval for changes. The table is divided into several sections, each focusing on different health metrics such as waist and hip circumference, systolic and diastolic blood pressure, total cholesterol, HDL cholesterol, LDL cholesterol, non-HDL cholesterol, triglycerides, fasting plasma glucose, fasting serum insulin, A1C, and body mass index. Each section compares the effects of water and NNS beverages on these metrics. The table has multiple rows and columns, with column headers including Baseline Mean, Week 104 Mean, Change from Baseline Mean, and 95 percent CI for Change. Row labels include specific health metrics and their respective measurements. Notable trends and comparisons are visible within the data, showing changes in health metrics over the trial period.
Primary analysis was of the complete cases dataset, which included all participants with data at baseline and week 104. Data were assessed using an ANCOVA, with the blinded trial group as a predictor and the baseline value of the outcome of interest as a covariate. Data are mean (sd) unless otherwise specified; n, number of participants with data available. During COVID-19 pandemic restrictions, assessments were not available for all participants (blood samples could not be taken for some participants while others failed to self-report).
NNS, non-nutritive sweetened; HbA1c, glycated haemoglobin; AST, aspartate aminotransferase; ALT, alanine aminotransferase; GGT, γ-glutamyl transferase; VAS, visual analogue scale; DXA, dual-energy X-ray absorptiometry; COVID-19, coronavirus disease 2019; SSFFQ, Sugar and Sweetener FFQ, Food Frequency Questionnaires.
* P < 0·001.
† P < 0·05.
‡ Assessed using a 0–100 mm VAS anchored at ‘not at all hungry’ and ‘extremely hungry’.
§ Assessed using the SSFFQ(Reference Harrold, Hill and Radu24–Reference Masic, Harrold and Christiansen26). The SSFFQ assessed the previous month consumption of sugar or sweetener in foods and drinks based on frequency and portion estimates, with higher scores indicating higher consumption.
In the dual-energy X-ray absorptiometry subset (water: n 23; NNS beverages: n 25), there were significant reductions in fat mass, fat-free mass and android and gynoid fat distribution from baseline to week 104 in both groups (Table 3). Differences in body composition endpoints between water and NNS beverages were not significant.
Biomarkers
At week 104, improvements from baseline were observed for some biomarkers in both groups (Table 3). Comparisons of changes from baseline to week 104 between groups indicated statistically significant differences in total cholesterol, HbA1c and diastolic blood pressure between water and NNS beverages; differences between groups were non-significant for all other biomarkers (Table 3).
Hunger, sweetener consumption and sugar consumption
Hunger increased slightly from baseline to week 104 with both NNS beverages and water, although this change was significant for NNS beverages only, and the difference between groups was non-significant (Table 3). Consumption of any type of sweetener (caloric or non-caloric) was significantly reduced from baseline to week 104 with water but not NNS beverages, resulting in a significant difference between groups, as expected (Table 3). Sugar consumption was significantly reduced from baseline to week 104 in both groups to a slightly greater extent in the NNS beverages group but with no significant between-group difference (Table 3).
Discussion
The SWITCH trial assessed the equivalence of NNS beverages and water in aiding weight loss and subsequent weight management and evaluated the relative effects of long-term exposure over a 104-week period. The final, voluntary, 52-week unassisted monitoring period assessed whether weight loss was maintained after routine nutrition awareness visits were no longer offered. At week 104, water and NNS beverages were equivalent in terms of weight loss, and in both groups, weight remained significantly reduced from baseline.
Weight loss at week 104 was accompanied by improvements from baseline in other anthropometric measures, some biomarkers and sugar consumption in both groups. Differences in biomarkers between the two groups included a significant increase in total cholesterol with NNS beverages compared with water and significant reductions in HbA1c and diastolic blood pressure with water compared with NNS beverages, although the sample sizes for the first two parameters were small. Clinically meaningful changes in HbA1c and diastolic blood pressure can be considered as ±5·5 mmol/mol and 3–5 mmHg, respectively(27,28) . The observed changes in our study did not meet these thresholds. Additionally, total cholesterol levels in both groups remained within the healthy range (<5·0 mmol/L). Therefore, we believe these differences are not clinically relevant.
Our results build on findings from the initial 12-week weight-loss(Reference Harrold, Hill and Radu24) and 40-week assisted weight-maintenance phases(Reference Harrold, Hill and Radu25) of the trial and suggest that both water and NNS beverages may aid weight loss/maintenance in people taking part in a behavioural weight-management programme, irrespective of NNS beverage naïveté. This is broadly consistent with the similar Colorado/Temple group trial(Reference Peters, Beck and Cardel22,Reference Peters, Wyatt and Foster23) on which the first two phases of SWITCH were based(Reference Peters, Beck and Cardel22,Reference Peters, Wyatt and Foster23) . In the present research, participants maintained their earlier, assisted weight loss during a voluntary unassisted 1-year extension, showing that long-term weight maintenance is possible with NNS beverages, as with water.
Concerns around the consumption of NNS beverages stem from the hypothesis that consuming sweetness without the energy disrupts learned sweetness–energy associations, triggering a cephalic phase insulin response and subsequent dysregulation of appetite, leading to compensatory overeating and weight gain(Reference Chakravartti, Jann and Veit29). However, randomised controlled trials have suggested beneficial or neutral effects of NNS beverages on body weight depending on whether the comparator was sugar-sweetened beverages or water, respectively(Reference McGlynn, Khan and Wang9,Reference Miller and Perez17,Reference Rios-Leyvraz and Montez19,Reference Pereira20,Reference Rogers and Appleton30) . Observational studies that show conflicting evidence suffer from reverse causality and residual confounding and typically do not include repeated intake measures or have not been subjected to substitution analyses (where habitual sugar-sweetened beverage intake is replaced with NNS beverages or water)(Reference Lee, Khan and McGlynn8). Recently, a systematic review and meta-analysis of randomised clinical trials with >6 months’ follow-up reported that replacing habitual sugar-sweetened beverages with non-caloric beverages resulted in a small, statistically significant long-term reduction in BMI, equivalent to 0·5 and 1 kg in children and adults, respectively(Reference Tobiassen and Koster-Rasmussen31). Guidance from the WHO indicates that most randomised controlled trials that have evaluated NNS had a duration of 3 months or less(4), emphasising the importance of the long-term data provided by the SWITCH trial.
A network analysis of thirty-three reviews found that most articles that reported a neutral or beneficial relationship between NNS consumption and body weight cited randomised controlled trials, whereas those reporting a negative relationship typically cited observational studies(Reference Normand, Ritz and Mela18). Observational studies reporting a negative relationship with NNS beverage consumption suggest long-term adverse effects on body weight and related health outcomes(Reference Rios-Leyvraz and Montez19,Reference Azad, Abou-Setta and Chauhan32–Reference Qin, Li and Zhao34) . Differences in study design between randomised controlled trials and observational studies may explain the variation noted in observed effects. More recently, the SWEET randomised crossover trial reported beneficial effects on appetite and endocrine responses after acute intervention with novel blends of NNS beverages and sugar-sweetened beverages(Reference Almiron-Roig, Navas-Carretero and Castelnuovo35). Neither beverage was associated with undesirable metabolic or behavioural outcomes, adverse event–related discontinuations or serious adverse events. This lends further support to findings from randomised clinical trials, but these were short-term effects.
Strengths of the SWITCH trial include the randomised controlled design, 2-year duration and stratification to include a population of NNS beverage-naïve and non-naïve participants. Limitations include the potential lack of generalisability (the trial was conducted at one site in England and did not collect race/ethnicity data) and low completion rate at the week-104 time point. Potential reasons for this include the COVID-19 pandemic, the 2-year duration and the voluntary aspect of the final phase, which was introduced after trial amendment when recruitment targets were not being met.
In conclusion, after completion of a 104-week behavioural weight-management programme, comprising active weight loss (12 weeks) and assisted weight maintenance (40 weeks) followed by 52 weeks of unassisted weight maintenance, equivalent reductions in body weight from baseline were observed between the intent-to-treat beverages (i.e., water or NNS beverages). There was no significant difference in weight loss between NNS beverages or water groups. Importantly, both groups maintained significant weight loss up to week 104. Both NNS beverages and water improved anthropometric and other outcomes over the 2-year period.
Supplementary material
For supplementary material/s referred to in this article, please visit https://doi.org/10.1017/S0007114526108150
Data availability statement
Participant data described in the manuscript are not publicly available but will be made available after study completion, upon reasonable request that is accompanied by research proposals that have received appropriate ethical approval. Data will be made available in an anonymised format in compliance with applicable privacy and data protection laws.
Acknowledgements
The authors thank the trial participants and the investigators and site staff who conducted the trial. The authors also thank Luke Hogarth of the University of Liverpool, who was the study coordinator; Katie Mitchell, Christus Ferneyhough, Stephanie Nocon and Keith Fox of the University of Liverpool, who were all research nutritionists on the study; George Currie of the University of Liverpool, the study delivery driver and John Marshall of Biofortis for data monitoring.
Medical writing support was provided by Suzanne Axford-Bryars, BSc (Hons), of BMP Services (UK) Ltd, a contract writer working on behalf of OPEN Health Communications, in accordance with Good Publication Practice 2022 guidelines, under direction of the authors, and funded by the American Beverage Association (https://www.ismpp.org/gpp-2022).
Author contributions
J. A. H. and J. C. G. H. designed the research with contributions from C. A. H., D. J. C., and U. M. J. A. H., D. J. C., S. H., U. M., L. M., C. R., P. T., and P. T. conducted the research. C. R. and P. C. analysed the data. J. A. H. had primary responsibility for the final content. All authors contributed to the interpretation of the results and the development of the manuscript and have read and approved the manuscript.
Joanne A. Harrold: Conceptualization (lead), Methodology (lead), Investigation (equal), Writing – original draft (lead), Writing – review & editing (lead); Scott Hill: Investigation (equal), Writing – review & editing (equal); Cristina Radu: Formal analysis (equal), Investigation (equal), Writing – review & editing (equal); Paul Thomas: Investigation (equal), Writing – review & editing (equal); Paula Thorp: Investigation (equal), Writing – review & editing (equal); Charlotte A. Hardman: Methodology (supporting), Writing – review & editing (equal); Paul Christiansen: Formal analysis (equal), Writing – review & editing (equal); Una Masic: Methodology (supporting), Investigation (equal), Writing – review & editing (equal); Lauren McGale: Investigation (equal), Writing – review & editing (equal); Dan J. Cuthbertson: Methodology (supporting), Investigation (equal), Writing – review & editing (equal); Jason C.G. Halford: Conceptualization (lead), Methodology (lead), Writing – review & editing (equal).
Financial support
This trial was funded by the American Beverage Association. The American Beverage Association was not involved in the design, conduct, analysis of data or interpretation of this trial; a representative from the American Beverage Association was provided with the opportunity to review the manuscript. Final decisions regarding the content were made by the authors. The manuscript was developed with the assistance of a medical writer, funded by the American Beverage Association, under the direction of the authors. A third-party organisation (Biofortis) audited data at the clinical site to check for the accuracy and integrity of the data.
Competing interests
Joanne A. Harrold reports funding (paid to the University of Liverpool) from the American Beverage Association for the present study. Outside of the submitted work, she reports a grant from the European Commission for the Horizon 2020 project SWEET. Scott Hill reports funding (paid to the University of Liverpool) from the American Beverage Association for the present study. Cristina Radu reports funding (paid to the University of Liverpool) from the American Beverage Association for the present study and funding from Coca Cola for a PhD studentship outside of the submitted work. Paul Thomas reports funding (paid to the University of Liverpool) from the American Beverage Association for the present study. Paula Thorp reports funding (paid to the University of Liverpool) from the American Beverage Association for the present study. Charlotte A. Hardman reports funding (paid to the University of Liverpool) from the American Beverage Association for the present study. Outside of the submitted work, she reports honoraria from the International Sweeteners Association, International Food Information Council and Mars Global Nutrition Advisory Council (paid to the University of Liverpool); grants from the European Commission for the Horizon 2020 project SWEET, the Biotechnology & Biological Sciences Research Council and the Natural Environment Research Council (paid to the University of Liverpool); primary supervisor on a PhD studentship funded by Coca Cola (awarded to CR); personal fees for her role on the Food Standards Agency Advisory Committee on Social Sciences and an unpaid role as a trustee of Feeding Liverpool. Paul Christiansen reports funding (paid to the University of Liverpool) from the American Beverage Association for the present study. Outside of the submitted work, he reports grants from the European Commission for the Horizon 2020 project SWEET, the National Institute for Health and Care Research, the Home Office UK and the Federal Bureau of Investigation and personal fees from Kaplan and Crohn’s and Colitis UK.
Una Masic reports funding (paid to the University of Liverpool) from the American Beverage Association for the present study. Lauren McGale reports funding (paid to the University of Liverpool) from the American Beverage Association for the present study. Outside of the submitted work, she reports funding (paid to the University of Liverpool) from the WHO, and funding (paid to the University of Wollongong) from the Australian Government’s Department of Health and Aged Care. Daniel J. Cuthbertson reports funding (paid to the University of Liverpool) from the American Beverage Association for the present study. Outside of the submitted work, he reports funding from Novo Nordisk and AstraZeneca for investigator-initiated research and consultancy (paid to the University of Liverpool) and educational grants from Perspectum. Jason C.G. Halford reports funding (paid to the University of Liverpool) from the American Beverage Association for the present study. Outside of the submitted work, he reports a grant from the European Commission for the Horizon 2020 project SWEET; consultancy fees from Boehringer Ingelheim, Dupont and Mars (all paid to the University of Leeds); honoraria from Novo Nordisk (paid to the University of Leeds); support for attending meetings from Novo Nordisk; financial support for participation in an advisory board for Dupont (paid to the University of Leeds); unpaid participation in an advisory board for the Sweet Tooth Project and unpaid board membership of the European Coalition of People Living with Obesity. He is treasurer of the World Obesity Federation.



 Open access

