Introduction
Many species of bacteria sense their environment and respond by swimming towards favourable conditions, propelled by rotating flagella, which extend from the cell body (Blair, Reference Blair1995; Armitage, Reference Armitage1999). Each flagellum consists of a long (~10 μm), thin (~20 nm), helical filament, turned like a screw by a rotary motor at its base (Namba & Vonderviszt, Reference Namba and Vonderviszt1997; Berry & Armitage, Reference Armitage1999; Berg, Reference Berg2003b; Kojima & Blair, Reference Kojima and Blair2004a). The flagellar motor is one of the largest molecular machines in bacteria, with a molecular mass of ~11 MDa, ~13 different component proteins, and a further ~25 proteins required for its expression and assembly (Macnab, Reference Macnab, Neidhardt, Curtiss, Ingraham, Lin, Low, Magasanik, Reznikoff, Riley, Schaechter and Umbarger1996). The best-studied motors are those of the peritrichously flagellated enteric bacteria Escherichia coli and the closely related Salmonella enterica Sv typhimurium (S. typhimurium). Unless explicitly stated otherwise, the experiments described in this review were performed using motors from one or other of these species. These motors switch between counterclockwise (CCW, viewed from filament to motor) rotation, which allows filaments to form a bundle and propel the cell smoothly, and clockwise (CW) rotation, which forces a filament out of the bundle and leads to a change in swimming direction called a tumble. Other flagellated bacteria swim differently, for example unidirectional motor rotation with cell reorientation when motors stop (Rhodobacter sphaeroides) or change speed (Sinorhizobium melioti), polar flagella that push or pull the cell depending on rotation direction (Vibrio alginolyticus) or internal periplasmic flagella that drive a helical wave or rigid rotation of the whole cell body (Spirochaetes) (Armitage & Schmitt, Reference Armitage and Schmitt1997; Berry & Armitage, Reference Armitage1999; Berg, Reference Berg2003a; Murphy et al. Reference Murphy, Matson, Leadbetter, Berg and Jensen2008). Much has been written elsewhere about the processes by which E. coli and other species navigate their environment, for example chemotaxis, phototaxis and magnetotaxis (Blair, Reference Blair1995; Falke et al. Reference Falke, Bass, Butler, Chervitz and Danielson1997; Wadhams & Armitage, Reference Wadhams and Armitage2004; Baker et al. Reference Baker, Wolanin and Stock2006). Here we concentrate on the flagellar motor itself.
True rotation of bacterial flagella, as opposed to propagation of helical waves, was demonstrated in the 1970s (Berg & Anderson, Reference Berg and Anderson1973; Silverman & Simon, Reference Silverman and Simon1974). Cells were tethered to a surface by filaments containing mutations that prevented them from swimming, and rotation of the cell body, driven by the motor, was observed in a light microscope (Silverman & Simon, Reference Silverman and Simon1974). Tethered cells rotate at speeds up to ~20 revolutions per second (hertz) and can be observed with video light microscopy. To observe the faster rotation of the motor when driving smaller loads, a variety of techniques have been used. The first measurement of flagellar rotation at low load showed speeds in excess of 100 Hz, indicated by a peak in the frequency spectrum of light scattered from a population of swimming cells (Lowe et al. Reference Lowe, Meister and Berg1987). The rotating filaments of stuck or swimming cells have been visualised with conventional dark-field (DF), laser DF, differential interference contrast (DIC) and fluorescence microscopy. Conventional DF and DIC studies have been limited to video rates (Hotani, Reference Hotani1976; Macnab, Reference Macnab1976; Block et al. Reference Block, Fahrner and Berg1991). Laser DF has achieved higher time resolution by recording the oscillating light intensity passing through a slit perpendicular to the image of a single filament, which appears as a series of bright spots in this method – one spot for each turn of the filament helix (Kudo et al. Reference Kudo, Magariyama and Aizawa1990; Muramoto et al. Reference Muramoto, Kawagishi, Kudo, Magariyama, Imae and Homma1995). The maximum recorded speed of any molecular motor, 1700 Hz in the Na+-driven motor in V. alginolyticus at 37°C, was measured using this technique (Magariyama et al. Reference Magariyama, Sugiyama, Muramoto, Maekawa, Kawagishi, Imae and Kudo1994). More recently, the preferred method of measuring flagellar rotation has been to attach submicron polystyrene beads to truncated flagellar filaments of immobilised cells and to record their rotation with either back focal plane interferometry (Chen & Berg, Reference Chen and Berg2000a, Reference Chen and Bergb; Ryu et al. Reference Ryu, Berry and Berg2000; Sowa et al. Reference Sowa, Hotta, Homma and Ishijima2003, Reference Sowa, Rowe, Leake, Yakushi, Homma, Ishijima and Berry2005; Lo et al. Reference Lo, Leake and Berry2006, Reference Lo, Leake, Pilizota and Berry2007; Reid et al. Reference Reid, Leake, Chandler, Lo, Armitage and Berry2006) or high-speed fluorescence microscopy (Sowa et al. Reference Sowa, Rowe, Leake, Yakushi, Homma, Ishijima and Berry2005). The viscous drag coefficient of a half-micron diameter bead on a truncated filament is approximately the same as that of a normal flagellar filament – smaller beads allow measurement of motor rotation at lower loads and higher speeds than those in a swimming cell.
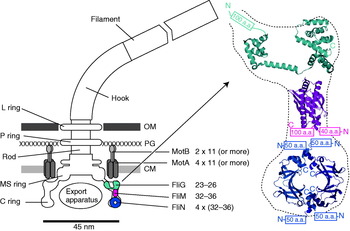
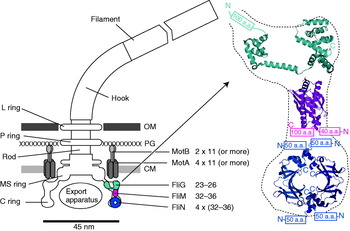
The overall structure of the flagellar motor has been determined by electron microscopy (EM), in particular single-particle image reconstruction by cryo-EM, for which the flagellar rotor has been a canonical test bed. This has been complemented by genetic and biochemical studies that have determined the location in the motor, domain structure and where relevant membrane topology of the constituent proteins, as well as regions critical for function and protein–protein interactions. Like any rotary motor, the bacterial flagellar motor consists of a rotor and a stator. The rotor spins relative to the cell and is attached to the helical filament by a universal joint called the hook, whereas the stator is anchored to the cell wall. Figure 1 shows a schematic diagram of the bacterial flagellum of gram-negative bacteria, based on an EM reconstruction of the rotor from S. typhimurium (Francis et al. Reference Francis, Sosinsky, Thomas and Derosier1994; Thomas et al. Reference Thomas, Morgan and Derosier1999, Reference Thomas, Francis, Xu and Derosier2006). The core of the motor is called the ‘basal body’ and consists of a set of rings up to ~45 nm in diameter that spans three layers of the cell envelope (DePamphilis & Adler, Reference Depamphilis and Adler1971a–Reference Depamphilis and Adlerc). The L and P rings are thought to be embedded in the outer lipopolysaccharide membrane and peptidoglycan cell wall, respectively, and to work as a bushing between the rotor and the outer parts of the cell envelope. Whether they rotate relative to the cell envelope, the rod, or both is not known. The rod connects the hook to the MS ring located at the cytoplasmic membrane. The MS ring was once thought to be two rings (membrane and supramembranous), but was subsequently shown to consist of ~26 copies of a single protein, FliF (Ueno et al. Reference Ueno, Oosawa and Aizawa1992, Reference Ueno, Oosawa and Aizawa1994; Suzuki et al. Reference Suzuki, Yonekura and Namba2004). The MS ring is the first part of the motor to assemble, thus it can be thought of as the platform on which the rest of the motor is built (Aizawa, Reference Aizawa1996; Macnab, Reference Macnab2003). The cytoplasmic face of the MS ring is attached to the C ring, which contains the proteins FliG, FliM and FliN and is thought to be the site of torque generation (Khan et al. Reference Khan, Khan and Reese1991; Francis et al. Reference Francis, Sosinsky, Thomas and Derosier1994; Katayama et al. Reference Katayama, Shiraishi, Oosawa, Baba and Aizawa1996). The stators are a complex of two proteins: MotA and MotB in H+-driven flagellar motors such as those of E. coli and S. typhimurium or PomA and PomB in Na+-driven motors such as the polar motors of Vibrio alginolyticus and Vibrio cholera. MotX and MotY are also present in Na+-driven motors, but their exact function is not known (McCarter, Reference Mccarter1994a, Reference Mccarterb). MotA/MotB and PomA/PomB have high sequence homology and appear to be equivalent in topology and function (Asai et al. Reference Asai, Kojima, Kato, Nishioka, Kawagishi and Homma1997; Yorimitsu & Homma, Reference Yorimitsu and Homma2001). Inside the C ring is the export apparatus that pumps proteins needed to make the hook and filament outside the cell (Minamino & Namba, Reference Minamino and Namba2004).
Left: Schematic side view of a H+-driven flagellar motor, with the proposed location and copy number of proteins involved in torque generation. MotA and MotB are thought to form stator complexes with stoichiometry A4B2, and FliN forms a tetramer that has 1:1 stoichiometry with FliM. The motor spans the three layers of the of cell envelope: outer membrane (OM), peptidoglycan cell wall (PG) and cytoplasmic membrane (CM). Right: Detail of proposed location and orientation of rotor proteins. X-ray crystal structures of truncated rotor proteins, FliG (cyan, PDB ID=1LKV), FliM (magenta, PDB ID=2HP7) and FliN (blue, PDB ID=1YAB), are shown docked into the rotor structure. N- and C-termini and missing amino acids are indicated. Molecular graphics generated using PyMol (http://www.pymol.org).
Because of its large size and location in the membrane, detailed atomic structures of the flagellar motor have been difficult to obtain. Recently, partial X-ray crystal structures of several motor proteins have been combined with site-directed mutagenesis and EM to produce credible models of the rotor, but atomic-level structural information on the membrane-bound stators remains elusive. Furthermore, the complex assembly pathway and requirement to anchor stators to the cell wall and locate them in an energised membrane have so far precluded the powerful single-molecule in vitro reconstitution assays that have revealed so much about the detailed motion of other, ATP-driven molecular motors in the last decade or two. Nonetheless, a great deal has been learned about the flagellar motor. This review summarises the historical background and focuses on recent advances in the field. More comprehensive accounts of the earlier work can be found in several recent reviews (Berg, Reference Berg2003b; Kojima & Blair, Reference Kojima and Blair2004a).
Propeller and universal joint
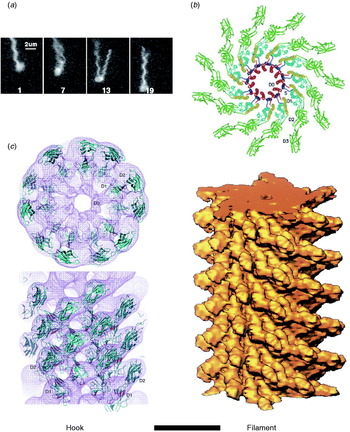
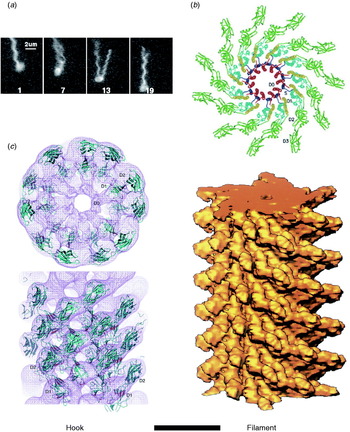
The hook and filament are thin tubular polymers each of a single protein. They grow at the distal end by incorporating monomers pumped by the export apparatus through a central channel that spans the length of the entire flagellum. Monomer incorporation is regulated by pentameric cap complexes (Yonekura et al. Reference Yonekura, Maki, Morgan, Derosier, Vonderviszt, Imada and Namba2000). Both hook and filament consist of 11 helical protofilaments, each of which has alternative long and short forms which mix to create the helical structures of the hook and filament (Asakura, Reference Asakura1970; Calladine, Reference Calladine1975; Hasegawa et al. Reference Hasegawa, Yamashita and Namba1998). Under steady rotation of the motor, the filament is a rigid propeller. Motor switching in E. coli causes torsionally induced transformations between alternative filament forms with different numbers of long and short protofilaments that change the handedness of the filament helix, expelling it from the bundle of filaments that propels a swimming cell and thus leading to cell reorientation (Fig. 2a). Fluorescent labelling of flagellar filaments combined with stroboscopic laser illumination and high-speed video microscopy has revealed these polymorphic transitions (Turner et al. Reference Turner, Ryu and Berg2000), both in swimming cells (Darnton et al. Reference Darnton, Turner, Rojevsky and Berg2007) and in response to external forces applied with optical tweezers (Darnton & Berg, Reference Darnton and Berg2007). In contrast to early theories in which it was assumed that many flagella had to switch in a coordinated manner to initiate a tumble that would reorient the cell, this work demonstrated that reversal of even a single motor is enough to make the filament leave the bundle and cause a tumble. The hook is much more flexible than the filament and works as a universal joint to allow several filaments from motors all over the cell to rotate together in a bundle in peritrichiously flagellated species. Atomic structures of straight mutants of hook and filament have been obtained by EM image reconstruction and X-ray crystallography, revealing connections within and between protofilaments that are consistent with the model of helical filament structure (Fig. 2b, c; Mimori et al. Reference Mimori, Yamashita, Murata, Fujiyoshi, Yonekura, Toyoshima and Namba1995; Samatey et al. Reference Samatey, Imada, Nagashima, Vonderviszt, Kumasaka, Yamamoto and Namba2001, Reference Samatey, Matsunami, Imada, Nagashima, Shaikh, Thomas, Chen, Derosier, Kitao and Namba2004; Yonekura et al. Reference Yonekura, Maki-Yonekura and Namba2003; Shaikh et al. Reference Shaikh, Thomas, Chen, Samatey, Matsunami, Imada, Namba and Derosier2005). Molecular Dynamics simulations based on the filament structures further demonstrated a probable mechanism for switching between long and short protofilament forms in response to force (Kitao et al. Reference Kitao, Yonekura, Maki-Yonekura, Samatey, Imada, Namba and Go2006; Furuta et al. Reference Furuta, Samatey, Matsunami, Imada, Namba and Kitao2007).
Structures of hook and filament. (a) Stroboscopic images of a fluorescently labelled swimming E. coli cell. The numbers are frame numbers, 1 frame=1/60 s. Between frames 7 and 13, a single filament leaves the bundle and undergoes polymorphic transitions that cause a change in swimming direction known as a ‘tumble’. Structures of (b) filament and (c) hook revealed by X-ray crystallography and EM. Scale bar=10 nm. Reprinted from (a) Turner et al. (Reference Turner, Ryu and Berg2000), (b) Mimori et al. (Reference Mimori, Yamashita, Murata, Fujiyoshi, Yonekura, Toyoshima and Namba1995) and Yonekura et al. (Reference Yonekura, Maki-Yonekura and Namba2003) and (c) Samatey et al. (Reference Samatey, Matsunami, Imada, Nagashima, Shaikh, Thomas, Chen, Derosier, Kitao and Namba2004).
Energy transduction
A molecular motor is a machine that converts chemical or electrical energy to mechanical work. It works close to the level of thermal energy, k BT (~4×10⁻²¹ J), where k B is Boltzmann's constant and T is absolute temperature. In the bacterial flagellar motor, the elementary free-energy input from a single ion passing through the cytoplasmic membrane is defined as an elementary electric charge times ion-motive force [IMF; either proton-motive force (PMF) or sodium-motive force (SMF) depending on the driving ion]. The IMF consists of an electrical voltage and a chemical component of concentration difference across the membrane and is defined as

where V m is the transmembrane voltage (inside minus outside) and q, C i and C o are the charge, inside and outside concentrations of the coupling ion, respectively. With a typical IMF of around −150 mV, the free energy of a single ion transit is ~6 k BT. Torque is defined as the product of a force and the perpendicular distance to an axis of rotation and therefore has dimensions of Newton metres or energy. Because Reynolds number for a spinning flagellar motor is ≪1, inertia is negligible and torque can be calculated as

where f is the rotational drag coefficient and ω is angular velocity (=2π×rotational speed).
Ion selectivity
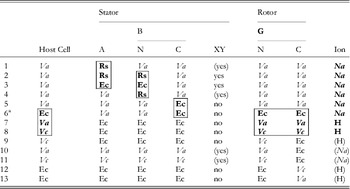
The first direct evidence that the bacterial flagellar motor is driven by ions and not ATP hydrolysis was the observation of flagellar rotation in starved Streptococcus or Bacillus subtilis cells, provided with an artificial membrane potential or pH gradient but no means of ATP generation (Manson et al. Reference Manson, Tedesco, Berg, Harold and Van Der Drift1977; Matsuura et al. Reference Matsuura, Shioi and Imae1977). This confirmed earlier indications that the motor was ion-driven (Larsen et al. Reference Larsen, Adler, Gargus and Hogg1974). The existence of Na+-driven motors in alkalophilic Bacillus and in Vibrio species was first demonstrated by the dependence of flagellar motility upon sodium concentration and its insensitivity to proton ionophores that collapse the PMF (Chernyak et al. Reference Chernyak, Dibrov, Glagolev, Sherman and Skulachev1983; Hirota & Imae, Reference Hirota and Imae1983; Hirota et al. Reference Hirota, Kitada and Imae1981). There is strong evidence, in the form of numerous functional chimeric motors that mix components from motors with different driving ions (Table 1), that the mechanisms of Na+ and H+ motors are very similar. The first such chimera reported was made by replacing PomA in the Na+-driven V. alginolyticus motor with the highly homologous MotA from the H+-driven R. sphaeroides motor (Table 1, line 1) (Asai et al. Reference Asai, Kawagishi, Sockett and Homma1999). The resulting chimera was driven by Na+, which ruled out the possibility that ion selectivity was determined by the A stator protein. Subsequent functional chimeras have swapped both A and B stator proteins, the C-terminal domain of FliG and the C- (periplasmic) and N-terminal (membrane spanning) domains of MotB or PomB, into species with a motor that runs on a different type of ion (Asai et al. Reference Asai, Kawagishi, Sockett and Homma2000, Reference Asai, Yakushi, Kawagishi and Homma2003; Gosink & Hase, Reference Gosink and Hase2000; Yorimitsu et al. Reference Yorimitsu, Mimaki, Yakushi and Homma2003). These results have demonstrated that there is no single determining component for ion selectivity. Examples in which the ion selectivity of the chimeric motor has been demonstrated to be different from the native selectivity of each particular component are highlighted by boxes in Table 1. MotX and MotY are not required to specify Na+ selectivity (Table 1, lines 5 and 6), but they are required for function if the periplasmic C-terminal domain of the stator B protein is from PomB and the host normally has sodium motors, suggesting a role in stabilising sodium stators (McCarter, Reference Mccarter1994a, Reference Mccarterb). MotX and MotY form the T ring in the periplasmic space, which is not found in E. coli and S. typhimurium (Terashima et al. Reference Terashima, Fukuoka, Yakushi, Kojima and Homma2006), further supporting a role in stabilising sodium stators in a sodium host.
Functional chimeric flagellar motors containing H+- and Na+-driven components
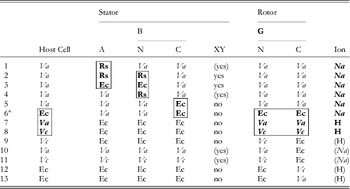
Components of Na+-driven motors are italicised, H+-driven motors in roman. Parentheses indicate experimental uncertainty in the coupling ion or the requirement for MotXY. Components for which the coupling ion in the chimera is different from that in the original motor are shown bold and highlighted by boxes. No single component uniquely determines the coupling ion.
Original motor H+-driven: Rs, R. sphaeroides; Ec, E. coli; A, MotA; B, MotB.
Original motor Na+-driven: Va, V. alginolyticus; Vc, V. cholerae; A, PomA; B, PomB; XY, MotX and MotY.
G, FliG; N, N terminus; C, C-terminus.
1: Asai et al. (Reference Asai, Kawagishi, Sockett and Homma1999); 2, 4: Asai et al. (Reference Asai, Kawagishi, Sockett and Homma2000); 3, 5–7: Asai et al. (Reference Asai, Yakushi, Kawagishi and Homma2003); 8, 9, 11, 12: Gosnik & Hase (Reference Gosink and Hase2000); 10, 13: Yorimitsu et al. (Reference Yorimitsu, Mimaki, Yakushi and Homma2003).
a PomA/PotBE.
A particularly useful chimeric motor uses stators PomA and PotB (Table 1, line 6; PotB is a fusion protein between the periplasmic C-terminal domain of E. coli MotB and the membrane-spanning N-terminal domain of PomB from V. aliginolyticus) to form a Na+-driven motor in E. coli (Asai et al. Reference Asai, Yakushi, Kawagishi and Homma2003). Because Na+ concentration is less important than pH for maintaining the functionality of proteins and the SMF is not central to the metabolism of E. coli, the SMF can be controlled over a wide range without damage to the cells or motors. This has allowed observation of the fundamental stepping motion of the motor at low SMF and measurement of the dependence of motor rotation upon each component of the SMF, as detailed below.
Motor dependence upon IMF
The IMFs that drive bacterial flagellar motors are significantly different from ATP hydrolysis in a number of ways. They require a membrane and are inherently vectorial in nature – the rotor is oriented in the membrane and ions travel through the motor in a particular direction. This has led to the proposal of several models of the motor mechanism that are based on geometric constraints with no real equivalent in ATP-driven motors (Khan & Berg, Reference Khan and Berg1983; Läuger, Reference Läuger1988; Meister et al. Reference Meister, Caplan and Berg1989; Berry, Reference Berry1993, Reference Berry2000). Ions are smaller and more symmetric than ATP, which may explain the very high stator turnover speeds and correspondingly high power output of the flagellar motor (Ryu et al. Reference Ryu, Berry and Berg2000). The quantum of free energy, corresponding to one ion crossing the membrane, is smaller than the free energy of hydrolysis of ATP (~6 versus ~20 k BT). Furthermore the enthalpic contribution is proportional to membrane voltage, which is continuously variable and, in principle, reversible. Thus, experiments to understand the effects of IMF on flagellar rotation are likely to lead to different types of conclusion than the equivalent experiments on ATP motors.
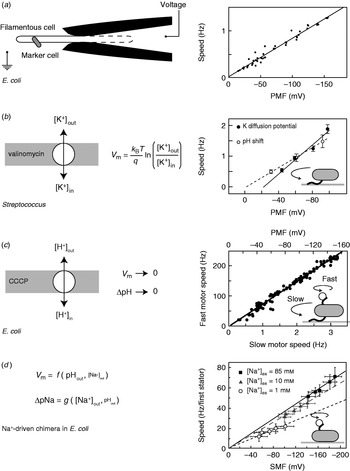
While appealing in principle, voltage clamp techniques developed for single-ion channel recordings (Sakmann & Neher, Reference Sakmann and Neher1995) are not practical for the flagellar motor. The estimated maximum current through the flagellar motor is on the order of ~0·3 pA, an order of magnitude smaller than a typical single-channel current. Combined with difficulties in obtaining a tight electrical connection between an external electrode and the cell interior that result from the small size of bacteria, their cell wall and the outer membrane in gram-negative species such as E. coli, this has so far ruled out the direct measurement of ion fluxes through single flagellar motors. The only measurement of ion flux was based on shifts in the rate of pH change of a weakly buffered dense suspension of swimming Streptococcus when motors were stopped by cross-linking their filaments with anti-filament antibody (Meister et al. Reference Meister, Lowe and Berg1987). The estimated flux was around 1200 H+ ions per revolution per motor over a speed range of ~20–60 Hz (1200 ions per revolution at the fastest motor speed ever measured, 1700 Hz in the Na+-driven motor of V. alginolyticus, corresponds to ~0·3 pA). Direct control of the membrane voltage at the flagellar motor by voltage clamp was achieved in 1995 by pulling filamentous E. coli cells (grown with the antibiotic cephalexin to prevent cell division) into custom-made micropipettes containing the proton ionophore gramicidin S to establish electrical contact between the pipette and the cell interior (Fig. 3a, left; Fung & Berg, Reference Fung and Berg1995). Motor rotation was monitored by video microscopy of dead cells attached to motors, a viscous load equivalent to tethered cells. Speed was proportional to the applied voltage up to −150 mV (Fig. 3a, right), consistent with earlier measurements of the speed of tethered gram-positive bacteria, Streptococcus and Bacillus, energised by a K+ diffusion potential (Fig. 3b; Manson et al. Reference Manson, Tedesco and Berg1980; Khan et al. Reference Khan, Meister and Berg1985; Meister & Berg, Reference Meister and Berg1987). Tethered cell experiments using diffusion potentials and variations in the concentration of driving ions also demonstrated that the electrical and chemical components of the IMF are equivalent at high load in H+-driven flagellar motors (Fig. 3b; Manson et al. Reference Manson, Tedesco and Berg1980).
Torque versus IMF. (a) Left: Schematic of a voltage clamp method using filamentous E. coli cells held in custom-made micropipettes. The part of the membrane inside the pipette (indicated by the dashed line) is made permeable using the ionophore gramicidin S. Motor speed was monitored by video microscopy of a dead cell attached to the motor. Right: Motor speed is proportional to membrane voltage (=PMF) between 0 and −150 mV. (b) Left: Membrane voltages in Streptococcus can be controlled by a K+ diffusion potential in the presence of valinomycin. Right: The speed of tethered Streptococcus cells is proportional to PMF, and membrane voltage is equivalent to pH gradient under these conditions. (c) Left: PMF can be varied slowly from −150 mV down to 0 by adding small concentrations of carbonyl cyanide m-chlorophenylhydrazone (CCCP) or sodium azide. Right: Using the result of (a), the speed of a tethered E. coli motor (lower axis) was used as a proxy for PMF (upper axis, absolute value shown). The speed of a second motor on the same cell, attached to a sub-micron bead, was found to be proportional to PMF. (d) Left: Both components of SMF in E. coli can be varied using external pH and Na+ concentration and quantified using fluorescence methods. Right: The speed of single-stator chimeric motors driving small loads is proportional to SMF at a given external Na+ concentration, but motors spin faster in high Na+ even at the same SMF. Data adapted from (a) Fung & Berg (Reference Fung and Berg1995), (b) Manson et al. (Reference Manson, Tedesco and Berg1980), (c) Gabel & Berg (Reference Gabel and Berg2003) and (d) Lo et al. (Reference Lo, Leake, Pilizota and Berry2007).
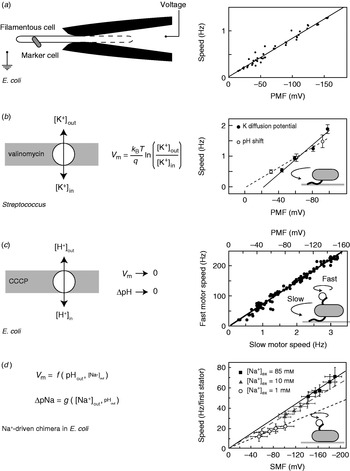
More recent measurements of the dependence of motor rotation on IMF have relied upon measuring the IMF in individual bacteria in response to different perturbations, rather than attempting to achieve a specific IMF using diffusion potentials or voltage clamp. Gabel & Berg (Reference Gabel and Berg2003) exploited the previously measured proportionality between PMF and tethered cell rotation rate, using the speed of a tethered E. coli cell to indicate the PMF in response to perturbation by sodium azide or carbonyl cyanide m-chlorophenylhydrazone, while simultaneously recording the speed of a 0·4-μm bead attached to another motor of the same cell (Fig. 3c). The speeds of the two motors were proportional, thus the speed of the fast motor at low load is also proportional to PMF. Lo et al. (Reference Lo, Leake and Berry2006, Reference Lo, Leake, Pilizota and Berry2007) developed fluorescence methods to measure both components of the SMF in single E. coli cells expressing a Na+-driven chimeric flagellar motor. They found that the membrane voltage (V m) and Na+ concentration gradient (ΔpNa) could be independently controlled over the ranges V m=−140 to −85 mV and ΔpNa=−50 to 40 mV by variation of pH and external Na+ concentration (Fig. 3d). Chimeric motor speed at high load (1-μm beads) was proportional to SMF, and V m and ΔpNa were equivalent as previously shown for PMF in tethered cells. At a low load (0·36-μm beads), V m and ΔpNa were not equivalent. For a given external sodium concentration, speed was proportional to SMF, but the constant of proportionality was larger with higher Na+ concentration and correspondingly larger relative contribution of ΔpNa to the SMF (Fig. 3d, right). A similar result was obtained for the Na+-driven motor of V. alginolyticus; reduction of sodium concentration from 50 to 3 mm reduced the speed at low load approximately threefold, but the plateau torque, presumably proportional to SMF, only approximately twofold (Sowa et al. Reference Sowa, Hotta, Homma and Ishijima2003). The SMF variation at a given sodium concentration in the E. coli experiment is mostly in V m, with only a small change in ΔpNa. If the chimeric and wild-type motors are the same, this would imply that PMF changes in the experiments of Gabel & Berg (Reference Gabel and Berg2003) were also dominated by changes in V m. One possible interpretation of these results is that the ion binding is rate-limiting at low load. In the near future, a systematic study of the effects of V m, ΔpNa and site-specific mutations on the torque–speed relationship of the chimeric motor may reveal the kinetic details of the motor mechanism (Inoue et al. Reference Inoue, Lo, Fukuoka, Takahashi, Sowa, Pilizota, Wadhams, Homma, Berry and Ishijima2008).
Torque versus speed
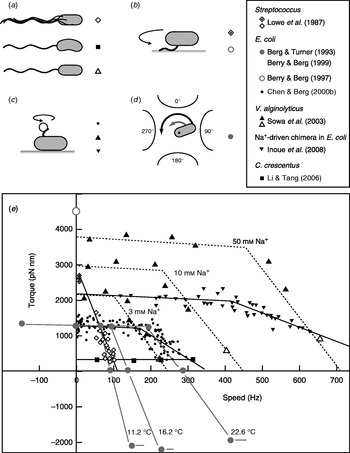
Fitting the torque–speed relationship under a range of conditions is an important test of models of the mechanochemical cycle of the flagellar motor (Oosawa & Hayashi, Reference Oosawa and Hayashi1986; Läuger, Reference Läuger1988; Berry, Reference Berry1993; Elston & Oster, Reference Elston and Oster1997; Berry & Berg, Reference Berry and Berg1999; Walz & Caplan, Reference Walz and Caplan2000; Xing et al. Reference Xing, Bai, Berry and Oster2006). The speed can be varied either by changing the viscous load or by applying external torque. The latter is technically challenging, but offers the ability to measure the torque generated by the motor when forced to rotate backwards or forwards faster than its zero-load speed. Figure 4 summarises measurements of the torque–speed relationship of flagellar motors from different species using different methods. Early measurements that varied the viscosity with tethered Streptococcus cells showed that the torque was approximately constant at speeds up to about 10 Hz (Manson et al. Reference Manson, Tedesco and Berg1980) and estimated a value of ~2700 pN nm (Lowe et al. Reference Lowe, Meister and Berg1987). The latter authors also measured the average rotation speed of flagellar bundles, detectable as broad peaks in the frequency spectrum of fluctuations in light intensity scattered by populations of swimming Streptococcus cells (Lowe et al. Reference Lowe, Meister and Berg1987). Comparing these results to the torque in tethered cells gave a linear torque–speed relationship for the Streptococcus motor (Fig. 4, diamonds). More recent experiments using polystyrene beads show a different torque–speed curve for the motors of E. coli (Chen & Berg, Reference Chen and Berg2000b), V. alginolyticus (Sowa et al. Reference Sowa, Hotta, Homma and Ishijima2003) and the sodium-driven E. coli chimera (Inoue et al. Reference Inoue, Lo, Fukuoka, Takahashi, Sowa, Pilizota, Wadhams, Homma, Berry and Ishijima2008). There is a plateau of nearly constant torque up to a ‘knee’ speed of several 100 Hz, then a sharp transition to a regime where torque falls linearly towards the zero-torque speed (Fig. 4, circles, triangles). The V. alginolyticus experiment varied speed by using different sizes of bead and undecorated filaments for the fastest data point, creating some uncertainty in the estimates of the relative viscous drag coefficients – in particular, due to unknown filaments lengths. The measurements in E. coli avoid this uncertainty by varying the viscosity between successive speed measurements with the same bead and motor, using the smallest beads for which a reliable speed signal can be obtained.
Torque versus speed. (a–d) Methods of measuring torque–speed relationships. (a) Microscopy of swimming cells. (b) Tethered cells. (c) Beads attached to flagella. (d) Electrorotation of tethered cells: microelectrodes generate a megahertz rotating electric field at the cell that applies an external torque (black arrow), which adds to the motor torque (grey arrow). (e) Torque–speed relationships for flagellar motors of various species measured using various methods. Except where indicated, all measurements were made at room temperature. Symbols in (a–d) indicate the methods used to obtain the data plotted with the same symbols in (e). For more details, see references indicated in the legend. The E. coli experiments using electrorotation (grey circles) and beads (black circles) did not report absolute torques – these curves have been scaled to a stall torque of 1260 pN nm (Reid et al. Reference Reid, Leake, Chandler, Lo, Armitage and Berry2006).
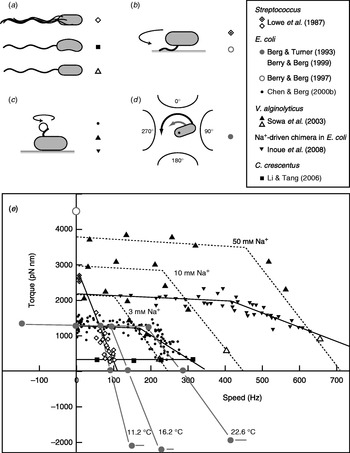
These results confirmed the torque–speed relationship measured previously by using electrorotation to apply external torque to tethered E. coli cells (Berg & Turner, Reference Berg and Turner1993; Washizu et al. Reference Washizu, Kurahashi, Iochi, Kurosawa, Aizawa, Kudo, Magariyama and Hotani1993; Berry et al. Reference Berry, Turner and Berg1995; Berry & Berg, Reference Berry and Berg1996, Reference Berry and Berg1999). In this method, a rotating electric field (megahertz) polarises the cell body and torque is exerted on the cell due to a phase lag between the field and induced dipole moment (Fig. 4d). Using microelectrodes and substantial voltages, it was possible to spin the cell body in both directions at speeds up to ~1 kHz. The electrorotation measurements extend the plateau region to backwards speeds of about −100 Hz and the high-speed linear region forwards to ~400 Hz, at which point, the motor resists rotation with a torque of similar magnitude to the plateau torque (Fig. 4, large grey circles). The absolute magnitude of torque generated by the E. coli motor was not estimated in the above experiments, but has subsequently been determined to be 1260±190 pN nm using measurements with polystyrene beads of diameter 1 μm, for which the uncertainty introduced by unknown filament lengths is negligible (Reid et al. Reference Reid, Leake, Chandler, Lo, Armitage and Berry2006). This value is similar to early estimates of 1300±50 pN nm using tethered cells (Meister & Berg, Reference Meister and Berg1987; Blair & Berg, Reference Blair and Berg1988). Early electrorotation experiments indicated a ratchet-like mechanism in which considerably more torque is needed to force the motor backwards than to stop it rotating forwards (Berg & Turner, Reference Berg and Turner1993), but later work showed this to be an artefact of the method (Berry et al. Reference Berry, Turner and Berg1995; Berry & Berg, Reference Berry and Berg1996, Reference Berry and Berg1999). This result was confirmed by using an optical trap (Ashkin et al. Reference Ashkin, Dziedzic and Yamane1987) to demonstrate that the motor torque is similar when rotating very slowly in either direction (Berry & Berg, Reference Berry and Berg1997). The high estimate of torque in this experiment (Fig. 4, open circle) contradicts the estimate using 1-μm beads and is probably unreliable because of systematic errors in the estimation of the force exerted by the trap, which was calibrated without the nearby cell body present in the torque measurement.
In the torque plateau, transitions linked to ion flux are not rate-limiting; speed is limited mechanically by the load on the motor. The continuity of torque on either side of stall indicates that there is no irreversible step in the mechanochemical cycle. Faster than the ‘knee’, transitions in the motor are rate-limiting, and this is the regime where more data are needed to understand the nature of these transitions. This interpretation is supported by the observations that motor speed in the high-speed regime depends on factors that affect absolute transition rates: temperature (Berg & Turner, Reference Berg and Turner1993), hydrogen isotope (Chen & Berg, Reference Chen and Berg2000a) and which component of the SMF is dominant (Sowa et al. Reference Sowa, Hotta, Homma and Ishijima2003; Lo et al. Reference Lo, Leake, Pilizota and Berry2007), whereas motor speed in the plateau depends only on the IMF, a thermodynamic quantity (Lo et al. Reference Lo, Leake, Pilizota and Berry2007).
It remains to be seen whether the torque–speed relationships of the E. coli and V. alginolyticus motors are common to all flagellar motors. The Streptococcus result would be equivalent if the absolute torque in tethered cells were an overestimate of the true torque. The only other species to date in which the torque–speed relationship has been measured is Caulobacter crescentus, where motor torque and speed were inferred from high-speed videos of crescent-shaped free-swimming cells in media of different viscosity (Fig. 4, squares) (Li & Tang, Reference Li and Tang2006). These results showed a plateau of low torque extending up to the highest speed measured, ~300 hz, for motors in cells swimming in aqueous buffer. Torque–speed measurements of the flagellar motors of various species, of chimeras and mutants and with a range of IMFs are expected to offer further insight in the near future.
Mechanism of torque generation
Interactions between rotor and stator
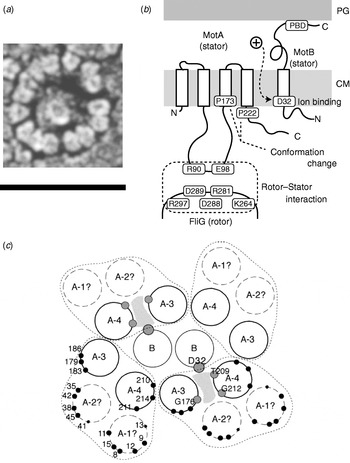
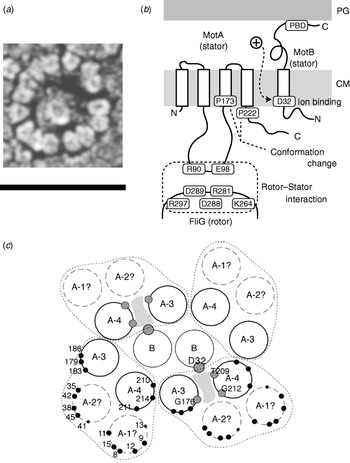
The C ring (containing FliG, FliM and FliN) is also known as the switch complex and is the key component of the rotor for torque generation and switching (Yamaguchi et al. Reference Yamaguchi, Aizawa, Kihara, Isomura, Jones and Macnab1986a, Reference Yamaguchi, Fujita, Ishihara, Aizawa and Macnabb). FliG interacts with MotA to generate torque (Garza et al. Reference Garza, Harris-Haller, Stoebner and Manson1995; Lloyd et al. Reference Lloyd, Tang, Wang, Billings and Blair1996; Zhou et al. Reference Zhou, Lloyd and Blair1998). Stator complexes anchor to the peptidoglycan cell wall and span the cytoplasmic membrane, forming ion channels (Blair & Berg, Reference Blair and Berg1990; De Mot & Vanderleyden, Reference De Mot and Vanderleyden1994; Sato & Homma, Reference Sato and Homma2000). Freeze fracture cryo-EM shows that they are located in rings at the periphery of the rotor in Aquaspirillum serpens, Bacillus species, E. coli and Streptococcus (Fig. 5a), containing between 10 and 16 particles depending on the species and the individual motor (Coulton & Murray, Reference Coulton and Murray1978; Khan et al. Reference Khan, Dapice and Reese1988, Reference Khan, Ivey and Krulwich1992). Currently, there are no atomic-level structures of any part of the stator complexes. However, extensive studies using biochemical cross-linking and site-directed mutagenesis have identified their topology, stoichiometry and likely active regions. Mot/PomA and Mot/PomB have four and one membrane-spanning α-helices and large cytoplasmic and periplasmic domains, respectively (Fig. 5b; Dean et al. Reference Dean, Macnab, Stader, Matsumura and Burks1984; Chun & Parkinson, Reference Chun and Parkinson1988; De Mot & Vanderleyden, Reference De Mot and Vanderleyden1994). The C-terminal periplasmic domain of MotB contains an essential peptidoglycan-binding motif. The cytoplasmic domain of MotA contains two charged residues that interact with five charged residues in the C-terminal domain of FliG to generate torque (Lloyd & Blair, Reference Lloyd and Blair1997; Zhou & Blair, Reference Zhou and Blair1997; Zhou et al. Reference Zhou, Lloyd and Blair1998). No single mutation in these residues completely abolishes torque-generation, and charge-reversing mutations in both proteins can compensate each other, indicating an electrostatic interaction at an interface between the two proteins. PomA and FliG of the Na+-driven flagellar motor of V. alginolyticus show a similar pattern (Yakushi et al. Reference Yakushi, Yang, Fukuoka, Homma and Blair2006), but with differences in which conserved charged residues are most important for function (Yorimitsu et al. Reference Yorimitsu, Sowa, Ishijima, Yakushi and Homma2002, Reference Yorimitsu, Mimaki, Yakushi and Homma2003). The stoichiometry of stator complexes deduced from targeted disulphide cross-linking studies and chromatography appears to be A4B2 (Sato & Homma, Reference Sato and Homma2000; Braun et al. Reference Braun, Al-Mawsawi, Kojima and Blair2004; Kojima & Blair, Reference Kojima and Blair2004b), with the membrane-spanning helices of MotA subunits surrounding a suspected proton binding site at residue Asp32 (in E. coli) of MotB (Fig. 5c; Sharp et al. Reference Sharp, Zhou and Blair1995a, Reference Sharp, Zhou and Blairb). This is the only conserved charged residue in MotA or MotB that is absolutely essential for function, and it is postulated that each stator contains two ion channels, each containing one MotB-Asp32 residue (Braun & Blair, Reference Braun and Blair2001). Different patterns of protein digestion indicate a conformational change in MotA between wild-type stators and stators containing the mutation MotB-Asp32–Asn32, which mimics the protonation of Asp32 (Braun et al. Reference Braun, Poulson, Gully, Empey, Van Way, Putnam and Blair1999; Kojima & Blair, Reference Kojima and Blair2001). Mutations in the conserved proline residues P173 and P222 in E. coli MotA severely impair motor function (Braun et al. Reference Braun, Poulson, Gully, Empey, Van Way, Putnam and Blair1999). Thus, a putative mechanism for the motor is that proton flux coordinates conformational changes in MotA via MotB-Asp32 and that these conformational changes involve motions about the MotA proline residues that lead to a cyclic interaction with FliG that generates torque. Asp24 of PomB in V. alginolyticus is equivalent to Asp32 of MotB in E. coli, but correlated conformational change of PomA has not been tested.
Stator organisation, topology, interactions with rotor and proposed membrane organisation. (a) Freeze fracture EM image of a ring of stators surrounding a hole left by the MS ring in a Streptococcus motor. Fifteen stators can be counted in this motor. Depending on species, the number of stators found by this method varies between 10 and 16. Scale bar=50 nm. (b) Stator topology and interaction between rotor and stator in E. coli. MotA has four transmembrane α-helices and a large cytoplasmic domain between the second and third transmembrane regions. This cytoplasmic domain contains important charged residues that interact with charged residues of FliG. MotB has a large periplasmic domain containing a peptidoglycan binding domain (PBD). PG, peptidoglycan cell wall; CM, cytoplasmic membrane. (c) Proposed arrangement of membrane domains of MotA and MotB, determined by mutational analysis. In this model, ions pass through a channel (shaded) formed by MotB and the third and fourth transmembrane helices of MotA. Reprinted from (a) Khan et al. (Reference Khan, Dapice and Reese1988) and (c) Blair (Reference Blair2003).
Independent torque generating units
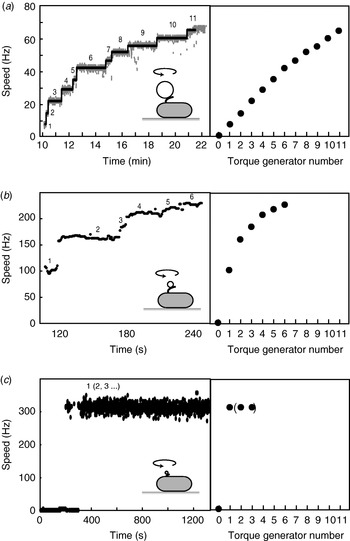
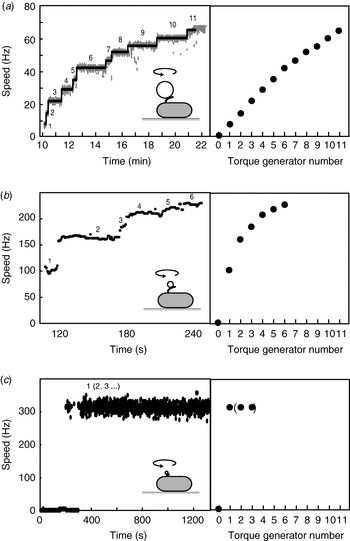
When functional Mot proteins are expressed in a mot mutant strain, motor speed increases in discrete increments, a process known as ‘resurrection’. This demonstrates that torque is generated by independent stator units. Early work using tethered E. coli cells showed a maximum of eight speed increments (Block & Berg, Reference Block and Berg1984; Blair & Berg, Reference Blair and Berg1988), at odds with the number of stator particles seen in EM images (10–12) (Khan et al. Reference Khan, Dapice and Reese1988). This discrepancy has been removed by a recent resurrection of the resurrection experiment, but using 1-μm beads instead of tethered cells (Fig. 6a; Reid et al. Reference Reid, Leake, Chandler, Lo, Armitage and Berry2006). Up to 11 or 12 speed increments were seen, consistent with the EM images. Similar results were obtained for the Na+-driven chimera in E. coli (Reid et al. Reference Reid, Leake, Chandler, Lo, Armitage and Berry2006). Up to nine stepwise decreases in the speed of the Na+-driven motor of an alkalophilic Bacillus, upon activation of an irreversible Na+-channel inhibitor by ultraviolet light, showed that these motors also contain independent torque generators (Muramoto et al. Reference Muramoto, Sugiyama, Cragoe and Imae1994).
Independent torque-generating units in E. coli. Left: Speed versus time following ‘resurrection’ of motors with defective stator proteins by induced expression of functional stator proteins. Right: Speed versus number of stators. (a) Motors labelled with 1-μm beads show up to 11 or 12 stators. The speed per stator decreases slightly at high stator number. (b) Motors labelled with 0·3-μm beads show a large decrease in speed per stator as stator number increases. (c) Motors labelled with 60-nm gold beads attached to hooks show sudden jumps to ~300 Hz without further speed increases, despite the expectation that induced stator protein expression leads to further increase in stator numbers as in (a) and (b). Black lines in (a) show fits using a step-finding algorithm. Data adapted from (a) Reid et al. (Reference Reid, Leake, Chandler, Lo, Armitage and Berry2006), (b) Ryu et al. (Reference Ryu, Berry and Berg2000) and (c) Yuan & Berg (Reference Yuan and Berg2008).
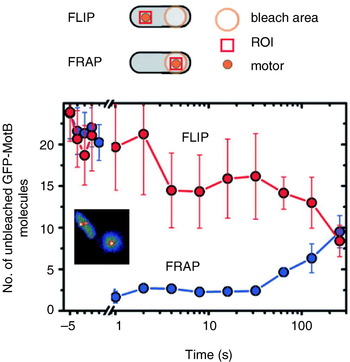
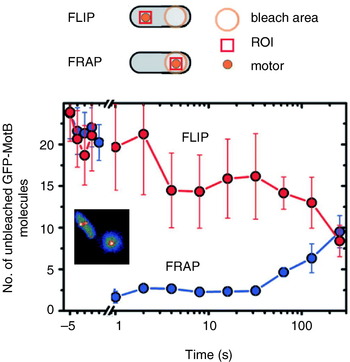
Reid et al. (Reference Reid, Leake, Chandler, Lo, Armitage and Berry2006) also reported transient speed changes in normally expressed motors, indicating the possibility that stators are not permanent but rather in a process of constant turnover. These results have been confirmed by total internal reflection fluorescence microscopy of green fluorescent protein GFP-labelled MotB (GFP-MotB) at the single-molecule level in spinning motors in live cells (Fig. 7; Leake et al. Reference Leake, Chandler, Wadhams, Bai, Berry and Armitage2006). By comparing the size of stepwise decreases in the fluorescence intensity of single motors, attributable to the photobleaching of single GFP molecules, to the initial intensity of the same motor, Leake et al. (Reference Leake, Chandler, Wadhams, Bai, Berry and Armitage2006) counted an average of 22 GFP-MotB molecules per cell. This is consistent with 11 stator complexes each with A4B2 stoichiometry, as predicted biochemically. Furthermore, a mobile pool of ~200 GFP-MotB molecules was seen in the cell membrane, and fluorescence recovery after photobleaching showed that these exchange with GFP-MotB in the motor on a timescale of minutes – confirming that stator units are dynamic rather than static. This may allow the replacement of damaged stators or it may be a mechanism for regulating motility in response to environmental conditions. Ion-channel activity of the free stators (Blair & Berg, Reference Blair and Berg1990; Sato & Homma, Reference Sato and Homma2000) is very low, as expected if flux is tightly coupled to motor rotation. One model for how this is achieved postulates that the peptidoglycan binding domain of MotB plugs the channels in stators until they assemble at the motor (Hosking et al. Reference Hosking, Vogt, Bakker and Manson2006).
Fluorescence observation of GFP-tagged MotB in live E. coli cells. Motors appear as bright spots in total internal reflection fluorescence microscopy (inset). Fluorescence loss in photobleaching (FLIP) and recovery after photobleaching (FRAP) show that MotB exchanges between the motor and a mobile pool in the membrane on a timescale of minutes. The graph shows the average intensity in a region of interest (ROI) surrounding a motor versus time after localised photobleaching of either a remote part of the cell (FLIP) or the motor itself (FRAP). Data adapted from Leake et al. (Reference Leake, Chandler, Wadhams, Bai, Berry and Armitage2006).
Stator turnover explains the observation that motors resurrect after the IMF is transiently removed, for example by removing either the membrane voltage in wild-type E. coli (Fung & Berg, Reference Fung and Berg1995) or external Na+ with the chimeric E. coli motor (Sowa et al. Reference Sowa, Rowe, Leake, Yakushi, Homma, Ishijima and Berry2005). Fluorescence microscopy of GFP-labelled PomA or PomB in V. alginolyticus shows that removal of external Na+ causes stators to leave the motor, further evidence for dynamic turnover (M. Homma, personal communication). Presumably, the balance between on- and off-rates for stators binding the motor is dependent upon the IMF. It is not known what else affects these rates, but one possibility is that normal motor rotation itself is the determining factor. This might explain the failure to observe more than eight resurrection steps in tethered cells (reproduced by Reid et al. Reference Reid, Leake, Chandler, Lo, Armitage and Berry2006) and stepwise decreases in the torque generated by cells stalled for extended periods by electrorotation (R. Berry, personal communication).
Motor speed is proportional to stator number in resurrection experiments with tethered cells and with 1-μm beads and chimeric motors or wild-type motors at low stator number (Reid et al. Reference Reid, Leake, Chandler, Lo, Armitage and Berry2006; Fig. 6a). The slight reduction in speed per stator with the wild-type at high stator number (Fig. 6a) may be attributable to steric interference between stators or possibly to local depletion of H+. Resurrection experiments with smaller beads show a marked non-linearity even at low stator number (Ryu et al. Reference Ryu, Berry and Berg2000; Fig. 6b). These results were used to show that torque–speed relationships for motors containing between one and five stators have a plateau and apparently the same knee speed as the wild-type motor. Ryu et al. (Reference Ryu, Berry and Berg2000) predicted that the zero-torque speed varied little or not at all with stator number, which has recently been confirmed by resurrection experiments at vanishing load (Fig. 6c; Yuan & Berg, Reference Yuan and Berg2008). Sixty-nanometer gold beads attached to the flagellar hook in a strain lacking filaments were observed using laser DF microscopy and showed sudden jumps from 0 to ~300 Hz without further speed increases, under conditions where the stator number is expected to increase as in a normal resurrection experiment. The independence of zero-torque speed on stator number is interpreted using a model in which each stator has a high duty ratio, and there is a rate-limiting step in the mechanochemical cycle that cannot be speeded up by the torque exerted by other stators through the common rotor. A similar result has been obtained for the sodium-driven chimeric motor in E. coli (Inoue et al. Reference Inoue, Lo, Fukuoka, Takahashi, Sowa, Pilizota, Wadhams, Homma, Berry and Ishijima2008). It is interesting to note that the drag coefficient of bacterial filaments leads to motor rotation close to the knee in swimming cells, corresponding to the maximum power output of the motor. Whether this is coincidence or natural selection is not known.
New motor structures
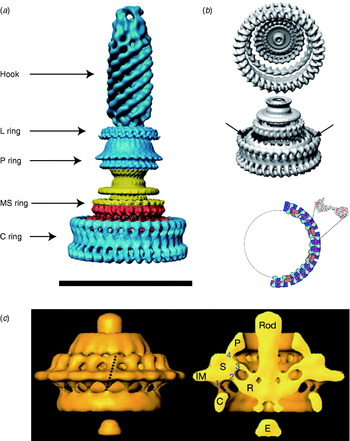
Atomic structures of the middle and C-terminal domains of FliG, the middle part of FliM and the C-terminal part of FliN have been resolved by X-ray crystallography (Lloyd et al. Reference Lloyd, Whitby, Blair and Hill1999; Brown et al. Reference Brown, Hill and Blair2002, Reference Brown, Mathews, Joss, Hill and Blair2005; Park et al. Reference Park, Lowder, Bilwes, Blair and Crane2006). Figure 1 (inset) shows these crystal structures and a model for where they fit into the C ring, based on a range of biochemical studies (Lowder et al. Reference Lowder, Duyvesteyn and Blair2005; Paul & Blair, Reference Paul and Blair2006; Paul et al. Reference Paul, Harmon and Blair2006; Brown et al. Reference Brown, Terrazas, Paul and Blair2007). The overall structure of the C ring in S. typhimurium has been determined by single particle reconstruction and cryo-EM of the flagellar basal body. This work has revealed an interesting symmetry mismatch within the rotor. The MS ring symmetry was first reported to be 26 (Suzuki et al. Reference Suzuki, Yonekura and Namba2004). A partly functional fusion protein between FliF and FliG in S. typhimurium is strong evidence that FliG has the same copy number as FliF, the main MS ring protein (Francis et al. Reference Francis, Irikura, Yamaguchi, Derosier and Macnab1992), presumably ~26. Early work on the C ring indicated 33- and 34-fold symmetries (Thomas et al. Reference Thomas, Morgan and Derosier1999); subsequent work extended the range to 31–38 (Young et al. Reference Young, Dang, Lai, Derosier and Khan2003), but most of FliG must be in the C ring, raising the question of how ~26 copies of FliG can form part of a ~35-fold symmetric C ring (Francis et al. Reference Francis, Sosinsky, Thomas and Derosier1994; Oosawa et al. Reference Oosawa, Ueno and Aizawa1994; Thomas et al. Reference Thomas, Morgan and Derosier1999; Suzuki et al. Reference Suzuki, Yonekura and Namba2004). The most recent reconstructions of the rotor structure (Thomas et al. Reference Thomas, Francis, Xu and Derosier2006) offer a resolution of the problem (Fig. 8a, b). The inner lobe of the C ring shares the symmetry of the MS ring (here seen to vary between 23 and 26), presumably identifying it with FliG, whereas the outer lobe of the C ring is distributed with symmetry 32–36. Thomas et al. (Reference Thomas, Francis, Xu and Derosier2006) proposed that ~26 copies of FliG are contained in the MS ring and the inner lobe of the C ring. An alternative model proposes that FliG spans both lobes of the C ring and that there are n defects in the outer lobe, each a missing FliG domain, where n is the difference between C- and MS-ring symmetries (Brown et al. Reference Brown, Terrazas, Paul and Blair2007). An illustration of this effect is shown in Fig. 8b, in which the light purple FliM subunits mark each defect. These defects are lost in the process of alignment and averaging during image reconstruction. An earlier model predicted a similar symmetry mismatch and identified n=8 with the number of stator units, postulating that the torque-generating mechanism consisted of each stator unit catalysing the propagation of a defect around the ring (Thomas et al. Reference Thomas, Morgan and Derosier1999). This model predicts that the MS and C ring rotate at different speeds, a counter-intuitive prediction that might in the future be testable by direct observation of fluorescently labelled rotor proteins. The latest structural evidence shows no correlation between variations in the C- and MS-ring symmetries (Thomas et al. Reference Thomas, Francis, Xu and Derosier2006), with the symmetry mismatch n varying between 6 and 13. However, the number of stators has also recently been shown to vary up to at least 11 (Reid et al. Reference Reid, Leake, Chandler, Lo, Armitage and Berry2006), leaving open the intriguing possibility that the symmetry mismatch may be an essential element in the torque-generating mechanism.
EM images of flagellar motors. (a) 3D reconstruction of the isolated rotor from S. typhimurium. (b) The inner lobe of the C ring has ~25-fold symmetry (arrows), the remainder of the C ring ~34-fold. Bottom: Model for symmetry mismatch. Light blue, FliG; pink, FliM; blue, tetramer of FliN. (c) 3D reconstruction of the rotor from spirochaete T. primitia in vivo. The dashed line in the left figure shows the axis of a stator. The motor contains 16 stators, each of which makes one link to the P collar and three to the rotor (right). The rotor is larger than that of S. typhimurium (a, c, Scale bars=50 nm). Reprinted from (a) DeRosier (Reference Derosier2006), (b) Thomas et al. (Reference Thomas, Francis, Xu and Derosier2006) and Brown et al. (Reference Brown, Terrazas, Paul and Blair2007) and (c) Murphy et al. (Reference Murphy, Leadbetter and Jensen2006).
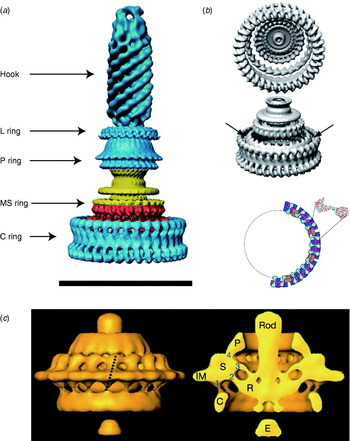
A recent complete EM structure in situ of the flagellar motor of the spirochaete Treponema primitia at 7-nm resolution shows 16 stators in an interconnected ring around the rotor, with most of the mass in the cytoplasmic membrane and periplasm (Fig. 8c; Murphy et al. Reference Murphy, Leadbetter and Jensen2006). Each stator connects to the P collar and also in three places to the rotor. Only one of the rotor connections is to the part of the C ring where FliG is thought to be located in the rotor of S. typhimurium (Thomas et al. Reference Thomas, Francis, Xu and Derosier2006). The rotors of these two species are slightly different in shape and size, and it remains to be seen whether the number and arrangement of their stators is also different.
Stepping rotation
An important recent breakthrough towards understanding the mechanism of flagellar rotation at the microscopic level has been direct observation of the elementary process, i.e. stepping rotation (Sowa et al. Reference Sowa, Rowe, Leake, Yakushi, Homma, Ishijima and Berry2005), in a fashion comparable to recent experiments on ATP-driven molecular motors (Svoboda et al. Reference Svoboda, Schmidt, Schnapp and Block1993; Yasuda et al. Reference Yasuda, Noji, Kinosita and Yoshida1998; Kitamura et al. Reference Kitamura, Tokunaga, Iwane and Yanagida1999; Mehta et al. Reference Mehta, Rock, Rief, Spudich, Mooseker and Cheney1999; Yasuda et al. Reference Yasuda, Noji, Yoshida, Kinosita and Itoh2001). The quest to observe stepping of the bacterial flagellar motor dates back almost to the first confirmation that the motor actually rotates (Berg, Reference Berg, Goldman, Pollard and Rosenbaum1976). At that time, despite careful experiments, stepping motion could not be found. Estimates of the resolution of the experiments predicted that if there were steps, there must be more than 10 per revolution. Analysis of speed fluctuations in tethered cells predicted ~50 steps per revolution per stator and ~400 steps per revolution in a wild-type motor, assuming Poisson stepping (Samuel & Berg, Reference Samuel and Berg1995, Reference Samuel and Berg1996), setting a difficult technical challenge. As well as the small expected step size and multiple parallel torque generators, the hook acts as a filter smoothing out any steps in the rotation of a bead attached to the filament. The hook stiffness was determined as 400 pN nm rad−1 by measuring relaxation times after applying external torque to tethered cells using optical tweezers (Block et al. Reference Block, Blair and Berg1989). This means that even a single stator generating ~150 pN nm (Reid et al. Reference Reid, Leake, Chandler, Lo, Armitage and Berry2006) twists the hook 0·35 radians, or 20°. If the motor takes a step, the subsequent motion of the bead will be damped with a relaxation time equal to the viscous drag coefficient divided by the spring constant of the hook. The time between steps must be larger than the relaxation time if they are to be detected. Using smaller beads reduces the drag coefficient and thus the relaxation time, but also leads to faster rotation of the motor and thus less time per step.
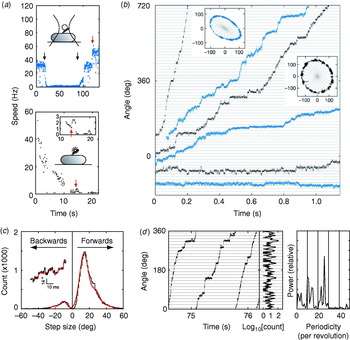
These problems were overcome by Sowa et al. in 2005 by using small beads attached to Na+-driven chimeric motors in E. coli (Asai et al. Reference Asai, Yakushi, Kawagishi and Homma2003). Stators were expressed at low levels and the SMF was reduced by lowering external sodium concentration. This achieved very slow rotation (~10 Hz or lower) combined with fast bead response, although the actual SMF was unknown and the rotation rate was not stable because of the extremely low SMF. Rotation was detected by tracking either 0·5-μm beads using back-focal plane interferometry or 0·2-μm fluorescent beads using a high-speed electron multiplying CCD camera (Fig. 9a). Steps were resolved in single-stator motors at speeds lower than ~10 Hz (Fig. 9b). The distribution of step sizes was fitted by a multiple Gaussian to allow for the possibility that the step-finding algorithm occasionally combines two adjacent steps into a double-size step (Fig. 9c). The most probable step size of 13·7° corresponds to 26 steps per revolution (360°/13·7°=26·3). Histograms of the dwelling angle of beads during several revolutions showed a 26-fold periodicity (Fig. 9d), confirming the step size and showing that the 26 stopping angles are the same in successive revolutions. Although average speeds varied from cell to cell because of uncontrolled low SMF, the step size was the same for all speeds.
Steps in slow flagellar rotation. (a) Reducing SMF and motor speed of a chimeric Na+-driven flagellar motor in E. coli by (upper) lowering external Na+ concentration (from 5 to 0·1 mm and back, black arrows) and (lower) photodamage. The speed doublings marked by red arrows indicate a change from one to two stators. (b) Stepping rotation of flagellar motors with a range of average speeds depending on different SMF. Insets show the positions of beads attached to flagellar filaments, scales in nanometers. Horizontal and radial lines indicate (1/26 revolution). (c) Step size distribution (black) with multiple Gaussian fit (red). The peak of forwards steps is 13·7°, indicating 26 steps per revolution. An example of steps identified by a step-finding algorithm is shown (inset). (d) Plot of angle against time during three revolutions, a histogram of dwell angles for the same revolutions and the power spectrum of that histogram. The peak at 26 per revolution corresponds to a step size of 13·8° and shows that the motor stops at the same angles on successive revolutions. Speeds shown in blue were measured using optical interferometry, those in black using high-speed fluorescence microscopy (insets in (a)). Data adapted from Sowa et al. (Reference Sowa, Rowe, Leake, Yakushi, Homma, Ishijima and Berry2005).
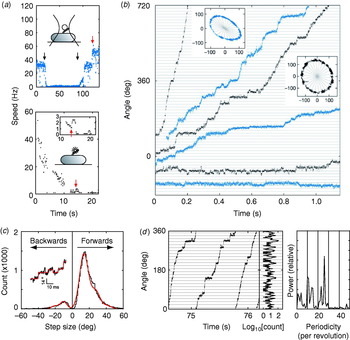
Stepping motion in ATP-driven molecular motors reflects both the discrete molecular nature of the fuel and the periodicity of the track along which the motor runs (Svoboda et al. Reference Svoboda, Schmidt, Schnapp and Block1993; Yasuda et al. Reference Yasuda, Noji, Kinosita and Yoshida1998). Twenty-six steps per revolution is consistent with the periodicity of the ring of FliG, the track on the rotor where rotational torque is believed to be generated (Suzuki et al. Reference Suzuki, Yonekura and Namba2004; Thomas et al. Reference Thomas, Francis, Xu and Derosier2006). Whether each step corresponds to a single-ion transit is not clear. However, previous data indicate that single ions in fully energised wild-type motors cannot drive steps as large as 13·7°. If ~10 torque-generating units pass ~1200 ions per revolution independently, then one ion in one unit should step about 3°, assuming tight coupling (Meister et al. Reference Meister, Lowe and Berg1987). Energy conservation sets an upper bound to the angle coupled to one ion transit, equal to (free energy per ion)/(average torque per unit). Taking a PMF of about −150 mV and a torque, driving a 1-μm bead, of ~150 pN nm per unit (Gabel & Berg, Reference Gabel and Berg2003; Reid et al. Reference Reid, Leake, Chandler, Lo, Armitage and Berry2006), gives an upper bound of ~10° per ion, which closely corresponds to the ~35-fold periodicity of the C ring. A similar calculation for the chimeric motor gives a similar result (Lo et al. Reference Lo, Leake, Pilizota and Berry2007). Either the coupling ratio is different at low SMF and low load or more than one ion (but less than two) is needed per step. Thus, the stepping results, like the new rotor structures, raise interesting unanswered questions about the roles of the different rings in the mechanism of torque generation. Interestingly, backward steps were common, particularly at the lowest speeds (Fig. 9b, c) and appeared to be slightly smaller than forward steps. Recent theoretical work indicates that careful statistical analysis of forward and backward steps can reveal the free-energy change driving a step and the details of substeps in the mechanochemical cycle (Linden & Wallin, Reference Linden and Wallin2007). What is needed is large quantities of stepping data under well-controlled conditions of known SMF (Lo et al. Reference Lo, Leake and Berry2006, Reference Lo, Leake, Pilizota and Berry2007). But at least now, after 30 years, it is possible to contemplate experiments on the elementary steps of bacterial flagellar motors at a single molecule level.
Models of the mechanism
Many models have been proposed for the mechanism of the bacterial flagellar motor and are summarised elsewhere (Berg & Turner, Reference Berg and Turner1993; Caplan & Kara-Ivanov, Reference Caplan and Kara-Ivanov1993; Berry, Reference Berry2000). The better-studied models, those that have been formulated within a mathematical framework that provides quantitative predictions for comparison with data, can be divided into three categories: ion turbines, ion turnstiles and binding with conformational change. In an ion turbine model, the path of ions across the membrane is formed partly by elements in the stator and partly by elements in the rotor, and these elements are arranged in lines that are tilted with respect to each other. The ‘elements’ can be half-binding sites on rotor and stator that need to be aligned to bind a permeant ion (Läuger, Reference Läuger1977) or ion channels in the stator that interact with tilted lines of charge on the rotor by long-range electrostatic interactions (Berry, Reference Berry1993; Elston & Oster, Reference Elston and Oster1997; Walz & Caplan, Reference Walz and Caplan2000). The charged residues on the surface of FliG that are involved in torque generation could in principle be arranged in such a way as to provide the electrostatic interactions that are proposed in the latter models. In a turnstile model, ions are deposited onto the rotor from outside the cell by one type of stator channel and can only complete a transit if the rotor rotates, carrying them to a second type of stator channel that connects to the cell interior (Khan & Berg, Reference Khan and Berg1983; Meister et al. Reference Meister, Caplan and Berg1989). This type of model is believed to describe well the mechanism of FO-ATPase, with an essential conserved residue on the c-subunit providing a probable binding site for ions halfway across the membrane (Vik & Antonio, Reference Vik and Antonio1994; Elston et al. Reference Elston, Wang and Oster1998). However, the lack of an equivalent essential residue in the flagellar motor is evidence against this type of model. In a conformational change model, ion transit through a stator is coupled to a cycle of conformational changes of the stator, which exerts torque on the rotor, either by long-range electrostatic or short-range steric interactions (Läuger, Reference Läuger1988). This type of mechanism is believed to describe the ATP-driven molecular motors actin–myosin and F1-ATPase. Conformational changes in MotA linked to the proposed ion-binding site in MotB provide indirect evidence for this type of model in the flagellar motor (Kojima & Blair, Reference Kojima and Blair2001). The most recent detailed study of a flagellar motor model, and the only one to date to successfully reproduce the knee in the torque–speed relationship, falls into the conformational change category (Xing et al. Reference Xing, Bai, Berry and Oster2006).
Reversibility and switching
The flagellar motors of E. coli are reversible in two different senses. Under natural conditions, with an IMF of around −150 mV, motors switch direction stochastically every second or so, under the control of the chemotactic signalling system. Also, non-switching mutants rotate in the opposite direction when the PMF is reversed. This was achieved using a K+ diffusion potential in Streptococcus (Berg et al. Reference Berg, Manson and Conley1982) and a voltage clamp in E. coli (Fung & Berg, Reference Fung and Berg1995). In both cases, only a fraction of motors rotated when the PMF was reversed, and in the E. coli experiment, only for a few revolutions, presumably because of detachment of stators caused by removal of the normal PMF. These results indicate that the mechanochemical cycle of the flagellar motor is essentially reversible, but the robustness of the motor to changes in PMF depends on species.
Chemotactic switching is induced by binding of the active phosphorylated form of the response regulator CheY (CheY-P) to FliM on the rotor (Welch et al. Reference Welch, Oosawa, Aizawa and Eisenbach1993; Toker & Macnab, Reference Toker and Macnab1997; Lee et al. Reference Lee, Cho, Pelton, Yan, Berry and Wemmer2001). CheY-P concentration in turn is controlled by the chemotactic signalling system, which has been the subject of extensive study (see recent reviews, Berg, Reference Berg2003b; Sourjik, Reference Sourjik2004; Parkinson et al. Reference Parkinson, Ames and Studdert2005; Baker et al. Reference Baker, Wolanin and Stock2006; Hazelbauer et al. Reference Hazelbauer, Falke and Parkinson2008). Using a GFP-labelled CheY in a mutant strain where all CheY is predicted to be phosphorylated to quantify the concentration of CheY-P in single cells, Cluzel et al. (Reference Cluzel, Surette and Leibler2000) discovered a very steep dependence of motor bias (probability of rotation in a particular direction) upon [CheY-P], with a Hill coefficient of ~10. This cannot be explained by cooperative binding, which was shown to be absent using fluorescence resonance energy transfer to quantify the binding between the CheY and FliM labelled with spectral variants of GFP (Sourjik & Berg, Reference Sourjik and Berg2002; Sourjik et al. Reference Sourjik, Vaknin, Shimizu and Berg2007).
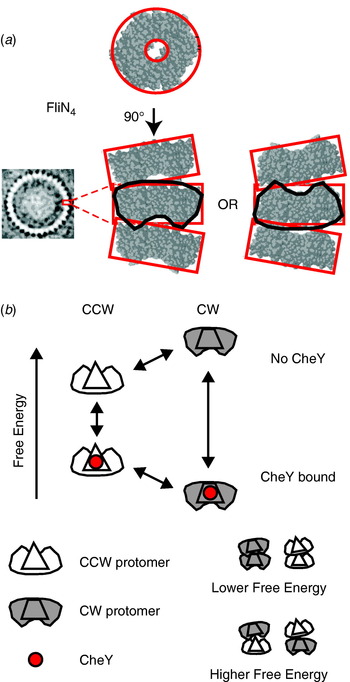
The best candidate to explain the switch mechanism is the conformational spread model (Fig. 10; Duke et al. Reference Duke, Le Novere and Bray2001) in which the rotor contains ~34 bi-stable protomers, each consisting of a tetramer of FliN, one copy of FliM and approximately one of FliG (Brown et al. Reference Brown, Terrazas, Paul and Blair2007). The steep dependence and lack of cooperative binding are predicted if there is a free-energy penalty for adjacent protomers in different states, so that the entire rotor is most stable with all protomers in either the CW or CCW states. A recent atomic structure of a tetramer of FliN (lacking 50 amino acids at the C terminal) shows a puckered ring (Fig. 10a; Paul & Blair, Reference Paul and Blair2006; Paul et al. Reference Paul, Harmon and Blair2006) that fits well into the bottom of the C ring from EM reconstructions (Figs 1 and 8a). [Note that a previous alternative docking of FliN into the rotor based on a dimeric crystal structure is now thought to be wrong (Brown et al. Reference Brown, Mathews, Joss, Hill and Blair2005).] The pucker breaks the symmetry of the tetramer in such a way that tetramers could stack in two equivalent ways, pointing either way around the C ring. Thus, the FliN tetramer is a good candidate for the bi-stable element in the conformational spread model, with the coupling energy penalty arising when adjacent tetramers are puckered in opposite directions. Recent improvements in the time resolution of single-molecule measurements of flagellar rotation will allow testing of the detailed predictions of the conformational spread model in the near future.
(a) X-ray crystal structure of the FliN tetramer showing the puckered ring structure and proposed equivalent stacking configurations of tetramers in the C ring (EM structure of C ring, left). (b) Conformational spread model of flagellar switching. Protomers consisting of a FliN tetramer and one molecule of FliM can be in either CW or CCW configurations, with or without bound CheY. CheY binding lowers the free energy of the CW configuration relative to CCW, increasing the probability of CW rotation. Adjacent protomers have a lower free energy of interaction when both are in the same state, which leads to cooperative switching of the whole ring.

Outlook
Recent experiments that have applied in vitro single-molecule techniques to flagellar motors in vivo promise substantial advances in our understanding of the flagellar motor in the near future. Early discoveries using these methods are that flagellar motors with a single stator take 26 steps per revolution (Sowa et al. Reference Sowa, Rowe, Leake, Yakushi, Homma, Ishijima and Berry2005), that stators are in a constant process of turnover (Leake et al. Reference Leake, Chandler, Wadhams, Bai, Berry and Armitage2006) and that the zero-torque speed is independent of stator number (Yuan & Berg, Reference Yuan and Berg2008). What is needed now is a systematic study of flagellar steps: their statistical properties, dependence on IMF and the possible existence of substeps. These measurements will offer the same considerable insights into the mechanism as equivalent single-molecule experiments on ATP-driven molecular motors in the past 15 years. The flagellar motor is the first ion-driven molecular machine that can be studied at this level of mechanical detail. The chimeric sodium-driven motor in E. coli and the newly developed fluorescent methods to measure both components of the SMF offer exciting new possibilities. Because the enthalpic (membrane voltage) and entropic (ion concentration gradient) components of the IMF are of similar magnitude, unlike ATP hydrolyis where the dominant free-energy change is usually enthalpic, this work will offer insight into the fundamental question of how molecular motors convert the different components of free energy into mechanical work. An important factor will be increased time resolution in the techniques for detecting flagellar rotation. Smaller labels, for example quantum dots or gold nanoparticles attached either directly to hooks (Yuan & Berg, Reference Yuan and Berg2008) or to filaments via stiffer than normal hooks or possibly fluorescent proteins incorporated into the rotor or hook, are likely to be the way forward. With increased time resolution, it will be possible to discover the details of flagellar stepping, the torque–speed relationship, the switching process and the turnover of motor components. Finally, without detailed atomic-level structures of the rotor and stator, it will not be possible to understand the precise structural and mechanical details of the coupling mechanism, even if mechanical and biochemical experiments reveal the kinetics and energetics. Recent successes in obtaining partial atomic structures of rotor proteins, and in docking these into even better EM reconstructions of the rotor, show the way forward. The biggest challenge will be to obtain atomic-level structures of stators, as these are large transmembrane complexes that are now known to interact dynamically with the rotor as well as the cell wall.
Acknowledgements
The authors thank George Wadhams for a critical reading of this manuscript. Y. S. was supported by JSPS Postdoctoral Fellowships for Research Abroad.