Introduction
Numerous studies in both humans and animals have revealed a compelling association between lower status and poorer health (Adler & Ostrove, Reference Adler and Ostrove1999; Brunner, Reference Brunner, Berkman and Kawachi2000; Sapolsky, Reference Sapolsky2004; Marmot, Reference Marmot2006). In humans, the relationship between socioeconomic status (SES) and health not only exhibits a strong, gradient pattern, but has held in both Western and non-Western contexts such as in China and Taiwan (Liu et al., Reference Liu, Hermalin and Chuang1988; Liang et al., Reference Liang, McCarthy, Jain, Krause, Bennett and Gu2000; Zimmer et al., Reference Zimmer, Natividad, Lin and Chayovan2000, Reference Zimmer, Martin, Ofstedal and Chuang2007). Since more conventional risk factors such as lack of health care access and personal health behaviours have failed to explain much of the gradient (Lantz et al., Reference Lantz, House, Lepkowski, Williams, Mero and Chen1998; Adler & Ostrove, Reference Adler and Ostrove1999; Sapolsky, Reference Sapolsky2005), researchers have more recently focused attention on other possible mechanisms, including those of a psychosocial nature, such as the role of stress, for explanatory power (Baum et al., Reference Baum, Garofalo and Yali1999; Cohen et al., Reference Cohen, Kaplan and Salonen1999; Sapolsky, Reference Sapolsky2005).
There are good reasons to think that stress plays a role in the disproportionately negative health of those of low SES. For example, those with low SES may very well experience work characterized by high demands and low control, residential environments with higher levels of crime and general blight, and feelings of lowliness and inferiority (Taylor et al., Reference Taylor, Repetti and Seeman1997; Wilkinson, Reference Wilkinson1999; Evans & English, Reference Evans and English2002; Gallo et al., Reference Gallo, Bogart, Vranceanu and Matthews2005). Recognizing these conditions, and more generally the importance of subjective evaluation in health (Idler & Benyamini, Reference Idler and Benyamini1997; Krause, Reference Krause, Binstock and George2001), health researchers have recently introduced a subjective measure of social status in the form of a pictorial ladder to better understand how SES ‘gets under the skin’ to cause health outcomes. Studies have shown that traditional measures of objective SES (e.g. levels of education, income and occupation) are significant predictors of subjective social status (Adler et al., Reference Adler, Epel, Castellazzo and Ickovics2000; Singh-Manoux et al., Reference Singh-Manoux, Marmot and Adler2005). However, it has been argued that subjective measures of status have advantages over objective measures in older populations in part because it is difficult in these populations to precisely measure income, education, labour force participation and financial assistance from various sources (Goldman et al., Reference Goldman, Cornman and Chang2006a). Moreover, other important phenomena in addition to objective measures are incorporated in subjective assessments. These other phenomena include financial strain, low social support, marital status, low perceived personal opportunity, greater perceived victimization and chronic stress (Adler et al., Reference Adler, Epel, Castellazzo and Ickovics2000; Singh-Manoux et al., Reference Singh-Manoux, Adler and Marmot2003; Franzini & Fernandez-Esquer, Reference Franzini and Fernandez-Esquer2006; Goldman et al., Reference Goldman, Cornman and Chang2006a; Cornman et al., Reference Cornman, Goldman, Collins, Glei, Hurng and Weinstein2012). Particularly important to subjective social standing in the context of Asian cultures may be the number of the respondent's sons and the level of education of these sons (Goldman et al., Reference Goldman, Cornman and Chang2006a).
Subjective ladder assessments have predicted a wide variety of health outcomes, even with controls for objective SES indicators. These outcomes have included reduced grey matter in the anterior cingulated cortex (which indicates physiological reactivity to psychosocial stress), diabetes, physical functioning status and mortality (Ostrove et al., Reference Ostrove, Adler, Kuppermann and Washington2000; Singh-Manoux et al., Reference Singh-Manoux, Adler and Marmot2003, Reference Singh-Manoux, Marmot and Adler2005; Collins & Goldman, Reference Collins and Goldman2008; Garbarski, Reference Garbarski2010). Importantly, prospective and experimental studies have shown that anxiety and depression are largely mediators of the connection between subjective social status and health, rather than being cofounders (Cohen et al., Reference Cohen, Line, Manuck, Rabin, Heise and Kaplan1997; Lemeshow et al., Reference Lemeshow, Fisher, Goodman, Kawachi, Berkey and Colditz2008; Mendelson et al., Reference Mendelson, Thurston and Kubzansky2008; Kraus et al., Reference Kraus, Adler and Chen2013). In one of the few experimental, prospective studies involving a health outcome that was not self-reported, Cohen et al. (Reference Cohen, Alper, Doyle, Adler, Treanor and Turner2008) found that those reporting lower subjective standing were more likely to acquire the common cold after being exposed to a cold virus. This association was independent of objective measures of SES and of cognitive, affective and social disposition that might provide alternative spurious (third factor) explanations for the association. As used in this paper, then, the subjective ladder assessments are assumed to be influenced by important social phenomena – beyond those captured by objective measures of SES – that affect health.
Although the previously mentioned studies have certainly contributed to our understanding of the connection between status and health, they are not without their limitations. These investigations have often been characterized by relatively small sample sizes, non-representative samples, self-reported measures of health or study populations drawn from Western contexts. The paper here extends this literature by using a large, nationally representative survey conducted in a non-Western population with the main health outcome of interest being biomarkers whose levels could not easily be known to the respondents. Further, as far as the authors are aware, this is the first study to analyse two forms of the subjective social status ladder question – one querying participants' relative ranking in the entire society (which prompts respondents to consider their levels of education, income and job type), and the other querying participants' relative ranking in the community (without any prompt) – in connection with neuroendocrine system function.
Investigations of the neuroendocrine system are important because recent large-scale studies, including neuroendocrine markers for the first time, have linked dysregulated neuroendocrine biomarker profiles to increased risk of a number of health problems, including greater physical and cognitive declines and mortality (Seeman et al., Reference Seeman, McEwen, Rowe and Singer2001; Karlamangla et al., Reference Karlamangla, Singer, Greendale and Seeman2005; Goldman et al., Reference Goldman, Turra, Glei, Lin and Weinstein2006b). Relatedly, it is thought that chronic stress plays an important role in contributing to such dysregulated profiles (McEwen, Reference McEwen1998; Timiras & Gersten, Reference Timiras, Gersten and Timiras2007). The present study, then, investigated neuroendocrine system function as a potential physiological pathway that explains some of the association between social status and health, and it was hypothesized that those reporting lower levels of subjective social status would have more dysregulated neuroendocrine biomarker profiles (even after controlling for objective indicators of SES).
Data and Methods
Overview of the data set
Data were from the Social Environment and Biomarkers of Aging Study (SEBAS), a population survey conducted in Taiwan in 2000 (for a more detailed description of the study consult Goldman et al., Reference Goldman, Weinstein, Chang, Lin, Chuang and Lin2003). The survey is nationally representative of those aged 54 and older and includes the institutionalized population. The SEBAS draws on a random sub-sample of respondents interviewed as part of the Survey of Health and Living Status of the Near Elderly and Elderly in Taiwan. This longitudinal survey began in 1989 with a national sample of 4049 persons aged 60 and older (response rate, 92%), and was expanded in 1996 to include a new cohort of 2462 persons aged 50–66 in 1996 (response rate, 81%). Both cohorts were re-introduced in 1999 (response rate, 90% of survivors). Among those interviewed in 1999, a random sub-sample was selected for the 2000 SEBAS.
The interview portion of the SEBAS included questions about cognitive and physical functioning, psychological well-being, living arrangements and SES. With the respondents' additional consent, they were scheduled for a medical examination several weeks after the interview. The medical examination included collection of blood and urine samples to produce a panel of physiological measurements, and also recorded information such as height and weight, blood pressure and included a check for a number of health problems.
Of those initially contacted for inclusion in the 2000 SEBAS, 92% gave interviews and 68% of these participants consented to the clinical examination, for a total of 1023 respondents. It was found that respondents 71 and over were less likely to participate in the medical examinations compared with those younger than those ages. However, since there were no differences with respect to sex, various measures of SES, or aspects of health status, with the presence of controls for age, estimates derived from clinical information are unlikely to be seriously biased (Goldman et al., Reference Goldman, Weinstein, Chang, Lin, Chuang and Lin2003). Of those respondents who participated in the clinical examination, only ten failed to fully comply (by not following the urine protocol, by not providing a sufficient volume of blood suitable for analysis or by not completing the medical examination). In about 4% of all cases proxies helped answer some questions for the respondents. The survey over-sampled those 71 years and older and urban residents.
Dependent variables
The study focused on cortisol, dehydroepiandrosterone sulphate (DHEAS), adrenaline, noradrenaline and dopamine, a class of neuroendocrine markers indicative of hypothalamic–pituitary–adrenal (HPA) axis and sympathetic nervous system (SNS) functioning (Cohen et al., Reference Cohen, Kessler, Gordon, Cohen, Kessler and Gordon1995; Bergquist et al., Reference Bergquist, Sciubisz, Kaczor and Silberring2002; Sapolsky, Reference Sapolsky2004). Since these markers have been used as part of the allostatic load (AL) construct, when they are analysed collectively in an index, the index is referred to as neuroendocrine allostatic load (NAL) (for discussion of the allostatic framework and the NAL index consult Gersten, Reference Gersten2008).
Twelve-hour overnight urinary samples were collected from respondents for measurement of all markers except DHEAS, for which blood was drawn. Subjects provided samples while under basal (resting) conditions and fasted in advance of the blood draw. The urine samples were collected in cooled containers with preservatives (Na2S2O5). In part because dissimilar body size leads to differential concentrations of the markers in urine, total urine was standardized using grams of creatinine. Blood and urine specimens were sent to Union Clinical Laboratories (UCL) in Taipei, Taiwan, a few hours after they were collected. In addition to routine standardization and calibration tests performed by the laboratory, blind duplicate samples were submitted to UCL periodically throughout the fieldwork and a further set of duplicates were sent to Quest Diagnostics in the United States. Data from duplicate samples indicated intra-lab correlations (UCL and UCL) of 0.80 or higher and inter-lab correlations (UCL and Quest Diagnostics) of 0.76 or higher (Goldman et al., Reference Goldman, Weinstein, Chang, Lin, Chuang and Lin2003). The blood and urine samples were frozen and preserved for future research.
Independent variables
The first subjective status measure asks respondents to place themselves on a ladder (a picture of which is shown to them) that corresponds to ‘where people stand in Taiwan’. The ladder has a total of ten rungs, with the 10th rung corresponding to the highest level of status. Respondents are prompted to consider their income/wealth, educational level and the prestige of their job in determining their status (i.e. ‘At the top of the ladder are the people who are the best off – those who have the most money, the most education and the most respected jobs.’). The second subjective status question is identical to the one shown to respondents moments before, but this time they are instructed to rate themselves as regards their community status. Community is not defined for the respondents, and they are not given any prompts as to what might be important criteria to consider in making their decision (i.e. ‘People define community in different ways; please define it in whatever way is most meaningful to you.’). If respondents have trouble defining ‘community’ by themselves, they are probed using the word ‘neighbourhood’ (where they live and the surrounding area).
Other independent variables serve as controls. The three objective measures of SES are years of education for the respondent, years of education for the respondent's spouse and an International Socio-Economic Index (ISEI) score for the primary lifetime occupation of male respondents and of female respondents' husbands. The ISEI is a widely used measure reflecting occupational status and has a theoretical range of 16–90 (Ganzeboom & Treiman, Reference Ganzeboom, Treiman, Hoffmeyer-Zlotnik and Wolf2003). Information from female respondents' husbands was used because nearly one-third of the female participants in the survey were never employed. Objective indicators of status were included in the models along with subjective ones in part to determine whether any relationship between the subjective measures and biomarkers can be explained by more traditional objective factors alone.
Since levels of the neuroendocrine biomarkers can be influenced by a wide variety of factors independent of stress (Gersten, Reference Gersten2005), all models controlled for variables pertaining to diet, exercise, smoking, alcohol consumption, betel nut chewing, medication use, age and sex.
Analytical methods
For extreme values, five outliers for dopamine were removed that were all at least six standard deviations above the mean. Concerning other data transformations, cortisol had a distribution that exhibited the most skewness in one direction or the other (in its case, a right tail) and was logged, creating a more normalized distribution and more normalized residuals. Moreover, DHEAS and adrenaline had values below assay sensitivity, which were originally coded in the dataset as 0, and these were re-coded to the lowest detection limit. Further, an analysis sample was created that included the observations for which there were no missing values on the independent variables of interest.
The most popular approach to operationalizing AL has been to create a score that gives one point for every biomarker for which the subject can be considered at higher risk (i.e. the elevated risk zone approach). The literature most often represents high risk by greater values for cortisol, adrenaline and noradrenaline, and lower values for DHEAS (Seeman et al., Reference Seeman, Singer, Rowe, Horwitz and McEwen1997; Kubzansky et al., Reference Kubzansky, Kawachi and Sparrow1999; Loucks et al., Reference Loucks, Juster and Pruessner2008); this convention is followed here. Relative to the other markers under study in this paper, relatively little research has been conducted on dopamine, but the literature suggests that low levels are a risk factor for a number of health conditions and that it is reasonable to hypothesize (as is done in this paper) that those of lower social status have lower baseline levels (Isovich et al., Reference Isovich, Mijnster, Flugge and Fuchs2000; Backman & Farde, Reference Backman and Farde2001; Wood, Reference Wood2004; Sapolsky, Reference Sapolsky2004, p. 295). Since there is no agreed upon standard for what biomarker values represent different risk levels, it has been most common to define risk as above or below distribution percentiles (e.g. 10th, 25th, 75th and 90th) (Seeman et al., Reference Seeman, Singer, Rowe, Horwitz and McEwen1997; Kubzansky et al., Reference Kubzansky, Kawachi and Sparrow1999; Goldman et al., Reference Goldman, Glei, Seplaki, Liu and Weinstein2005). Since subjects can be assigned 1 point on five biomarkers if they have high-risk values, NAL scores can range from 0 to 5. In this scheme, the biomarkers are weighted equally. The NAL scores can be interpreted as a measure of neuroendocrine system dysregulation: the greater the score, the greater the dysregulation.
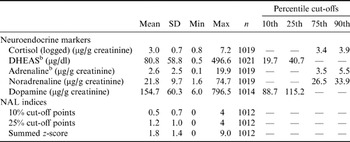
In addition to NAL scores based on cut-off points, a summed z-score was created for respondents. The z-score was created because the cut-off point method of scoring may not be sensitive to gradations in risk. The z-score is the total number of standard deviations from the mean in the direction of high risk for each biomarker. Unlike the cut-off approach (in which the NAL score can only range from 0 to 5), an index using the z-score method allows for unequal weighting of the markers (and so the index can range from zero no pre-determined upper limit). Like the biomarkers analysed individually, the combined z-score will be the dependent variable in an OLS regression. The NAL score based on cut-off points was analysed using ordered logistic regression. Lastly, the analysis made use of weighted data that account for the survey's multistage sampling design. Descriptive statistics for the individual markers and for the different NAL constructs are presented in Table 1.
Descriptive statistics and cut-off points for the neuroendocrine biomarkers and descriptive statistics for the neuroendocrine allostatic load (NAL) indices, sample population, ages 54–91, both sexes, Taiwan (2000) a

a The tabulations are based on weighted survey data. The literature most often represents high risk by greater values for cortisol, adrenaline and noradrenaline and lower values for DHEAS, a convention that is followed here. Also based on the literature, it is hypothesized that low dopamine values pose risk.
b Values below assay sensitivity were coded at the lowest detection limit.
Both ladder measures were included together in the models because while it was expected that they would be correlated with one another, there is reason to believe they are capturing different social phenomena and will be independently associated with biomarker levels. The ladders' joint significance was tested through an F-test.
Results
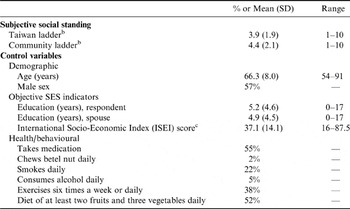
Table 2 depicts descriptive statistics for independent variables used in this analysis. Notably, because of mainly male emigration to Taiwan shortly after World War II (sparked by conflict on mainland China), there are more men than women in the sample. Also noteworthy is that respondents, on average, tend to rate themselves more highly (by about half a rung on the ladder) in reference to community standing compared with standing in all of Taiwan. This difference is highly significant (p<0.001), calculated using a paired t-test appropriate for weighted data.
Descriptive statistics for the independent variables in the analysis, effective sample (N=930), ages 54–91, both sexes, Taiwan (2000) a

a The tabulations are based on weighted survey data.
b Ten represents the highest status and 1 the lowest.
c Calculated for the respondent if male and for the respondent's spouse if female.
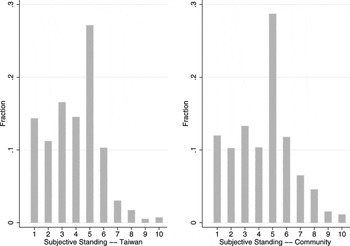
Figure 1 presents the distributions of self-reported standing in Taiwan and in the community. Both distributions are right-tailed, with comparatively few participants willing to rate themselves highly either relative to the Taiwanese population or relative to their communities. This type of skewed distribution, which may partially reflect Taiwanese modesty, contrasts with distributions stemming from surveys conducted in Western populations in which the data more resemble a normal curve (and sometimes even have a tilt towards high values) (Adler et al., Reference Adler, Epel, Castellazzo and Ickovics2000; Singh-Manoux et al., Reference Singh-Manoux, Marmot and Adler2005; Goldman et al., Reference Goldman, Cornman and Chang2006a). As mentioned before, participants in the SEBAS were more willing to rate themselves higher in reference to their communities. This can be observed from the figure, as, for example, nearly two times as many subjects were willing to give themselves a ‘7’ rating in the community compared with that in Taiwan, and such a proportional increase also applied to other ratings at the higher end (i.e. the 8th, 9th, and 10th rungs) of the ladder. Suggesting more similarity in the rankings on the subjective social status measures, the Pearson correlation coefficient between the two different measures is 0.77.
Distributions of self-reported standing in Taiwan and in the community for the sample population, ages 54–91, both sexes, 2000. The tabulations are based on unweighted survey data. Ten represents the highest status and 1 the lowest.

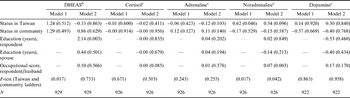
Table 3 presents results for OLS regressions in which different neuroendocrine biomarkers are the dependent variables and standing in the community, standing in Taiwan and objective indicators of SES are the key independent variables. For cortisol, adrenaline and dopamine the subjective social status ladders individually and jointly were not related to riskier levels. Objective indicators of status also were not related to those markers. For DHEAS, though, higher self-reported status was correlated with higher (and thus less risky) DHEAS levels. However, the associations between the subjective status assessments and DHEAS levels disappeared with inclusion of objective indicators for SES.
Estimated regression results with different neuroendocine biomarkers as the dependent variables and reports of subjective social status as the highlighted independent variables, ages 54–91, both sexes, Taiwan (2000) a
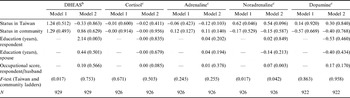
a Each column presents results from different OLS regressions in which a single neuroendocrine marker (measured continuously) is the dependent variable. The regression coefficients are unstandardized and precise levels of statistical significance are in parentheses. All of the analysis is based on weighted survey data and regressions include baseline controls (i.e. medication use, diet, exercise, alcohol consumption, betel quid chewing and smoking) and those for age and sex.
b µg/dl.
c µg/g creatinine.
Contrary to expectation, for noradrenaline, report of higher status in Taiwan was associated with higher (and thus more risky) levels of that biomarker. The relationship does not hold, however, with inclusion of the objective indicators of status. Although statistically significant, the observed relationships for DHEAS and noradrenaline in regard to objective measures of SES were of minor substantive significance (e.g. an increase of 3 years of education was associated with an increase of about 1/9th of a standard deviation in DHEAS levels).
Motivated by the literature, additional analyses were carried out in which the biomarkers remained dependent variables in the analysis (as presented in Table 3), but this time the dependent variables were dichotomized into ‘risky’ and ‘non-risky’ values using the biomarker-specific cut-off points in Table 1 (i.e. the 10th and 25th or 75th and 90th percentiles) and analysed using logistic regression. By and large, this method of analysis produced results (not shown) that were similar, although somewhat weaker, than those presented.
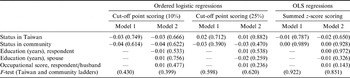
Table 4 presents data similar to those in Table 3, but in this case the dependent variable was not individual neuroendocrine biomarkers, but NAL scores. As can be observed from the table, the coefficients for the different subjective social status variables are by and large in the hypothesized direction, with higher status yielding lower (and thus less risky) scores. However, none of the associations reaches conventional levels of statistical significance. Higher status as measured with the objective indicators were also not associated with higher NAL scores.
Estimated regression results with neuroendocrine allostatic load (NAL), scored using different methods, as the dependent variable and reports of subjective social status as the highlighted independent variables, N=921, ages 54–91, both sexes, Taiwan (2000) a
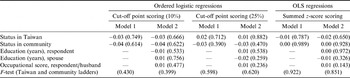
a The first four columns present results from ordered logistic regression and the last two from OLS regressions in which the NAL score is the dependent variable. The regression coefficients are unstandardized and precise levels of statistical significance are in parentheses. All of the analysis is based on weighted survey data and regressions include baseline controls (i.e. medication use, diet, exercise, alcohol consumption, betel quid chewing and smoking) and those for age and sex.
Numerous variants of the analysis thus far presented were also carried out. For instance, instead of entering the status measures as continuous variables, they were entered as variables grouped into low, medium and high categories (pertaining to rungs 1–4, 5 and 6–10, respectively). Also, instead of analysing men and women together and using cut-off points based on the entire sample, analyses were re-run separately by sex and based on sex-specific cut-off points. Further, since there is a fair amount of evidence to suggest that for cortisol, not only high, but low values as well, pose risk (Raison & Miller, Reference Raison and Miller2003; Fries et al., Reference Fries, Hesse, Hellhammer and Hellhammer2005; Loucks et al., Reference Loucks, Juster and Pruessner2008), analyses were re-run examining both tails of cortisol's distribution for the marker analysed separately and as part of the NAL constructs. All of the additional analyses just described produced results (data not shown) consistent with the main findings that have already been discussed.
Discussion
The main goal of this paper was to investigate whether different measures of subjective social standing were linked to riskier neuroendocrine biomarker profiles (with cortisol, adrenaline, noradrenaline, DHEAS and dopamine analysed separately and in an index). Using a nationally representative study conducted in Taiwan (the 2000 SEBAS), it was found that with the exception of DHEAS, the results do not support such a link.
As far as the authors are aware, this is the first study to investigate the connection between baseline levels of the neuroendocrine markers (as measured in overnight urine samples, except for DHEAS which was measured in blood samples) and two differently worded measures of subjective social status. Another data set that appears to have collected some baseline levels of the neuroendocrine biomarkers in a similar fashion to the SEBAS and to have measured at least one type of subjective social status is the Coronary Artery Risk Development in Young Adults (CARDIA) study (Janicki-Deverts et al., Reference Janicki-Deverts, Cohen, Adler, Schwartz, Matthews and Seeman2007; Adler et al., Reference Adler, Singh-Manoux, Schwartz, Stewart, Matthews and Marmot2008). As far as the authors are aware, however, researchers have yet to publish work using it to analyse neuroendocrine levels in reference to subjective social status.
Although limited, some work has investigated objective measures of SES with respect to levels of the neuroendocrine biomarkers as collected in the study analysed here. The results of this work appear mixed, with investigations finding both positive relationships (Cohen et al., Reference Cohen, Doyle and Baum2006; Evans & Kim, Reference Evans and Kim2007; Janicki-Deverts et al., Reference Janicki-Deverts, Cohen, Adler, Schwartz, Matthews and Seeman2007) and no relationships (Dowd & Goldman, Reference Dowd and Goldman2006; Gersten et al., Reference Gersten, Dow and Rosero-Bixby2010) between higher SES and riskier neuroendocrine levels.
Although Dowd & Goldman (Reference Dowd and Goldman2006) analysed the SEBAS, the present study extended their work in key respects in addition to examining subjective social status. For instance, instead of analysing income (which is problematic in a retired population), the study here analysed the primary lifetime occupation of male respondents and of female respondents' husbands. In the case of years of education, this study also analysed the years of education for the respondent's spouse. This analysis is important because many older women in East Asia are illiterate and have low levels of formal education, even though their spouses and children may have higher levels of education and be better off materially (Goldman et al., Reference Goldman, Cornman and Chang2006a). Also, in reference to the biomarkers, dopamine was analysed in addition to the other neuroendocrine markers traditionally used in the AL construct. Further, this study analysed both low and high values of cortisol since research has shown that low values of cortisol might also be risky (Raison & Miller, Reference Raison and Miller2003; Fries et al., Reference Fries, Hesse, Hellhammer and Hellhammer2005; Loucks et al., Reference Loucks, Juster and Pruessner2008). This study also controlled for a number of factors (such as smoking and betel nut consumption) that might influence the level of the neuroendocrine markers at the time of collection (Gersten, Reference Gersten2005).
Like any study, this one has its limitations. Negative findings such as found in this paper could stem from a number of sources, one of the more important being how biomarkers are collected and measured. Ideally, instead of one overnight urine sample as collected in the SEBAS, there would be about three per week over the course of 2 or 3 weeks (Loucks et al., Reference Loucks, Juster and Pruessner2008). The necessity for so many measures stems from the possibility that ‘state factors’ unrelated to stressor exposure (such as sleep duration and quality, diet and exercise) influence the levels of the markers (Gersten, Reference Gersten2005; Loucks et al., Reference Loucks, Juster and Pruessner2008). Further, it would be better if overnight urinary measures were complemented with those that provided information about how neuroendocrine levels change during the day. Salivary cortisol measures, for example, could provide such dynamic information with only a limited number of samples (about five or more). Having information on subjects' cortisol levels over the day is important since it appears that in older persons the diurnal rhythm tends to flatten, exhibiting less of a morning rise and less of a night-time low, compared with their younger counterparts (Van Cauter et al., Reference Van Cauter, Leproult and Kupfer1996; Magri et al., Reference Magri, Terenzi, Ricciardi, Fioravanti, Solerte and Stabile2000; Ice et al., Reference Ice, Katz-Stein, Himes and Kane2004). Such a flattening of the rhythm may be harmful and might be more likely to come about or hastened with greater exposure to low status. Lastly, some measure of respondent reactivity to one or more stressors and the time needed to return to baseline levels would be valuable since it appears that those with a compromised neuroendocrine system are ‘sluggish’ in returning to a basal state (Seeman & Robbins, Reference Seeman and Robbins1994; Sapolsky, Reference Sapolsky2004). It must be noted, however, that some of these improvements in data collection would add to the already sizeable burden of carrying out a large population study such as the one analysed here.
As mentioned before, this paper analysed two versions of a subjective social status question. The first asked respondents to rate themselves relative to those in all of Taiwan (taking into account their income/wealth, level of education and job type) and the second asked respondents to rate themselves only in reference to their community, however they chose to define it. Of the two versions, it was thought that respondents would rate themselves more highly in the community, and this was indeed the case. Lives are lived in particular geographic locations and communities and it is likely that people positively value many of the social relations and roles they assume in these spheres, translating into higher ratings on this version of the status question. Further, it was reasoned that the different status questions would each capture a different aspect of status that would independently influence biomarker values. Results with both ladders in the models revealed, however, that this was not the case.
The similarity in responses to the two status questions might have something to do with the order in which they were presented to survey respondents and the fact that the question asked first (about status in all of Taiwan) was accompanied with a prompt (i.e. ‘At the top of the ladder are the people … with the most money, the most education and the most respected jobs.’). As we tried answering the two status questions the prompt remained salient in our thinking when trying to answer the second, even though it was worded differently and contained no prompt. If the first status question did not contain a prompt, a positive consequence might be that respondents would be more likely to consider a wider array of factors in assessing their level of status, factors such as feelings of discrimination, neighbourhood traits (e.g. neighbourhood safety and amenities) and characteristics of those who are close to them (e.g. educational levels and resources of their spouse and children). In other words, a promptless question might better capture feelings of lowliness and insecurity that authors such as Wilkinson (Reference Wilkinson1999) have argued are detrimental to health. Indeed, it is interesting to note that one of the most predictive measures of a wide variety of future health outcomes is that of current, self-rated health, a question that typically has no prompts (Idler & Benyamini, Reference Idler and Benyamini1997).
To conclude, the results here suggest that SES and subjective social status do not influence basal levels of a number of neuroendocrine biomarkers or indices based on these markers in older subjects. However, to strengthen and broaden such a conclusion, more and different measures of neuroendocrine system function should be collected as part of study designs. Further, if the subjective social status questions analysed in this study are used in other studies, it is recommended that the one asking about community status (without a prompt) be asked first. Of the neuroendocrine markers investigated in this paper, DHEAS is one of the more intriguing, in part because of its sharp decline with age and, as found in this study, its connection to subjective social status and an objective measure of SES.
Acknowledgments
This research was generously supported by grants from the National Institute on Aging (K12 AG00981-01 and K07 AG19145-05) and UC Berkeley's Center on the Economics and Demography of Aging (CEDA). The authors thank Shu-Ling Tsai, David Schak, Richard Williams, Ken Wachter, Will Dow, the anonymous reviewers, and others for helpful advice and comments.