Implications
The objective of this study was to analyze the effects of the body reserves (measured by body condition score, BCS) induced by feeding, on productive and reproductive variables, independent of other factors inherent in the environment and/or the individual animal capacity for intake. The experiment demonstrated that nutritionally regulated BCS at −30 days had positive effects on fat-corrected milk production and on days to first ovulation, which was associated with a better pre-partum endocrine milieu. Multiparous cows were more adapted to increased milk production and to reinitiate post-partum ovarian cyclicity earlier compared with primiparous cows.
Introduction
During early lactation, the primary challenge faced by cows is a sudden and marked increase in nutrient requirements for milk production, at a time when dry matter intake, and thus nutrient supply, lags behind (Drackley, Reference Drackley1999). Moreover, the decreased intake that characterizes the transition period (3 weeks before and 3 weeks after calving) can reach up to 30% and is one of the causes of negative energy balance (NEB; Grummer, Reference Grummer1995; Grummer et al., Reference Grummer, Mashek and Hayirli2004). This period of NEB is characterized by fat mobilization, which is reflected by an elevation of circulating concentrations of non-esterified fatty acids (NEFA; Pedron et al., Reference Pedron, Cheli, Senatore, Baroli and Rizzi1993; Ingvartsen and Andersen, Reference Ingvartsen and Andersen2000; Burke and Roche, Reference Burke and Roche2007), and which is often accompanied with an increase in the concentration of β-hydroxybutyrate (BHB; Whitaker et al., Reference Whitaker, Goodger, Garcia, Perera and Wittwer1999).
Body condition score (BCS) at calving and the degree of BCS loss between calving and BCS nadir have profound effects on milk production (Roche et al., Reference Roche, Lee, Macdonald and Berry2007). There is the nonlinear relationship between calving BCS and subsequent milk production, and the collective literature makes a compelling case for an optimum calving BCS for milk production between 3.0 and 3.5 in Holstein–Friesian dairy cows (Roche et al., Reference Roche, Friggens, Kay, Fisher, Stafford and Berry2009). BCS loss also has negative effects on reproduction: cows that lost one or more units of BCS during early lactation had a major risk for infertility, with a reduction in conception rates from 17% to 38% (Butler, Reference Butler2000). It is accepted that the endocrine pathways that regulate the reproductive axis regarding metabolic status include insulin and insulin-like growth factor I (IGF-I; Spicer et al., Reference Spicer, Alpizar and Echternkamp1993; Lucy, Reference Lucy2000; Kawashima et al., Reference Kawashima, Sakaguchi, Susuki, Sasamoto, Takahashi, Matsui and Miyamoto2007).
Contradictory information is reported on the effect of parity on post-partum anestrus length: primiparous cows (P cows) had longer post-partum anestrus than multiparous cows (M cows) under confined (Tanaka et al., Reference Tanaka, Arai, Ohtani, Uemura, Kuroiwa, Kim and Kamomae2008) and grazing (Meikle et al., Reference Meikle, Kulcsar, Chilliard, Febel, Delavaud and Cavestany2004) production systems; in addition, P cows presented shorter anestrus than M cows (Kawashima et al., Reference Kawashima, Kaneko, Amaya, Matsui, Yamagishi, Matsunaga, Ishii, Kida, Miyake and Miyamoto2006) or no effect of parity was observed (Stein et al., Reference Stein, Allen, Perry, Bruner, Gates, Rehberger, Mertz, Jones and Spicer2006; Cavestany et al., Reference Cavestany, Viñoles, Crowe, La Manna and Mendoza2009). In addition, endocrine concentrations have been reported to differ according to parity: IGF-I concentrations after calving were greater (Taylor et al., Reference Taylor, Cheng, Pushpakumara, Beever and Whates2004; Wathes et al., Reference Wathes, Cheng, Bourne, Taylor, Coffey and Brotherstone2007) or lower (Meikle et al., Reference Meikle, Kulcsar, Chilliard, Febel, Delavaud and Cavestany2004) in P than in M cows, under confined or grazing conditions, respectively. As several factors affect the endocrine milieu, these contradictory findings could be due to differences in animal management, mainly nutrition.
Most reports on the effect of BCS on productive and reproductive parameters are based on a classification of the cows according to BCS at calving (Gallo et al., Reference Gallo, Carnier, Cassandro, Mantovani, Bailoni, Contiero and Bittante1996; Meikle et al., Reference Meikle, Kulcsar, Chilliard, Febel, Delavaud and Cavestany2004; Patton et al., Reference Patton, Kenny, McNamara, Mee, O'Mara, Diskin and Murphy2007) and/or at the moment of the initiation of the transition period (Shrestha et al., Reference Shrestha, Nakao, Suzuki, Akita and Higaki2005; Chagas et al., Reference Chagas, Rhodes, Blache, Gore, Macdonald and Verkerk2006). We did not find reports on the effect of different nutritionally regulated BCS at the initiation of the transition period in dairy cows; thus, productive and reproductive responses to BCS could be the result of a differential animal capacity to face NEB during this period. For that reason, the objectives of this study were to evaluate the effect of nutritionally regulated differential BCS one month before the expected calving date on milk production, metabolic and endocrine profiles and days to first ovulation in primiparous and multiparous Holstein cows under grazing conditions.
Our hypothesis was that both parity and nutritionally regulated BCS one month before calving affect both productive and reproductive performance, and that this would be associated with a differential endocrine/metabolic environment.
Material and methods
Animal experimentation was approved by the Animal Experimentation Committee of the University of Uruguay.
Animals and experimental design
Holstein cows with two to five parturitions (M cows; n = 32) and cows without previous parturitions (P cows; n = 30; average 305 days corrected milk yield: 6000 and 4800 kg, respectively for herd of Uruguay) with parturitions during autumn (March, April and May), dry period 127 ± 82 days and interval between partum of 419 ± 128 days, were selected from the herd (200 dairy cows) of the experimental dairy farm of the Faculty of Agronomy Sciences (Paysandú, Uruguay).
Only animals that responded to nutritional treatment were considered and this was defined as follows: primiparous and multiparous high cows (PH, n = 13 of 15 and MH, n = 9 of 16) had to gain 0.5 points of BCS, primiparous low (PL, n = 9 of 15) had to lose 0.5 points of BCS and multiparous low had to maintain BCS (ML, n = 8 of 16) at least in two subsequent observations (every 15 days) of BCS from −100 to −30 days. The BCS were assessed according to a scale of 1 to 5 (1 = thin, 5 = fat; Edmonson et al., Reference Edmonson, Lean, Weaver, Farver and Webster1989) and the observations were made by the same observer. The experimental arrangement was a randomized complete block design, where cows were blocked according to BW and expected calving date, and then randomly assigned to different nutritional treatments from –100 to –30 days relative to calving (days) to induce different BCS. As the assignment of cows to treatments was random, cows had to lose, maintain or gain BCS; thus, different planes of nutrition were offered with approximately 7, 14 or 20 kg/DM (estimated chemical composition: 12.7% CP, 56.7% NDF, 24.3% ADF and 1.25 Mcal/kg DM of net energy of lactation (NEL)) of a long-term established pasture with a maximal herbage mass of 1200 kg DM/ha. The animals grazed on different areas to determine the forage offer above. The food in this period was similar for all animals, and differed only in quantity.
From −30 days to calving, P and M cows were managed separately. Cows were offered once a day a diet that included whole-plant maize silage (4.2 and 5.1 kg DM) and commercial concentrate (3.7 and 4.6 kg DM), for P and M cows, respectively, and had ad libitum access to Setaria italica hay. This resulted in an estimated chemical composition of 9.5% CP, 54.2% NDF, 30.8% ADF and 1.33 Mcal/kg DM of NEL, for both groups. From calving to 60 days post partum, cows of different groups grazed in separate plots – a second-year pasture, mixture of Festuca arundinacea, Trifolium repens and Lotus corniculatus – with a forage allowance of 30 kg DM/cow in weekly plots grazed twice daily (0930 to 0230 and 0530 to 0400). Herbage mass available composition for the whole period was on average 25% DM, 14.2% CP, 49.0% NDF and 24.5% ADF. Cows were also supplemented individually with 3.1 kg DM of whole-plant maize silage (31.1% DM, 6.9% CP, 65.0% NDF and 33.0% ADF) and 3.7 kg DM of a commercial concentrate (89% DM, 18.1% CP, 19.2% NDF and 12% ADF) after the morning milking. In addition, cows received 1.3 kg DM of the same commercial concentrate in each milking (morning and evening).
For the first 60 days of lactation, cows were milked twice a day (0500 and 1500), milk production was determined daily and milk samples were obtained weekly from four consecutive milking (milking of morning and evening) and combined for fat, protein and lactose determinations. From 0 to 60 days, BCS was assessed weekly and BW was measured at 30-day intervals. Blood samples were collected once a week pre partum and twice post partum, from the coccygeal vein in heparinized tubes approximately 1 h before the morning milking and at 0700 pre partum. Samples were centrifuged immediately and plasma was stored at −20°C until assayed.
Metabolite and hormone determination
The metabolic profiles were determined in 118 samples from −30 to 30 days post partum and included NEFA, BHB, cholesterol, total protein, albumin and urea. All samples were analyzed in one assay in the Laboratory DILAVE of Uruguay. Blood biochemistry was analyzed according to the following colorimetric methodologies: cholesterol: CHOD-PAP (Wiener Lab 861231904); total protein: Biuret reaction (Wiener Lab 864102502); albumin: Bromocresol green (Wiener Lab 861250000); and urea: Urease UV (Wiener Lab 861237004). For these determinations, commercial kits from Weiner Laboratory (Rosario, Argentina) were used and calibrated with control calibrator serum (Wiener Lab 861244507) on a Vitalab Selectra 2 autoanalyzer (Vital Scientific, Dieren, The Netherlands). For quality controls, Lyotrol N (Ref. 62373) and P (Ref. 62373), and internal controls of the Laboratory DILAVE were used. Concentrations of NEFA were determined by the method ACS-ACOD (kit NEFA-C, Wako Chemicals, Richmond, VA, USA) and BHB by the d-3-hydroxybutyrate kit (Randox Laboratories Ltd, Ardmore, UK). The intra-assay coefficient of variability (CV) were 6.8%, 4.8%, 0.1%, 3.8%, 4.0% and 18% for protein, albumin, urea, cholesterol, NEFA and BHB assays, respectively.
Concentrations of insulin, IGF-I and progesterone (P4) were determined in the Laboratory of Nuclear Techniques, Veterinary Faculty, Montevideo, Uruguay. Insulin concentration was determined from −37 to 30 days post partum by a 125I-Insulin RIA kit (Diagnostic Products Co., Los Angeles, CA, USA). The sensitivity of the assay was 2.2 μIU/ml and the intra-assay CV was 8.2% and 9.4% for low concentration (2.2 μIU/ml) and medium (12.6 μIU/ml) controls, respectively.
Concentrations of IGF-I were determined −37, −30, −21, −15, 0, 15 and 30 days post partum using immunoradiometric assay with a commercial kit (IGF-I-RIACT Cis Bio International, Gif-sur-Yvette, France). The kit contains two monoclonal antibodies against two different antigenic sites of IGF-I molecule, one that is coated on the solid phase, the other radio labeled with 125I. Samples are first treated with an acidic solution to strip the carrier proteins, which are then saturated with IGF-II to avoid the reassociation between IGF-I and the carrier protein. The sensitivity of the assay was 0.7 ng/ml and the intra-assay CV for control 1 (74 ng/ml) and control 2 (535 ng/ml) were 6.9% and 7.2%, respectively.
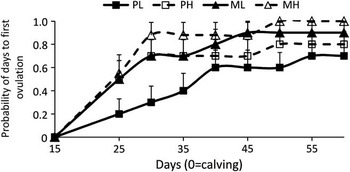
Progesterone was determined three times per week in all plasma samples from calving until 60 days post partum using a commercial kit (Diagnostic Products Co., Los Angeles, CA, USA). The sensitivity of the assay was 0.1 ng/ml and the intra-assay CV for the low (0.5 ng/ml) and medium (2 ng/ml) controls were 15.6% and 8.1%, respectively. A day to first ovulation was defined as the first day after calving in which the concentration of P4 was greater than 1 ng/ml. The probability to first ovulation was estimated by the proportion of cows with first ovulation, in total animals per group, estimated every 5 days from 15 days post partum.
Statistical analyses
Milk production, BCS, metabolite and hormonal concentrations were analyzed with repeated measures using a statistical model that included the effects of parity (P or M cows), BCS at −30 days (low or high BCS) nested in parity, days and their interactions as fixed effects and block random effect (Mixed procedure, SAS Institute Inc., Cary, NC, USA). The covariance structure was autoregressive order 1 and degrees of freedom were adjusted by the Kenward–Rogers method. The probability of cows cycling was analyzed using a generalized linear model with a binomial distribution of the variable (Genmod procedure of SAS). Tukey–Kramer tests were conducted to analyze differences between groups except for probability of cows cycling where likelihood ratio tests were used. The means are considered different when P < 0.05. The data are presented as least squares means ± s.e.m.
Results
BCS and BW
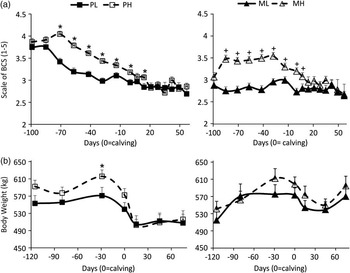
The body condition was affected by days post partum (P < 0.001), body condition pre partum (P < 0.001) and parity (P < 0.001), and there was interaction between BCS and parity (P < 0.001) and days post partum and parity (P < 0.001). P cows had greater BCS than M cows at the initiation (−100 days) of the experiment (3.80 ± 0.74 v. 2.91 ± 0.68; P < 0.001). There were no differences between BCS within parity groups before the nutritional treatments were applied, but they did differ from −85 to −40 days (Figure 1). Whereas in PH cows BCS increased from −100 to −75 days (P = 0.01) and decreased thereafter to 21 days (P < 0.001), PL cows lost BCS from −75 to −30 days (P < 0.001) and from −15 to 15 days (P = 0.01). The BCS of MH cows increased from −100 to −75 days (P = 0.002), remained constant until −30 days and decreased thereafter until 15 days post partum, whereas BCS of ML cows was maintained from −100 days to 60 days post partum, except for the decrease found from −15 to 0 days (P < 0.001). A month before calving, BCS was different between high and low cows within parity: P cows (3.43 ± 0.05 v. 2.98 ± 0.07; P < 0.001) and M cows (3.44 ± 0.07 v. 2.89 ± 0.07; P < 0.001), respectively.
Body condition score (BCS) from −100 to 56 days of calving (a) and body weight (BW) (b; least squares means ± pooled s.e.). PL = primiparous cows (P cows) in low BCS, PH = P cows in high BCS, ML = multiparous cows (M cows) in low BCS, MH = M cows in high BCS. *Indicates the difference between low and high BCS for a given day, for P and for M (+) cows, respectively.

BW was affected by days post partum (P < 0.001) and parity (P < 0.01). BW at calving was 539 ± 15, 572 ± 10, 594 ± 17 and 610 ± 18 kg for PL, PH, ML and MH cows, respectively, with M cows being on average heavier than P cows from −100 to 60 days post partum (Figure 1b). At 75 days post partum, after the end of the experimental period, only the MH group gained weight compared with 45 days (P < 0.05).
Milk production and composition
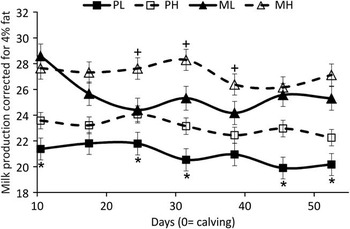
Milk production and accumulated milk production at 60 days post partum were affected by parity (P < 0.001 for both) and were greater for M cows but were not affected by BCS at −30 days within parity. The milk of PH cows had a greater fat percentage than that of PL (3.72±0.05 v. 3.38±0.06; P < 0.01), but no differences were found in M cows. Percentages of fat (P < 0.001), protein (P < 0.001) and lactose (P = 0.03) in milk decreased from week 2 to 8. Fat-corrected milk (FCM) was affected by days post partum (P < 0.001) and parity (P < 0.001), and tended to be affected by BCS (P < 0.10). The P and M cows with high BCS produced 4% FCM than cows with low BCS at several times during the first 60 days post partum (Figure 2).
Milk production corrected for 4% fat (least squares means ± pooled s.e.) during 60 days after calving. PL = primiparous cows (P cows) in low body condition score (BCS), PH = P cows in high BCS, ML = multiparous cows (M cows) in low BCS, MH = M cows in high BCS. *Indicates the difference between low and high BCS for a given day, for P and for M (+) cows, respectively.

Plasma NEFA and BHB concentrations
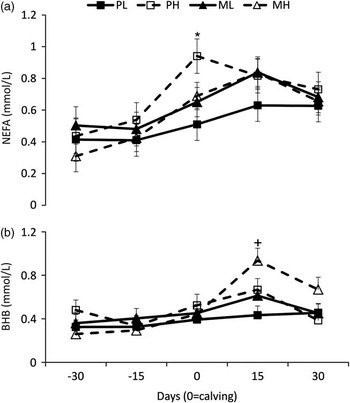
The concentrations of NEFA were affected by the BCS at −30 days within parity (P < 0.01) and days (P < 0.001), but there was no effect of parity. Non-esterified fatty acid concentrations increased at calving (Figure 3a). Concentration of NEFA was higher in PH cows than in PL cows (P = 0.003). The BHB concentration was affected by days (P < 0.01), increasing at 15 days in all groups except PL cows (Figure 3b).
Concentration (least squares means ± pooled s.e.) of non-esterified fatty acids (a) and β-hydroxybutyrate (b) in plasma. PL = primiparous cows (P cows) in low body condition score (BCS), PH = P cows in high BCS, ML = multiparous cows (M cows) in low BCS, MH = M cows in high BCS. *Indicates the difference between low and high BCS for a given day, for P and for M (+) cows, respectively.

Plasma total protein, albumin, urea and cholesterol
The total protein concentration of plasma was affected by parity (P < 0.05) and days (P < 0.001). The protein concentration decreased from −30 days to calving in the PL, PH and ML groups (P = 0.001, P = 0.02 and P < 0.001, respectively) and remained constant in MH groups (P = 0.16). The concentration increased from calving to 15 days post partum in PH (P = 0.08), ML (P = 0.002) and MH cows (P = 0.0006; Figure 4a). M cows had greater protein concentrations than P cows (P = 0.01). The albumin concentrations tended to be affected by the BCS at −30 days within parity (P < 0.10) and days (P < 0.01; Figure 4b), with minimum levels found at calving and greater concentrations in PL than in PH cows (P < 0.05). Urea concentrations were affected by BCS at −30 days within parity groups (P < 0.05) and days (P < 0.01). The ML cows had a greater urea concentration than MH cows, P = 0.007 (Figure 4d). In PH cows, the concentration of urea remained constant in the period −30 to 30 days post partum, whereas in PL cows the concentration decreased from −30 days calving (P = 0.0016). In ML cows, urea concentrations decreased sharply at −15 days (P = 0.012), whereas in MH cows it remained constant until calving. Urea concentrations tended to increase at 15 days in MH (P = 0.09) and ML (P = 0.06) cows. The cholesterol concentrations were affected by days (P < 0.001) and there was an interaction between parity and days (P < 0.01), as concentrations decreased at calving and increased again at 15 days; M cows had greater concentrations than P cows at 30 days (Figure 4c).
Concentration (least squares means ± pooled s.e.) of protein (a), albumin (b), cholesterol (c) and urea (d) in plasma. PL = primiparous cows (P cows) in low body condition score (BCS), PH = P cows in high BCS, ML = multiparous cows (M cows) in low BCS, MH = M cows in high BCS. *Indicates the difference between low and high BCS for a given day, for P and for M (+) cows, respectively.

Insulin
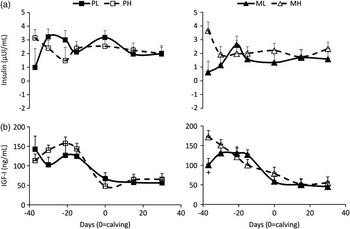
The body condition tended to affect the concentration of insulin (P = 0.14). In PL and ML cows, insulin concentrations were already reduced at −37 days (end of the nutritional treatment) and increased during the pre-partum period, whereas the opposite was found in PH and MH cows. The PH and MH cows maintained insulin concentrations during the post-partum period, whereas concentrations of insulin tended to decrease at calving in ML (P = 0.11) and 15 days in PL cows (P = 0.07), respectively (Figure 5a). When only post-partum data were considered, P cows had greater insulin concentration than M cows (P < 0.05).
Concentration (least squares means ± pooled s.e.) of insulin (a) and insulin-like growth factor I (b) in plasma. PL = primiparous cows (P cows) in low body condition score (BCS), PH = P cows in high BCS, ML = multiparous cows (M cows) in low BCS, MH = M cows in high BCS. (+) Indicates the difference between low and high BCS for a given day for P cows.

IGF-I
The concentration of IGF-I was affected by days (P < 0.001), and a tendency for an interaction between days and BCS was observed (P = 0.07). MH cows presented greater IGF-I concentrations than ML cows at −37 days post partum (dpp; P < 0.01). In PL cows, IGF-I concentrations were observed at calving (P = 0.0005), whereas in PH cows the decrease was already observed at −21 dpp (P = 0.04; Figure 5b). In the ML cows, IGF-I concentrations increased from days −37 to −30 (P < 0.05) and decreased at calving (P < 0.001), whereas in MH cows IGF-I concentrations decreased already at −21 dpp (P < 0.05).
First post-partum ovulation
The time between calving and first ovulation tended to be affected by parity (P = 0.06), and was 16 days longer for P cows than for M cows (47.1 days for P cows and 31.4 days for M cows). The days to first ovulation occurred at 40.6 ± 2 and 55.2 ± 2 days for PH and PL and 22.1 ± 2 and 39.1 ± 2 for MH and ML cows, respectively. The probability of cows cycling was affected or tended to be affected by BCS within parity at 50 dpp (P = 0.05) and 30 dpp (P = 0.06; Figure 6), presenting a lower probability of cycling in PL than in PH cows (P < 0.05) and in ML than in MH cows (P < 0.05).
Probability of days to first ovulation (P ± confidence interval). PL = primiparous cows (P cows) in low body condition score (BCS), PH = P cows in high BCS, ML = multiparous cows (M cows) in low BCS, MH = M cows in high BCS.

Discussion
Differences in BCS induced by the treatment (high v. low BCS) were maintained during the pre-partum period and at calving, but no differences were found 21 days after calving. Similarly, cows under different pre-partum nutritional treatments (ad libitum v. restrictive intakes) reached the same nadir of BCS between 4 and 6 weeks post partum (Douglas et al., Reference Douglas, Overton, Bateman, Dann and Drackley2006).
The 0.5-point difference in BCS at −30 days affected FCM yield during the first 40 to 60 days of lactation in M or P cows, respectively. Pedron et al. (Reference Pedron, Cheli, Senatore, Baroli and Rizzi1993) and Agenas et al. (Reference Agenas, Burstedt and Holtenius2003) did not find any effect of BCS at calving on milk yield in confined systems. However, Stockdale (Reference Stockdale2008), using fat and thin animals at calving (4.36 and 3.87 points of BCS in a 1 to 8 scale), produced 33.7 v. 31.6 kg/day, respectively, in the first 92 days of lactation. It was established that the BCS has a nonlinear effect on milk production, which determines that at certain ranges of BCS milk yield would increase and at others it may decrease (Roche et al., Reference Roche, Friggens, Kay, Fisher, Stafford and Berry2009). The greater milk and fat yields with BCS up to 3.5 are probably a result of a greater availability of energy for the cow, thereby sparing glucose production for lactose synthesis (Roche et al., Reference Roche, Friggens, Kay, Fisher, Stafford and Berry2009).
Milk production curves did not present a peak in milk yield, which has already been observed in other studies conducted with cows calving in autumn (Meikle et al., Reference Meikle, Kulcsar, Chilliard, Febel, Delavaud and Cavestany2004; Cavestany et al., Reference Cavestany, Blanc, Kulcsar, Uriarte, Chilibroste, Meikle, Febel, Ferraris and Krall2005). One possible reason for these results could be that cows present the lactation peak in winter, when pasture quality is lower, an aspect that should be taken into account when comparison with well-fed cows is performed.
Concentrations of NEFA reflected the mobilization of reserves and were greater in PH cows, which were consistent with the greater losses of BCS, as well as the increased milk fat percentage in early lactation in this group. The lower NEFA concentrations in PL cows may be the result of the smaller body reserves that could be mobilized for milk production. Moreover, BHB in this group did not increase during the post-partum period. Although no differences were observed according to treatment in NEFA concentrations in M cows, BCS nadir was reached later during the post-partum period for MH than for ML cows. This was associated with the greater FCM yields found from approximately 3 to 5 weeks post partum in the former group. Indeed, dairy cows can mobilize fat reserves up to 12 weeks post partum (Komaragiri and Erdman, Reference Komaragiri and Erdman1997); this was reflected in this study by the concentrations of preformed fatty acids (C > 16) in milk fat, which were greater in MH cows than in ML cows (Artegoitia V et al., 2011, unpublished data).
Total plasma protein nadir found at calving reflected the mobilization of proteins toward the mammary gland principally for the immunoglobulin secretion in colostrum. The decrease in albumin, urea and cholesterol concentrations at calving may reflect the decreased intake in the peri partum period, as has been reported earlier (Cavestany et al., Reference Cavestany, Blanc, Kulcsar, Uriarte, Chilibroste, Meikle, Febel, Ferraris and Krall2005; Seifi et al., Reference Seifi, Gorji-Dooz, Mohri, Dalir-Naghadeh and Farzaneh2007). Total plasma protein concentrations were greater in MH cows, suggesting the better energy/nitrogen balance. This idea is reinforced by the greater urea concentrations found in ML cows, which peaked at 2 weeks post partum, possibly suggesting an increase in protein mobilization to maintain milk production. According to Komaragiri et al. (Reference Komaragiri, Casper and Erdman1998), the capacity for protein mobilization is limited and occurs mainly during the first 5 weeks post partum (Komaragiri and Erdman, Reference Komaragiri and Erdman1997). Interestingly, the FCM production decreased sharply in ML cows during the first 4 weeks, whereas MH cows maintained FCM production in the experimental period, which may be attributed to the greater available body reserves to maintain milk production.
Insulin profiles around calving differed between high and low BCS groups: whereas insulin concentrations were already decreasing one month before calving in high BCS cows, an increase was observed in low BCS cows, which could be the result of a better nutrient allowance during the close-up dry period (the nutritional treatment finished at −30 dpp). A decrease in insulin at calving was observed in all groups, which is a metabolic adaptation to cope with the energy demands of lactation, as reported earlier (Taylor et al., Reference Taylor, Beever, Bryant and Wathes2003; Wathes et al., Reference Wathes, Cheng, Bourne, Taylor, Coffey and Brotherstone2007), as low insulin levels favor gluconeogenesis and lipolysis (Herdt, Reference Herdt2000; e.g. homeorhetical effect). Wathes et al. (Reference Wathes, Cheng, Bourne, Taylor, Coffey and Brotherstone2007) reported that insulin concentrations are lower in adult animals, which is consistent with post-partum data of the present study. These reduced insulin concentrations in M cows may also explain the better capacity for protein/fat reserve mobilization for milk synthesis.
In the present experiment, no differences were found in IGF-I concentrations between P and M cows, which is in contrast with Wathes et al. (Reference Wathes, Cheng, Bourne, Taylor, Coffey and Brotherstone2007) who reported that both insulin and IGF-I concentrations were greater in young animals associated with their role in growth. Pre-partum IGF-I concentrations tended to be greater in MH cows than in ML cows, which was consistent with the better BCS of these animals. Concentrations of IGF-I decreased at calving, as reported previously (Lucy et al., Reference Lucy, Jiang and Kobayashi2001; Taylor et al., Reference Taylor, Beever, Bryant and Wathes2003; Meikle et al., Reference Meikle, Kulcsar, Chilliard, Febel, Delavaud and Cavestany2004). It is interesting to note that IGF-I profiles reflected more likely the changes in BCS, in contrast with insulin profiles, which were associated more with the day-to-day effects of the nutritional input as observed in the pre-partum increases in low BCS cows. In addition, cholesterol is positively associated with concentrations of glucose, insulin and IGF-I (Francisco et al., Reference Francisco, Spicer and Payton2003), and in our study cholesterol increased with days post partum and was greater in MH cows.
The probability of cows cycling was affected by BCS at −30 days and parity, showing that cows in lower BCS and P cows had longer anestrus, which was consistent with other reports (Spicer et al., Reference Spicer, Tucker and Adams1990; Meikle et al., Reference Meikle, Kulcsar, Chilliard, Febel, Delavaud and Cavestany2004; Sakaguchi et al., Reference Sakaguchi, Sasamoto, Suzuki, Takahashi and Yamada2004; Burke and Roche, Reference Burke and Roche2007; Tanaka et al., Reference Tanaka, Arai, Ohtani, Uemura, Kuroiwa, Kim and Kamomae2008). A possible explanation of the delayed reinitiating of ovarian cyclicity in P cows may be their extra requirements for growth. A decrease in BCS of ⩾1 unit at 7 weeks after calving increased the occurrence of delayed first ovulation (Shrestha et al., Reference Shrestha, Nakao, Suzuki, Akita and Higaki2005). Kawashima et al. (Reference Kawashima, Sakaguchi, Susuki, Sasamoto, Takahashi, Matsui and Miyamoto2007) demonstrated that IGF-I concentrations were a key determinant of time of ovulation. However, in this study, post-partum IGF-I concentrations did not explain the differences found in the probability of cows resuming cyclicity. Chagas et al. (Reference Chagas, Rhodes, Blache, Gore, Macdonald and Verkerk2006) reported that pre-partum IGF-I concentrations were greater in high BCS cows that had unrestricted allowance v. restricted cows; however, even if post-partum IGF-I concentrations were similar, most of high BCS cows had ovulated by 77 days, whereas only 8% of low BCS cows did so.
In summary, the nutritionally regulated BCS at −30 days had positive effects on FCM production and on days to first ovulation, and it was associated with a better pre-partum endocrine milieu. M cows had better productive result, produced more milk and started cyclicity before P cows.
Acknowledgments
The authors thank Dr. M. Crowe for constructive criticism of this manuscript. The present study received financial support from INIA Project No. 214, Uruguay.