Litter standing crop (LSC) is the quantity of plant detritus on the floor in forested environments. Knowledge of LSC is important in understanding many ecological phenomena. These include studies of litterfall, decomposition/litter turnover rates and nutrient cycling (Anderson et al. Reference ANDERSON, PROCTOR and VALLACK1983, Dent et al. Reference DENT, BAGCHI, ROBINSON, MAJALAP-LEE and BURSLEM2006), general plant performance (Benítez-Malvido & Kossmann-Ferraz Reference BENÍTEZ-MALVIDO and KOSSMANN-FERRAZ1999), other ecosystem processes such as the effects of fire (Odiwe & Muoghalu Reference ODIWE and MUOGHALU2003) and fauna (Frith & Frith Reference FRITH and FRITH1990, Giaretta et al. Reference GIARETTA, FACURE, SAWAYA and CHEMIN1999, Levings & Windsor Reference LEVINGS and WINDSOR1985). The determination of accurate annual average LSC data, may require monitoring over long periods due to seasonality and sometimes sporadic nature of litterfall and decomposition rates (Clark et al. Reference CLARK, BROWN, KICKLIGHTER, CHAMBERS, THOMLINSON and NI2001). Furthermore, the effects of topography and water movement create the need for both representative site selection and sufficient spatial coverage.
Standard methods for LSC quantification typically either involved removing quadrats from the site and determining dry weight (Anderson et al. Reference ANDERSON, PROCTOR and VALLACK1983, Goma-Tchimbakala & Bernhard-Reversat Reference GOMA-TCHIMBAKALA and BERNHARD-REVERSAT2006, Spain Reference SPAIN1984). Less common approaches include measuring litter depth, or weighing LSC on site and removing subsamples that are dried in the laboratory and the moisture component subtracted (Day Reference DAY1979, Nascimento & Laurance Reference NASCIMENTO and LAURANCE2002). Generally 0.25–1-m2 quadrats (Edwards Reference EDWARDS1977, Nascimento & Laurance Reference NASCIMENTO and LAURANCE2002, Proctor et al. Reference PROCTOR, ANDERSON, FOGDEN and VALLACK1983, Scott et al. Reference SCOTT, PROCTOR and THOMPSON1992, Songwe et al. Reference SONGWE, OKALI and FASEHUN1995, Spain Reference SPAIN1984), or sometimes larger (Tanner Reference TANNER1981) are sampled, with intensities varying widely from two to four times per year to monthly collections. Replication is dependent on logistics and the goals of the study, but adequacy of sampling is usually unknown. The approach of taking samples from the site to determine dry weights has drawbacks in regard to the time and effort required for accurate analyses, particularly when numerous sites are being studied. Removing litter from the site also creates disturbance with possible carry-on effects to other processes that may be of interest. Significant effort can be necessary for drying and weighing following the fieldwork. The method of subsampling to determine moisture content can also be problematic, as many samples may be needed to accurately cover the range of moisture within the litter layer temporally and spatially. Most importantly, logistical demands inherent in these commonly used methods limit the capacity of researchers to sample spatial and temporal variability in the litter layer, which can be particularly high at most scales of interest and change seasonally (Proctor et al. Reference PROCTOR, ANDERSON, FOGDEN and VALLACK1983).
We have developed a new method for the determination of LSC using measurements of volume, calibrated with dry-weight data. The method is logistically less demanding thereby permitting greater replication and spatial coverage of LSC in the field. An added bonus is that removal of LSC from the site is not required. This method is designed for applications where total LSC is required only and a detailed breakdown of the various components of litter (e.g. leaves, stems, flowers, fruit) is not of interest. The method is being utilized as part of a multidisciplinary research project examining the determinants of biodiversity patterns and how they may be affected by climate change. These include studies of decomposition and nutrient cycling, plant productivity and many aspects of animal ecology. Our study area covers most of the Australian Wet Tropics World Heritage Area between just north of Townsville, and south of Cooktown, north Queensland, Australia. We have sites from ~100–1600 m asl in closed tropical rain forest of varying complexity. The method and benefits are outlined below through comparison with the dry-weight approach.
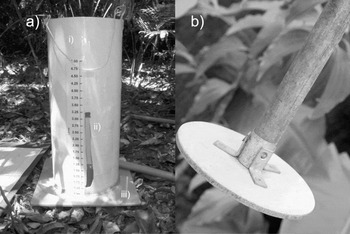
The basis of the volumetric method works in much the same way as the commonly used LSC measurement techniques for fine litter (Gong & Ong Reference GONG, ONG, Sutton, Whitmore and Chadwick1983, Proctor et al. Reference PROCTOR, ANDERSON, FOGDEN and VALLACK1983). We use randomly chosen sampling points to collect fine litter (excluding heavily fragmented portions considered as part of the mineral soil portion and woody material > 2 cm diameter) from within 0.25-m2 quadrats. The material is placed into a specially designed measuring cylinder (Figure 1a) (‘compression cylinder’). Any included woody material is broken into portions small enough to fit horizontal in the apparatus to reduce obstructions. The material is then compressed flat using a compression stick and the volume recorded directly from a scale bar. The compression cylinder consists of ~400 mm of 150-mm-diameter PVC tubing. Two vertical guide holes are cut into the tubing for viewing the volume of litter during measurements, on one side from just below the top to approximately half way down the tubing, and, on the opposite side, from the bottom to approximately half way up the tubing (Figure 1a). This enables the volume (up to ~ 3.5 L at once) to be read while still maintaining the structural integrity of the compression cylinder during litter compaction. An additional square piece of PVC (~ 5 mm thickness) is plastic welded to the bottom of the tubing to provide a stable base (Figure 1a). Volumetric scales, in litres, for this diameter of tubing are laminated to the sides adjacent to the vertical guide holes. The compression stick consists of 900 mm of wood dowel with a 140-mm-diameter flat PVC disc attached via steel brackets (Figure 1b). The collected litter is compressed into the cylinder with at least three firm downward thrusts. The operator then leans down on the litter with the compression stick, and with a firm compressive force (their own body weight) on the litter, records the volume. For most adult operators this level of force is enough to consistently compress litter. The material can then be emptied out in the original location on the forest floor, either spread out or left in a pile in order to recognize areas that have already been sampled.
Volumetric device used to measure volume of fine-litter standing crop consisting of: compression cylinder (a) and compression stick (b). Cylinder consists of 150-mm PVC tubing (i), plastic-welded base (iii); guide hole to view volume in litres (ii).

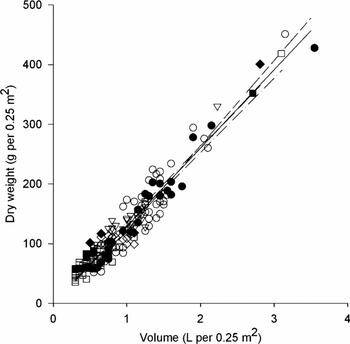
Our compression cylinder was designed to be used with 0.25-m2 quadrats, based on the range of litter collected in our study area from dry weighed LSCs between March 2007–January 2008. A portion of these collections of dry weights were also used to develop calibrations between dry weight and volume (Figure 2, n = 190). This enables comparisons of LSC between other studies, and the determination of other factors where dry weight is of interest, such as litter turnover rates (annual litterfall/sum of the annual LSC). Calibration equations of volume verses mass were calculated using both linear and non-linear regressions. We examined spatial and temporal subsets of the data set to test the generality of the LSC calibrations. Spatial subsets were sub-regions (Windsor Uplands (WU) and Spec Uplands (SU): seasonally dry rain forest and wet sclerophyll rain forest; Carbine Uplands (CU): complex rain forest, and Atherton Uplands (AU): complex rain forest with many sites influenced by a recent severe cyclone) and temporal subsets/seasons (wet: collected February; dry: September 2008).
Litter standing crop data showing calibration from linear regressions between litter standing crop volume and dry weight (n = 190) taken from sites in Australian tropical rain forest. Included are samples from different sub-regions and collection seasons: Atherton uplands – - - (r2 = 0.90), ○ (Wet, n = 50), ● (Dry, n = 17); Carbine uplands – (r2 = 0.94), □ (Wet, n = 51), ■ (Dry, n = 20); Windsor uplands ·· – ·· (r2 = 0.81), ▽ (Wet, n = 20); Spec Uplands – – – (r2 = 0.87), ♢ (Wet, n = 22), ♦ (Dry, n = 10); Seasonal lines not shown: wet r2 = 0.91, dry r2 = 0.94; combined regression —- (r2 = 0.92).

There was a strong linear relationship between litter volume and dry weight for the combined data (Dry Weight = –1.87 + (131 × Volume), r2 = 0.92) (Figure 2). The relationship was not improved by the application of more complex non-linear functions (i.e. quadratic function: r2 = 0.92). There was no evidence to suggest that either the slope or intercept for calibrations differed temporally (ANCOVA, F1, 187 = 0.74, P = 0.85), or spatially (ANCOVA, F3, 185 = 2.08, P = 0.11), across the range of litter volumes encountered in rain forest within our region between June 2007 and May 2009 (mean = 1.17 L; median = 1.05 L; range = 0.10–5 L; n = 4950). This was the case even allowing for the fact that a number of AU plots were affected by cyclone damage. The AU plot may have had comparably higher proportions of woody material, but the affect on the calibrations was minor. Considering this we accept that the linear functions, and combined linear regression is applicable to all of our sites within this common range of values. The lower r2 for SU and WU were likely to have been influenced by their comparably small sample sizes.
The amount of effort required to adequately measure LSC can be considerable and can limit the coverage of estimates and representativeness of sampling designs. In the case of our own study, removing samples to determine dry weight back in our laboratory required travelling large distances, which is likely to be the case in many ecological research settings. For example, on one occasion where 15 of our sites were sampled, removing just ten 0.25-m2 quadrats of wet litter (n = 150) meant that > 20 kg dry weight (~ 150 L) of material needed to be transported. Both the dry weight and volume method require the same amount of time to collect a single sample, ~ 30 s. However, the dry weight method adds additional effort of ~20 s per sample for drying (not including actual drying time) and requires a great deal of space to complete the processing. An additional ~30 s per sample was then necessary for weighing. The volume method, once calibrated, equates to a significant saving in time and effort per unit area measured, e.g. from our data a minimum of ~5.3 min m−2 using dry weight was reduced to ~2.0 min m−2 (38 %) by adopting the volume method. Thus, with the volumetric method we can easily increase sample sizes to improve spatial coverage without significantly increasing effort.
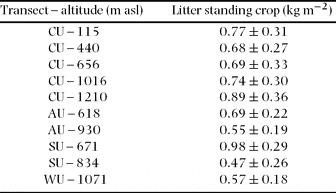
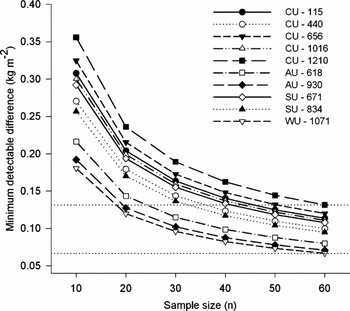
In designing our study it is important to understand the number of samples necessary to get statistical power from the data. We require comparisons of LSC between sites distributed along elevational transects within the four sub-regions. Each site contains six points distributed 200 m apart. An acceptable maximum sampling scheme in regards to time spent at each site was considered to be 10 LSC volumes per point (n = 60 per site). We use post hoc power analyses to demonstrate the analytical benefit of increased litter sampling facilitated by our volume method (S + for Windows, EnvironmentalsStats module, TIBCO Software Inc. CA). The goal of the power analysis is to determine the range of minimum detectable differences (MDD) (effect size) for comparisons with ANOVA (α = 0.05, for 80% power), between sites (e.g. regional/site differences). Table 1 shows the mean LSC estimates for entire transects (mean of six points) used in this analysis, sampled on one occasion per site in 2007/2008. Only data sets with homogenic variances were used in the analysis. The generally high variability is a characteristic of LSC, particularly at sites situated on steep slopes in upland situations. The range of MDD for comparisons between entire transects (n = 60) was 0.07–0.13 kg m−2 (Figure 3), with significant escalation of MDD with < 30 samples. This range appears generally acceptable for statistical comparisons considering the range of means, 0.47–0.98 kg m−2. Sites with low MDD generally came from areas with more moderate slopes. For instance, WU – 1071 is relatively flat compared to CU – 1210 which has a highly variable but generally steep topography within the six sampling points.
Litter standing crop (mean ± SD) used in power analysis for minimum detectable difference sampled in Australian tropical rain forest using the litter volume method and calibration. Elevational transects come from three regions: CU – Carbine Uplands; AU – Atherton Uplands; SU – Spec Uplands; WU – Windsor Uplands. CU and AU sampled in October 2007; SU June 2008; WU March 2008. N = 60 per transect, sampled along six points (10 samples per point).

Minimum detectable difference (effect size) calculated via power analysis (α = 5% for 80% power) of mean litter standing crop sampled along transects (six points per transect, 10 samples per point) in Australian tropical rain forest. Horizontal dotted lines represent the range of effect size for these sets of samples.

Sampling LSC depends greatly on the site or area being covered, and the goals of the study. In our regional-scale study, dry weight measurements not deemed feasible due to large sample numbers. The volumetric approach fulfils our needs for a quick and easily replicable method to cover a large area with total fine LSC. In our study it is possible with the volumetric approach, using the same time/effort, to increase sample sizes from ~ 37 dry weights to ~ 60 volumes at the site level. On average, with the data shown above, this allows for improvements in MDD of 23%. We recommend our method mostly where total fine-litter data is required over many sampling periods (e.g. to view seasonal changes in LSC), and where numerous sites and long-term monitoring may be important (e.g. > 12 mo). The lack of litter removal from the site also lessens the impacts of our activities on the ecosystem and importantly on the processes being studied. Detecting changes in ecosystem processes, such as those related to LSC, is of significant importance in monitoring forest processes, particular in light of current climate change.
ACKNOWLEDGEMENTS
This work was supported by the James Cook University Research Advancement Program, Skyrail Rainforest Foundation, the Rainforest-CRC, the Marine and Tropical Science Research Facility and the Queensland Government Smart State programme for funding that supports the Centre for Tropical Biodiversity and Climate Change. We thank the Earthwatch Institute and volunteers for their help with data collection, Queensland National Parks and Wildlife Service for access to the sites, Ivan Lawler, Robert Congdon and two anonymous reviewers for comments on the manuscript, and Rob Gegg for essential aid in making the compression cylinder.