


1. Introduction
One of the most useful concepts for the study of glaciers is that of mass continuity. The concept can be used to calculate the steady-state balance velocities of glaciers for which field measurements of velocity are not available and, for glaciers whose velocity has been measured, the theory can be used to test for steady-state and to calculate the rate of thickness change. However, there are difficulties in the use of the equation, particularly because ice velocity at depth is normally expected to be different from that near the surface.
The theory will be developed from first principles and then applied using data from the “Byrd” station strain network (BSSN), Antarctica. The balance velocity, which is calculated largely from surface mass-balance information (net accumulation of snow), will be compared with measured velocities as a test of the balance velocity, and then used for calculating rates of ice thickness change.
The variations of balance velocity and of measured velocity along the BSSN will then be compared with one another in order to test the assumption of simple ice flow that is used in the application of the theory.
2. Theory
The basic theory is described by Reference ShumskiyShumskiy (1965) and Reference ShumskiyShumskiy and Bauer (1965), who integrated the equation of continuity through the ice thickness. This method is followed here, and an equivalent but simpler expression is obtained. This expression is then integrated again, but with respect to horizontal distance from an ice divide, and a balance velocity is defined that can be compared to measured velocities to calculate rates of ice thickness change.
The equation of continuity states that the time-rate of mass change of a volume element is balanced by a net mass movement into or out of the element. Letting the symbol ρ denote the mass of an element of unit dimensions (density), t time, and u the ice velocity vector, the equation of continuity is written:

where ∇.ρu is the mass flux divergence for all three orthogonal directions. This is a basic relationship that is true for glaciers in which ρu describes the true mass flow. (Effects such as water flow through the glacier are not considered.)
The behavior of the whole thickness of the glacier is the concern here, and advantage can be taken of known boundary conditions at the upper and lower surfaces of the glacier by integrating Equation (1) through the ice thickness.
Taking the differentiations outside the integrations, Equation (1), integrated through the ice thickness, is:

where ∇ is the divergence operator for just the two directions, x and y, that are perpendicular to the z-direction. Italic subscripts denote vector components and Roman subscripts t (for top) and b (for bottom) indicate the position where the value is to be taken.
Many terms in Equation (2) can be made to cancel or simplify when the vertical velocities at the upper and lower boundaries (u z)t and (u z)b are considered. The vertical velocity at each surface is the combined effect of the mass balance at the surface, any net change in surface elevation, and the z-component of ice movement as constrained by the slope of the surface (Fig. 1). That is:

where  and
 are the mass balances of the top and bottom surfaces, respectively (measured in the z-direction). The signs of the mass-balance terms are different for the two boundaries because positive mass addition is upward at the bottom and downward at the top surface.
Relationship of terms in the upper boundary condition for the case of zero net change of surface elevation, and two-dimensional flow.

Substituting these boundary conditions into Equation (2), the thickness-integrated equation of continuity becomes:

It has not been necessary to define the origin of the coordinate system carefully, except that it should be suitably fixed for the velocities to have meaning. Considerations of the adjustment of the Earth’s crust, or of the ocean water in the case of an ice shelf, to a changing ice load do not affect the relation. The coordinate system could be fixed with respect to the geoid, to an isostatically adjusting substrate, or to a mean upper surface of the ice mass.
Equation (3) could have been obtained directly by considering the mass flow into or out of a column taken through the ice (Fig. 2). The change in mass of the column,

is the difference between the sum of the mass balances at the two surfaces ( +
 ), and the horizontal divergence of total mass transport. This relationship has, however, not always been correctly stated, (for example by Reference WhillansWhillans, 1973), and it is valuable to have developed Equation (3) from the basic equation of continuity (Equation (1)).
Schematic illustrating the terms in Equation (3). For simplicity, uy = 0, in the figure. The figure in heavy lines represents a column through the ice thickness.

The integrated continuity equation (Equation (3)) is further simplified by defining a density-weighted mean ice velocity. First, however, the mean density ρ is defined by:

where Z = z t represents ice thickness. The density-weighted mean ice velocity, ? is then

and Equation (3) becomes:

This equation is exact, and variations of it have been used by other workers. Reference MellorMellor (1968) and Reference ThomasThomas (1976) assumed that the horizontal velocity is constant with depth and that there are no horizontal variations in mean density. They calculated thickness change rates for parts of Greenland and western Antarctica, respectively. Budd (1970[b]) and Reference Budd and RadokBudd and Radok (1971) supposed that the divergence of mean velocity was related to the divergence of top-surface velocity by a multiplication factor obtained from the horizontal velocity profile, and so calculated thickness change rates for the Law Dome, Antarctica. This approach is very similar to that taken here. Reference HughesHughes (1973) and Reference WhillansWhillans (1973) used expressions similar to Equations (5) and (6) below.
The balance velocity is obtained by integrating Equation (4) with respect to the x-direction from an ice divide. An ice divide is a site where
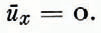
The x-direction will later be constrained to follow, or nearly follow, the mean ice-flow direction. Integrating Equation (4):

in which χd is the value of x at the divide and the balance velocity qx is defined by

The next section shows how separate determinations of qx
and ?x
can be made. The difference between the two is a measure of the total up-glacier rate of change of mass due to non-steady-state behavior. For steady-state, 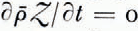 , and the balance velocity is, by Equation (5), equal to the x-component of the mean ice velocity, ?x.
In the case of steady-state, if the x-axis is a flow-line direction, and if w is the mean (over depth) spacing between two flow lines; then,

This, essentially, is the formula used by Reference Budd and RadokBudd and others (1971) to estimate ice-sheet velocities using data on the shape of the ice sheet and surface mass balances.
If the ice mass is also two-dimensional (zero velocity components in the y-direction), Equation (7) can be written more simply in the form often used in theoretical analyses (for example, Reference Bentley and CraryBentley, 1971; Reference NyeNye, 1959; Reference WeertmanWeertman, 1976):

The term “balance velocity” for qx needs explanation. The name is appropriate because the velocity is calculated from mass balance integrated up-glacier with allowance made for flow-line convergence and divergence. The balance velocity is, however, not necessarily the velocity needed for the glacier to attain steady-state. Non-steady-state could, for example, be due to a change in climate, affecting ? t, or to a change in the dynamic interaction within the ice mass or between the ice mass and the substrate that alters the velocities and flow lines. Both surface mass balance and velocity or flow-line spacing enter into the calculation of the balance velocity. Thus, although the difference between the balance velocity qx and the actual mean velocity ?x is a measure of the up-glacier thickness change, the difference does not immediately suggest the cause of any thickness change.
A quantity qy has not been defined because it is not needed and because it cannot be calculated with available data from the BSSN. The subscript in qx is retained to emphasize that qx is a component in the x-direction.
3. Application
The continuity relationship developed above calls for quantities averaged through the ice thickness, but generally, except at a very few sites, only surface values are available. The mean density can be calculated or obtained from ice cores and this mean probably does not vary by important amounts over distances of the order of 100 km for a thick ice sheet. The most critical need is the depth variation of velocity.
Because of the uncertainty in the mean velocity, the x-integrated form of the continuity relationship (Equations (5) and (6)) is used here. If the x-direction approximates the flow line, this relationship separates the problem associated with the vertical variation of the x-component of velocity that is due to basal drag at the substrate, from the problem of changing flow-line direction with depth. As will be shown below for the BSSN, the problem of flow-line direction change at depth is not critical to the analysis, but the problem of the depth variation of the x-component of horizontal velocity is very important, and the use of the x-integrated relationship has the advantage of deferring that problem to the interpretation stage.
Before discussing the depth variation of velocity, Equation (6) can be made more simple by assuming that the mean density is constant in the study area. Density increases very rapidly with depth in the upper 200 m and varies by less than 5% in the remaining thickness (Reference GowGow, 1970). Although variations in thickness and deep temperatures along the BSSN will influence it, changes in the density profile of the upper 200 m are expected to have the largest effect on the mean density. The density profile near the surface (in the firn) is determined largely by surface temperature and mass balance (Gow, [1975]), and neither of these vary in an important way along the BSSN, except perhaps near the ice crest. The mean density can therefore be taken as independent of position and Equation (6) simplifies to:

When considered on a broad scale, the velocity vectors for ice in a vertical column through the ice sheet must all lie in a single plane. This is because the flow of the ice at all depths is due to the component of gravity directed down the mean surface slope. Variations in the substrate cause perturbations to this average flow, but the perturbations are in all directions and should not cause any systematic mean deviation in flow-line direction with depth. Local variations on a scale of less than about ten times the ice thickness are not considered here, and the resulting calculations will show the effects of these local variations. The constraint that horizontal flow is in the same direction at each depth is expressed by:

in which φ is a function of depth and of horizontal position and describes the shape of the horizontal velocity profile.
The shape φ of the average profile of horizontal velocity is determined by the mean surface slope, ice thickness, the temperature profile, and the crystallographic fabric of the ice mass. All of these factors vary with distance from the ice divide but are not expected to vary significantly at the appropriate scale in the perpendicular, or y direction. The function φ can thus be taken to be independent of y, and, using this concept, the transverse strain-rate at the top surface is

and Equation (8) becomes

The shape factor φ for the velocity profile can be calculated using a flow law for ice. The relationship between stress and strain-rate at the shear stresses (≤0.4 bar) appropriate to the BSSN is, however, not well established. The dominant shear stress τxz is given by the familiar formula (Reference PatersonPaterson, 1969, p. 90):

where d is the depth and α the surface slope. Figure 3 shows the relative velocity profile from the “Byrd” station bore hole as obtained by Garfield and Ueda (1975, 1976). The measured strain-rate between 800 and 1 500 m depth, where the ice temperature is lower than —22°C, is only about six times smaller than that found by Reference Mellor and TestaMellor and Testa (1969) on laboratory samples at the same deviator stress but at the very much higher temperature of — 2°C. Studies on the temperature dependence of the flow law predict that the strain-rates at these two temperatures should differ by much more, depending on the study (see review of Reference GlenGlen, 1975). The discrepancy is also very great (two orders of magnitude) between these hole-tilting results and the extrapolation to low stresses of the laboratory-determined flow law of Reference Barnes, Barnes, Tabor and WalkerBarnes and others (1971). That relation was found capable of describing ice-shelf spreading at somewhat higher stresses (Reference ThomasThomas, 1973).
Relative ice velocity profile at “Byrd” station from Garfield and Ueda (1975). The dotted line is the maximum relative velocity and the solid line is the relative velocity component in the direction S. 40° W. The dashed line is the interpolation to the total relative velocity at the bottom. Ice depths are adjusted to the mean ice density of 911.7 kg m−3 (personal communication from A. J. Gow in 1976). Relative velocity measurements were not possible below the density-adjusted depth of 1 482 m because the bore hole became blocked.

The available flow laws are thus unable to describe the measured hole tilting. The explanation may be in the strongly oriented crystallographic fabric in the ice sheet deeper than about 400 m (Reference Gow and WilliamsonGow and Williamson, 1976). The fabric is conducive to shear on horizontal planes, but there is no published quantitative theory describing the effect of the crystallographic fabric on the flow law.
It is therefore necessary to obtain the shape factor φ empirically. The surface velocity at the “Byrd” station end of the BSSN has been calculated by assuming that the ice crest (km 0) is stationary. The velocity at “Byrd” station, 2 km beyond the end of the BSSN”, has been obtained from repeated Doppler satellite fixes (Reference AnderleAnderle, 1974; personal communication from W. H. Chapman). Both methods find that the surface velocity is about 12.7 m a−1, An extreme velocity—depth profile is then obtained by linear interpolation between the deepest relative velocity obtained by Garfield and Ueda and the net velocity of 12.7 m a−1 with respect to the substrate (dashed line in Fig. 3). In this limit, there is no basal sliding. The limit in the other extreme is ice motion entirely by basal sliding (φ = 1, and u t = ?). The bore-hole tilting results suggest, however, that the true situation is closer to that of no basal sliding, for which (φ t = 0.86, and the surface velocity is 1.8 m a−1 faster than the mean velocity.Footnote *
Figure 4 shows the balance velocity qx
of Equation (g) plotted for the case of ?b = 0, Uyt
 , and φ
t equal to 0.86 (solid line) and to 1.0 (dotted line). Note that this widest range of values for φt
affects qx
by only about 7%. Since %t uyt
 is set to zero, the plot is valid where the BSSN follows the flow line (uyt
= 0).
Surface velocity uxt and balance velocity qx for φ = 0.86. Dotted line is for φ = 1.0 and dashed line is for φ = 0.86 including the cross-traverse ice advection term. “Byrd” station and the deep bore hole are at km 162.

The surface velocity uxt is also shown. As described above, at “Byrd” station this velocity is at most 1.8 m a−1 larger than the mean velocity ?x. At km 131, for example, ?x > (9.8—1.8) m a−1, qx ≤ 6.4 (for φι ≥ 0.86), and Z = 2 600 m, so that by Equation (5), if the mean ice density is not changing, the ice sheet between km o and km 131 is thinning at an average rate of at least 0.03 m a−1. If the movement were totally by basal sliding the calculations show an average thinning rate of 0.08 m a−1. As discussed earlier, however, the “Byrd” bore-hole tilting results indicate that most of the ice motion is by internal shear, and 0.03 m a−1 is the best value for the thinning rate.
4. Reliability of Calculations
The calculations leading to the solid lines of Figure 4 assumed that ?
b = 0 and that ?y
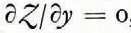 . These are reasonable simplifications for the BSSN region. Generally, the flow line does follow the axis of the BSSN (Fig. 5), so that ?y = 0, and neither important net melting nor freezing at the base of the ice sheet is probable.
A basal net freezing rate of 41 kg m−2 a−1 down-glacier from km 40 (or proportionately less for a larger region)Footnote † would alter the calculations so that there is no thickening or thinning (for the favored φ = 0.86). However, such a freezing rate would have developed more than 580 m of basal regelation ice at “Byrd” station, where only 4.83 m is observed by core analysis (Reference GowGow and Williamson, 1975)· A thickness of a few centimeters or less of regelation ice is expected due to pressure melting and freezing connected with the basal sliding process (Reference KambKamb, 1970;Reference NyeNye, 1970) and the larger observed thickness argues against the possibility of net ablation of ice from the base of the ice sheet. The bottom mass-balance is apparently very small and positive, but for present purposes, not importantly different from zero.
Map view showing the location of the “Byrd” station strain network (rectangle), ice thicknesses in meters, and surface velocity vectors, in the inset map the strain network is the short straight line.

The second assumption, that the term uyt
 is equal to zero, is valid where the BSSN follows or nearly follows the ice flow line (since uyt
≈ 0). The flow line does deviate from the BSSN axis beyond km 131 and, in principle, the term, φ
tUyt
 , could be calculated. Ice thickness gradients in the y-direction are, however, not adequately known. A rough calculation has been made for the region beyond km 131 using the very large value for
 of −0.067 taken from Figure 5. The resulting calculation is shown as a dashed line in Figure 4 for φ = 0.86. Ice thickness gradients in the y-direction and the amount of cross-traverse ice advection uyt
are much smaller elsewhere along the BSSN, except perhaps near the ice crest (Fig. 5), so that setting uyt
 equal to zero is justified for most of the BSSN.
The surface velocity uxt is obtained by assuming that the ice crest (point of highest elevation) is also the ice divide. This assumption is supported by the agreement of the velocity so calculated for near “Byrd” station with the Doppler satellite-determined velocity. The agreement is still good, however, if there is a small horizontal velocity at the ice crest. There is a small surface slope in the y-direction at the ice crest and uyt is expected to be small and positive there, instead of being zero as assumed. Accounting for this possibility alters the balance velocities near the ice crest, especially because of important cross-traverse ice-thickness gradients in that area (Fig. 5), but it does not significantly affect the results of calculations elsewhere.
The x position of the ice divide is also not critical to the analysis. Even if the ice divide should occur, rather improbably, 30 km on the “Byrd” station side of the ice crest, the agreement between the surface velocity and the balance velocity is not strongly affected.
The calculation uses mass balances obtained from stake measurements for the interval 1964 to 1974 (Reference WhillansWhillans, 1975). Mean mass balances for a time comparable to the reaction time of the ice sheet to mass-balance changes are most appropriate to the analysis, and this reaction time is many thousands of years (Reference WhillansWhillans, 1973). Reference ThompsonThompson (1973) finds that the spacing of layering of microparticle content at a depth of 180 m in the “Byrd” station core is compatible with the assumption that the layers are annual, and that surface mass balances and strain-rates have not changed by a large amount during the past 1 500 years. The surface mass-balance distribution in the immediate vicinity of the core hole is, however, not known well enough to apply this finding with confidence to the present work. Reference GowGow (1968) obtained surface mass balances from pit and core studies at “old Byrd” station (Fig. 5). The maximum ten-year mean difference from the 1 700 year mean mass balance is 28 kg m−2 a−1 (for the period A.D. 1570 to 1580). This time record finishes in 1960 and it is not tied either to Gow’s stake network that was started in 1962 (Reference Gow, Gow, de Blander, Crozaz and PicciottoGow and others, 1972) or to the BSSN network.Footnote * It is thus not known how the surface mass balance along the BSSN for 1964−74 compares with the long-term mean for the same area, but this mass balance is unlikely to differ more from the long-term mean than the 1570−80 mass balance differs from the mean for “old Byrd” station.
It would require surface mass balances about 41 kg m−2 a−1, or 30% greater than those measured, for the region between km 40Footnote † and km 160 in order for the continuity calculation to show perfect steady-state. This difference exceeds the maximum recorded change in Gow’s 1 700 year mass-balance record from “old Byrd” station. It is considered very unlikely that the measured mass balances for the BSSN are 41 or even 20 kg m−2 a−1 less than the long-term mean and the thinning rate calculation is considered significant.
5. Discussion and Conclusions
The continuity calculations show that the ice outflow rate is not quite compensated by the surface mass balance, and the ice thickness, or more correctly, the ice mass is diminishing slowly at about 0.03 m a−1 (of ice of mean density). This interpretation is consistent with a recent analysis of radio-echo-determined layering in the ice sheet (Reference WhillansWhillans, 1976). That study found that the ice sheet is and has been close to steady-state, but that small deviations from steady-state, due perhaps to a proportional change in surface mass-balance, would not be detected by the technique.
The change in ice mass determined by the present study could be interpreted as ice-sheet thinning, as a decrease in the mean density of the ice column, or as a combination of both effects. In the present work, the complication of a secular change in mean density is avoided if the thinning result is considered as a rate of loss of mean-density ice, and the changing ice sheet is adjusted in thickness to the present-day mean density. Secular density changes are quite probable due to the penetration of Holocene warmth into the ice mass causing thermal expansion and a density reduction, or to changes in the density of the firn profile caused by more recent changes in surface temperature or mass balance. Such secular density changes do not, however, alter the essential result of this work, that the mass of a vertical column through the ice sheet is diminishing.
For the BSSN region, the balance velocity qx is about 80% of the true mean ice velocity and as such is a reasonable estimate of the mean velocity. The balance velocity was calculated using accurate present-day surface mass balances, ice thicknesses, and measured rates of change of flow-line separation. Reference Budd and RadokBudd and others (1971) calculated balance velocities by a formula (Equation (7)) which is nearly equivalent in the present near-steady-state case, but obtained changes in flow-line separation from elevation contours. Using BSSN thickness, mass balance, and flow-line data, in the formula of Budd and others, which assumes steady-state, the balance velocity is only 15% less than the true mean velocity, and this confirms the use of the balance velocity where true velocity measurements are not available. A calculation of balance velocity from elevation data in the BSSN region could be very misleading because the elevation data, excluding BSSN elevations, are precise to only ±100 m (Reference Behrendt, Behrendt, Wold and DowlingBehrendt and others, 1962), and it is imprecision in elevation data that is most likely to cause errors in balance velocity calculated by Equation (7).
The velocity-profile shape function φ and the difference between the surface and mean velocities were obtained using data from “Byrd” station. The ice flow there may be more complicated than elsewhere because the flow line turns and there is a hill in the substrate at “Byrd” station (Fig. 5), so that it could be argued that the “Byrd” station bore-hole results should not be applied even only 40 km away, as is done here. The “Byrd” station bore-hole tilting data are the only data available for the ice sheet and cannot lightly be discarded; moreover the favored values for φt and (uxt−?x) are already extreme values for “Byrd” station, and although the temperature profile and ice thickness may be different elsewhere, the values of φ t and (uxt−?x ) cannot be very much more different from 1 and 0, respectively, than are the values used. Should this argument be disregarded and allowance made for an increased contribution of basal sliding, the ice sheet would still be found to be close to steady-state and to be behaving simply.
The curves for balance velocity qx and surface velocity uxt in Figure 4 are smooth and vary together, except near “Byrd” station where the change in flow-line direction invalidates the calculations. There are no sudden changes in the main features of flow due perhaps to deviations of deep ice flow from the main flow direction, or to surge-like behavior of a portion of the studied region. This confirms the assumption that, if local-scale variations are smoothed, ice flow at any one site is all in the same direction. In fact, the assumption seems to work on a scale of 10 km or about three times the ice thickness instead often times as earlier supposed. This is an important change in interpretation compared with that of Reference WhillansWhillans (1973), where deep ice advection off the BSSN axis was inferred. That conclusion arose because the ice thicknesses then used were, in part, based on an interpretation of gravity measurements that have since been altered due to the availability of radio-echo depth-sounding data.
That the ice flow can be treated in the simple manner used here is important to other studies of ice flow. This model is similar to the uniform flow model of Budd (1970[a]) and is like that of Reference WeertmanWeertman (1973) and many other studies because it assumes that the ice is flowing in the same direction at each depth and in the same manner everywhere. The use of the velocity-profile shape function φ has similarities with the shape factor of Reference Philberth and FedererPhilberth and Federer (1971), and to the methods used by Budd and Radok (1971, p. 25), Reference Dansgaard and JohnsenDansgaard and Johnsen (1969), and Reference Dansgaard, Dansgaard, Johnsen, Clausen, Langway and TurekianDansgaard and others (1971). The confirmation of this model for near “Byrd” station supports many aspects of the temperature profile modelling (Reference Budd, Budd, Jenssen and YoungBudd and others, 1973), and some time scales for the “Byrd” station ice core (Reference Cow, Gow, Epstein and SharpGow and others, 1973; Reference Johnsen, Johnsen, Dansgaard, Clausen and LangwayJohnsen and others, 1972).
The ice mass is diminishing slowly, and nearly uniformly. If, for example, conditions at the glacier bed had changed so that the ice velocity changed, certain portions of the flow line would be changing thickness more rapidly than other portions. The rates of change in the x-direction of balance velocity and of surface velocity (slopes of the curves in Figure 4) differ by an approximately constant amount, indicating that the rate of thickness change is nearly uniform in the study area. Such a uniform misbalance is not likely to be caused by changes in ice dynamics; rather, the non-steady-state behaviour is most likely associated with a change in surface mass balance, due perhaps to a decrease in annual snowfall that began before the beginning of Gow's mass-balance record in A.D. 1550.
Acknowledgements
I thank C. Bull and other colleagues for review and criticism. Some of this work was conducted while the author was a guest of the Geophysical Isotope Laboratory, University of Copenhagen, Denmark. The work was supported by National Science Foundation Grants GV26137X and GV41373X awarded to the Ohio State University Research Foundation and the Institute of Polar Studies.



