1. Re-conceptualizing the African commons
My purpose here is to offer a fresh look at the persistent challenge represented by what has come to be called ‘the commons’. This retrospective is motivated by the fact that there has been extraordinary analytical attention devoted to the commons, and precious little analytical attention devoted to the wider economic context of the commons. The literature abounds with diagnoses of the intricacies and theoretical details of the commons – and elaborate assessments of the alleged psychological motivations (whether or not they ‘really’ free ride or stint or defect or cooperate) of the individuals embedded there. However, the literature has largely ignored the fact that a commons is simply a particular institutional regime embedded (nested) in a larger and more complex constellation of institutional arrangements at the level of the nation-state. How is it possible to advance explanations about economic behavior in the commons if we ignore the circumstances of the commons in the economy?
My explicit purpose, therefore, is to explore whether or not there are plausible explanations for a degraded commons that do not require the usual reasons of free riding, shirking, and general theft among members of the village and its associated commons. If I can develop a plausible model of resource degradation in the absence of these standard reasons (these alleged ‘explanations’), then it will be possible to entertain the hypothesis that degradation of the African commons might arise from factors outside of the commons rather than arising from standard accounts of selfish behavior within the commons. And if this alternative hypothesis is credible, then it points to a needed reformulation of development assistance away from lamentations about – and prescriptions for – the commons as an isolated entity very much in need of help to rectify alleged ‘problems’ that are themselves the result of a flawed diagnosis. Development assistance might then be refocused on the more legitimate and serious challenge of institutional incoherence in the larger economy of which the village and its commons are but a part.
A necessary starting point for this work concerns the idea of institutions. The development literature recognizes the fact that ‘institutions matter for development’ but there is little agreement as to what, exactly, is meant by that term. We see reference to institutional capacity, institutional roles, institutional strengthening, institution building, and institutional integrity. If we avoid this incoherent treatment of institutions, it is possible to understand why institutions matter for development. A nation-state – and its economic system – are constituted by laws that indicate acceptable and proscribed realms of individual and collective action. These legal arrangements are a country's institutions (Bromley, Reference Bromley2006). Institutions serve to structure both expectations and behaviours. Institutions are the rules and the entitlement regimes (property relations) that constitute the scaffolding – the legal architecture – of an economy. Institutions indicate what:
Individuals must or must not do (duty), what they may do without interference from other individuals (privilege), what they can do with the aid of the collective power (right), and what they cannot expect the collective power to do in their behalf (no right). (Bromley, Reference Bromley1989a: 43)
We see that institutions define opportunity sets (‘fields of action’) for individuals. Different nation-states have different institutions and thus individuals in those nation-states have different fields of action open to them. Smoking is legal in restaurants in some countries but not in others. Pollution is legal in some countries but not in others. Child labor is legal in some countries but not in others.
When donors claim that ‘institutions matter for development’, we must understand this to mean that nation-states are political and legal domains over which a specific constellation of institutional arrangements exists – and those legal arrangements underpin all economic activity. It is necessary to see the economy as a structured set of ordered relations that define individual expectations and therefore individual behaviors. Those structures are the rules and the entitlement regimes that we call institutions.
A coherent institutional regime is one that serves to secure expectations so that forward-looking economic behavior is facilitated. The futures market is an institutional arrangement for mediating price risk. A thorough and well-enforced law of contracts is an institutional arrangement conducive to efficient market processes. A clear and well-enforced institutional arrangement concerning bankruptcy encourages entrepreneurial activity. These institutions (institutional arrangements) serve to reduce transaction costs – the costs of acquiring information about possible transactions, the costs of arranging contracts among transacting parties, and the costs of enforcing those contracts that have been promulgated.
The focus here on institutional decay as it relates to the African commons concerns the long-run persistent deterioration in the legal arrangements of an economy. The institutional setting within which rural Africans are embedded is of a sort that information costs about possible transactions are high, the costs of arranging contracts over possible transactions are high, and the costs of enforcing contracts that have been formulated are high. When law enforcement is indifferent or non-existent, and when the judicial system has fallen into disrepair (and disrepute), institutional coherence is lacking, and economic transactions are stifled. Farmers receive prices below those required to cover production costs, and those production costs are driven up by the high transactions costs of purchasing and using various factors of production. If rural livelihoods are to recover from years of institutional decay, it will be necessary for national governments to create an institutional structure (the legal architecture) that will encourage productive initiatives on the part of individuals, and it will be necessary for those governments to establish the means and the procedures for that institutional structure to be modified through time as social and economic conditions warrant. There is both a ‘static’ and a ‘dynamic’ dimension to successful institutional reform (Bromley, Reference Bromley2006). The process of creating the secure legal foundations for markets, of enhancing the opportunities for new markets to emerge as circumstances warrant, and of supporting those existing and emerging markets over time can only succeed if there is clarity concerning the institutional foundations of a market.
Returning to the problem of institutional decay and resource degradation in the African commons, the goods that move through markets – purchased inputs moving from urban areas to rural villages, and agricultural products moving from distant villages to urban markets – must ‘run a gauntlet’ of high information costs, high contracting costs, and high enforcement costs. Those high transaction costs prevent remote farmers from using purchased inputs in the ideal quantities, and those high transaction costs are parasitic on the net returns to farmers as those goods make their way to urban markets. As the net returns to those embedded in the African commons are undermined by institutional decay throughout the rural countryside, it is inevitable that the asset base of the African commons will suffer gradual deterioration. Necessary investments are postponed, cropping intensity suffers, production declines, net economic returns are diminished, and a gradual degradation in the asset base of the commons is the inevitable result. We see that even when the African commons ‘works’, institutional decay in the rural economy preordains a dissolute and degraded future.
To set the stage, and to focus attention on the on-going process of resource degradation and immiserization in sub-Saharan Africa, I begin with a brief account of the economic situation in a group of countries for which data exist since the mid-1960s.
2. Persistent immiserization in sub-Saharan Africa
A plausible assumption is that the vast majority of rural residents in economies that are themselves overwhelmingly agricultural are quite directly affected by conditions in agriculture. Perhaps long-run trends in per-hectare yields of important staple crops (cereals) provide useful information concerning the general state of affairs in rural areas. If yields per hectare are trending upward then this would seem to suggest that agricultural inputs are finding their way to farmers' fields, that irrigation systems are generally functional, that extension services are providing timely and useful advice to farmers, that labor conditions in rural areas are not inhibiting agricultural productivity, and that many people are finding good reasons to remain in rural areas and resist the lure of larger urban areas.
On the other hand, if we find that per hectare yields of cereals show evidence of secular decline, several hypotheses might be implicated. Perhaps fertilizers are in chronic short supply, perhaps other inputs are unavailable, perhaps depopulation of the countryside means that labor is a binding constraint during critical periods, perhaps HIV/AIDS is making it impossible for families to muster the necessary labor required of agricultural pursuits, or perhaps expansion of the arable area has brought inferior land into production and hence nation-wide average yields per hectare are falling over time. Finally, perhaps institutional incoherence in marketing channels has reduced the net returns to agricultural land and has thereby forced the postponement or complete abandonment of necessary investment to improve land quality.
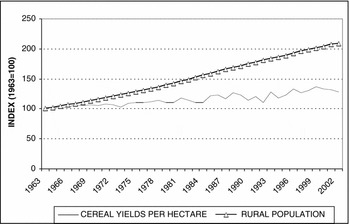
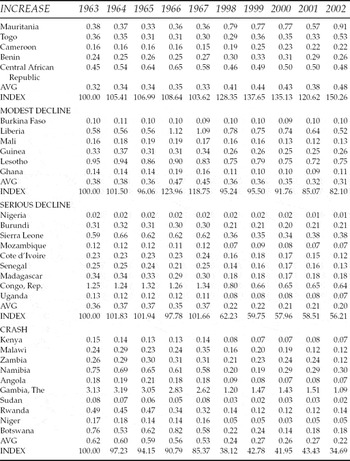
Therefore, the first place to look might be cereal yields per hectare. We can obtain quite reliable data for 30 countries in sub-Saharan Africa (figure 1). The 30 countries are listed in table 1 where per hectare yields are corrected for the growth in rural population over the period under study. Two five-year periods are shown.
Index of cereal yields and total rural population, 30 countries in sub-Saharan Africa
Source: World Development Indicators (2006).

Per hectare cereal yields (kg) per 1,000 rural residents

Source: World Development Indicators (2006).
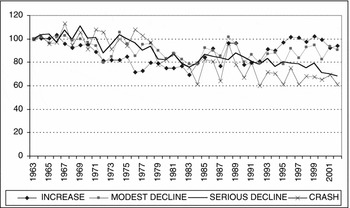
Figure 1 shows the index of per hectare cereal yields since 1963, as well as the index of rural population over that same period for the 30 countries under study here. In general, per hectare cereal yields across these 30 countries now stand approximately 28 per cent above their level in the early 1960s – a quite modest rate of increase. However, the number of rural residents has doubled since 1963. The important implication is that across these 30 countries, cereal yields per hectare, once corrected for the growth in the rural population, are now below their level in 1963. In particular, in table 1 we see per hectare cereal yields per 1,000 rural residents for the 30 countries covering five-year periods at the beginning and the end of this four-decade span (1963–1967 and 1998–2002). The 30 countries have been partitioned into four categories – those for which per capita (rural residents) yields have increased, those experiencing a modest decline in per capita (rural residents) yields, those experiencing a serious decline in yields per rural resident, and those for whom we might conclude that yields per rural resident have crashed.
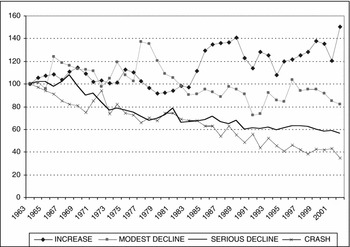
The averages for these four categories are then plotted in figure 2. Only five of the 30 countries have managed to bring about an increase in per capita cereal yields per rural resident. The other 25 countries have experienced declines in this important indicator of rural livelihoods – six showing a modest decline, nine showing a serious decline, and ten showing a decline so severe (65 per cent) that it is here referred to as a ‘crash’.
Index of cereal yields per hectare per 1,000 rural residents (1963 = 100)
Source: World Development Indicators (2006).

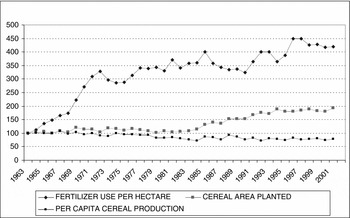
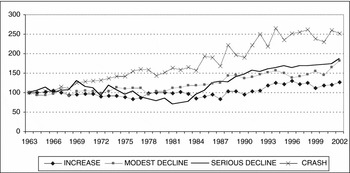
We see that per capita (rural residents) cereal yields per hectare have been declining in 80 per cent of these countries. Can we explain these trends? Perhaps fertilizer use has fallen behind levels in the early 1960s? In figure 3 I show indices of three additional factors. First, fertilizer use per hectare has increased dramatically. Second, total area planted to cereals has doubled. Third, repeating the record for rural residents, we see that total cereal production on a per capita basis for both urban and rural people has fallen to approximately 75 per cent of its level in 1963.
Several indices of agricultural performance (1963 = 100) Source: World Development Indicators (2006).

In figure 4 we see that the countries enjoying an increase in cereal yields experienced a dramatic increase in the use of fertilizers. However, the differences between these five countries and the six countries experiencing a modest decline in yields per rural resident are not pronounced. There is some indication that the 19 countries experiencing the most serious declines in per hectare yields were using less fertilizer per hectare of cereals. But there is more to the story. Specifically, these four groups of countries expanded their cereal area at quite different rates. In figure 5 we see that those countries with the worst record of cereal yields per rural resident increased total area planted to cereals by  times. Notice that the five countries with increased yields per rural resident have the lowest increase in area devoted to cereals. Have the poor performers stressed extensification at the expense of higher yields through intensification? If so, why was extensification the preferred strategy? If labor is relatively abundant compared to financial resources for investment in existing cultivated land, perhaps clearing land of trees and other vegetation in order to augment agricultural areas is the only option open to farmers. That is, do we regard extensification of agriculture as a cause of declining per hectare yields, or as the effect? Place and Otsuka (Reference Place and Otsuka2001) have studied an aspect of this problem in Malawi.
Index of fertilizer use per hectare (1963 = 100) Source: World Development Indicators (2006).

Index of total cereal area (1963 = 100) Source: World Development Indicators (2006).

Finally, recall from figure 3 that total per capita cereal production in all 30 countries is below its level in 1963. Even the six countries that showed increasing per hectare yields per rural resident have failed to keep pace with population growth when both urban and rural residents are considered. And the 19 countries with the most pronounced declines in terms of rural residents (from table 1) show total cereal production per capita at 60–75 per cent of levels achieved 40 years ago. Agriculture in Africa would seem to be in serious disarray. Rural livelihoods have surely suffered as a result. It would seem plausible to infer that land in much of Africa is suffering from disinvestment and inevitable deterioration. I suggest that this is a record of serious immiserization.
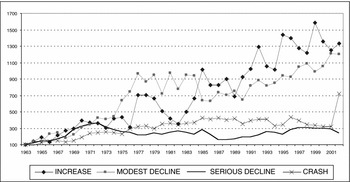
To summarize this picture, consider figure 6. Here I show the long-run trends in total cereal production per capita (both urban and rural) for the four groups of countries depicted in table 1. That is, the classification scheme used here is the same as that for yields of cereals on a per capita basis of rural residents. Here I have computed total cereal production in each country on a per capita basis (total population, not just rural) and plotted that for each country according to its category from table 1.
Index of per capita cereal production (1963 = 100)
Source: World Development Indicators (2006).

Can this record of immiserization be explained? Is the African commons the cause of this desultory history of economic decline? Or is the African commons the victim of something larger?
3. The commons as a going concern
I regard a commons as a going concern. A going concern is a group of people united in pursuit of a particular purpose (Bromley, Reference Bromley2006). Examples of going concerns include the family, a sport club, a firm, a particular government agency, and indeed a nation-state. The organizing idea of going concerns is that they are given meaning and coherence by two classes of institutions: (1) their internal working rules, and (2) those working rules that constitute their separate existence as part of some larger going concern. The internal rules (institutions) – indicate who is in charge, who does what tasks, who defines and redefines the purpose of the going concern, how disputes are resolved, and the like. At the boundary of going concerns we then encounter those institutions (working rules) that define the context of the particular going concern vis-à-vis all other going concerns. These contextual institutions situate a going concern in the economy and the polity. Examples include what purposes the going concern is allowed to have given its embeddedness in a larger political and economic environment. We see this when nation-states stipulate that going concerns may not have, as one of their purposes, the manufacture and sale of opium (or other serious drugs). Another example would be that going concerns may not discriminate against individuals on the basis of gender or race. All going concerns obtain their social meaning, and their operational architecture, from the melding of these internal and contextual working rules (institutions).
The reason for this emphasis on the contextual institutions is that going concerns are not isolated entities inside the nation-state. Rather, they are connected and dependent in profound ways. And since they are not – and logically cannot be – isolated concerns, analytical work on them in isolation from the complete institutional context within which they exist is incomplete, underdetermined, and therefore of doubtful diagnostic value. Since every policy prescription is, at the same time, a policy prediction, flawed diagnosis inevitably leads to flawed prescriptions – which then entail flawed predictions about how particular ‘problems’ will be readily fixed if only the (flawed) policy prescriptions were to be implemented. The fact that over 40 years of prescriptive advice about how to lift the poorer countries in sub-Saharan Africa out of their economic torpor has had so little good effect would seem to suggest that the standard assured prescriptions as predictions have been grounded on rather dubious causal structures.
Those familiar with the history of the commons will recognize the following sequence of events. Following Garrett Hardin's (Reference Hardin1968) specious linking of grazing behavior with human fertility outcomes, we have had almost four decades of conceptual incoherence about the commons (Bromley, Reference Bromley1989a, Reference Bromley1991, Reference Bromley1992; Bromley et al., Reference Bromley, Feeny, McKean, Peters, Gilles, Oakerson, Runge and Thomson1992; Larson and Bromley, Reference Larson and Bromley1990). It was not long before the international donor community launched titling and registration programs to convert the primitives into proper ‘owners’. National governments, apparently embarrassed by ‘backward’ pastoralists, sought measures to enclose them so that they would behave better with respect to rangelands, as well as each other. Enclosures also provided the opportunity for national governments to expropriate lands and related resources central to pastoralism so as to incorporate remote peoples and their political structures into the nation-state. Scholars from afar arrived to study commoners so that they could learn exactly how the commoners managed to survive under such bizarre circumstances. Surely, their quaint and ‘backward’ property relations offered sufficient reason why they were so poor. Their every move was described, analyzed, and stylized. They became objectified. We now have elaborate models about them. We claim to know the arguments in their utility function. We claim to know why they do what they do, and we claim to know how they expect their fellow commoners to react in games depicted by the presence of a subgame perfect equilibrium. But, in reality, we know very little about commoners because we rarely assess their dependence on the larger economy in a manner that will show plausible connections between that dependence and the state of the resources on which they depend.
4. The model
I start by referring to an earlier model depicting agents who face a rather standard risky situation, but who also face risk associated with a collective consumption good that comprises the legal foundations of the economy (Bromley and Chavas, Reference Bromley and Chavas1989). In that model, agents could invest in private goods or they could invest in public goods (collective consumption goods) that would strengthen the institutional environment in which they made investments in their private goods. In that paper we derived the willingness to pay for improvements in this institutional environment (as a public good) that would benefit all members of the village, and that was not diminished by its use. That is, the enhanced public good (institutional coherence) was not excludable, nor was it rivalrous. The willingness to pay for improvements in the ‘quality’ of the public good can be thought of as one measure of the losses associated with the poor quality of that good.
I shall here use the idea of institutional coherence from that earlier work to motivate a more detailed treatment concerning the relationship between the institutional conditions in an economy and economic performance in the commons. If institutional conditions are coherent and provide reliable signaling, individual action will generally lead to income growth and a gradual escape from poverty. On the other hand, if the institutional conditions that parameterize village life are of low quality, meaning that the resulting signaling is perverse, it is difficult for individuals to form plausible expectations concerning investments and other economic transactions. If that is the case, forward-looking actions with respect to the management of individual assets will be undermined. Investment will suffer, the general resource (asset) base of the village will deteriorate, and poverty will be the inevitable result. It is from this perspective that I propose to explore the economic implications of what I shall here call institutional decay. The assumptions of my model are as follows.
Consider a village in which all adult members of the community are understood to be the legitimate co-owners of a specific set of shared assets defined over the geographic scope of the village. As co-owners of this shared asset, they retain certain rights over it. They also face certain duties with respect to others in the village. For instance, with respect to land, all individuals have secure expectations regarding continued access to those parcels currently under their use and management, and they may bequeath any or all of those parcels to members of their extended family. The correlated duty is that they may not alienate (sell) those parcels now under their management and control. This is a rather standard depiction of a common property regime (Bromley, Reference Bromley1991, Reference Bromley1992).
Second, I assume that this is a common property regime that ‘works’. Specifically, the villagers (the co-owners) have agreed to recognize each individual's interest in a share of the jointly owned asset, and to sanction the appropriation by each individual of the fruits to arise from his/her activities on these identifiable parcels of land. If one individual decides to withdraw his cattle from a pasture for a period of time this year, thus allowing the forage to become more bounteous next year than would be the case if grazing pressure in the present period had been sustained, he is assured that he may use the pasture for those cattle next year, and he is assured that others in the village will not increase their current stocking rate to take what he has decided to leave for next year. In short, there is no stealing, shirking, or free riding.
Third, assume that there are two possible economic activities associated with each individual's use of his/her parcels in the village commons. The first land use is one in which all of the total production from the parcel is consumed by the individual (and his/her family), or it is given to others as part of a system of exchange and tribute. None of the production is marketed outside of the village. Consider this to be a subsistence use. The second land use is one in which the production from the parcel of land is exported out of the village and sold in an urban area some distance from the village. We thus have goods that are consumed locally (domestic goods), and we have traded goods destined for the distant urban economy. Land parcels are assumed identical in the beginning and they can be used for either activity. In that sense, parcel identity in the model comes not from some unique ownership trait but from the use to which the parcels are put. Notice that trade with the external economy introduces an element of additional risk that is not present in the domestic (subsistence) economy, and this risk redounds to the detriment of those parcels devoted to the production of traded goods. That is, after accounting for weather, disease, and pests that affect the productivity of both types of parcels equivalently, economic activity on parcels devoted to traded goods carries an additional risk that is not present for those actions associated with parcels devoted to the production of subsistence goods. For the parcels devoted to the production of traded goods, the additional risk arises from institutional incoherence – institutional decay – in the larger economy. I will elaborate this point below.
With two different risk profiles for goods produced from the village commons, we see that parcels of land implicated in the production of these two classes of goods can be thought of as two distinct assets with parcel-specific risk attributes (profiles). Only those parcels engaged in the production of traded goods are modeled as risky assets, and the risk associated with those parcels arises from the stochastic nature of the ultimate price (value derived by the seller) of traded goods arising from those parcels. Institutional decay implies that traded goods originating in scattered villages must bear a discount in expected price because the village is ‘institutionally isolated’ from urban markets. That is, the institutional integrity (or lack thereof) of the national market influences the economic returns from investing in the assets associated with the traded good. If the institutional foundations of the economy are seriously deficient, as is the case in much of sub-Saharan Africa, traded goods arising from parcels in the village commons encounter institutional influences that undermine the value of the asset from which they arise.
Recall that the economic value of an asset is simply the discounted present value of all future net returns attributable to that asset. If prices received for traded goods as they make their way to urban markets are undermined (degraded) because of institutional incoherence in the economy, then the value of the asset from which those traded goods arise will suffer accordingly. And with a subset of parcels in the commons undergoing disinvestment and degradation, it cannot be long until such dissolution affects the other parcels devoted to subsistence goods. We now see the distinct possibility of asset deterioration in the commons even in instances where there is no shirking, free riding, or stealing. Here is a common property regime that ‘works’ in the narrow (internal) sense of that idea, and yet degradation is set in motion because of institutional circumstances in the broader economy within which the commons is embedded.
We see that the model envisions two economic activities in the village commons – one concerns the production of domestic goods for which there is no extra risk beyond the usual stochastic elements of weather and pests, and one devoted to the production of traded goods and thus exposed to the random effects of a flawed institutional environment in the larger economy. Those investments in assets associated with domestic goods are relatively safe, while investments in assets associated with traded goods are relatively risky. Individuals in the village hold both kinds of assets, and they undertake periodic investments in each, depending on their income position and their investment acumen.
Now assume two kinds of agents in the model – sophisticated (denoted by i), and naïve (denoted by n). Naïve agents are those who ‘falsely believe that they have special information about the future price (value) of risky assets’ (De Long et al., Reference De Long, Schleifer, Summers and Waldmann1990: 706). The existence of two kinds of agents allows us to model the differential trajectories of asset values as a function of the shifting proportions of naïve and sophisticated agents in the face of altered market conditions for the traded products of the risky asset. Or, more correctly stated, in the face of the greater risk associated with the market value of the traded goods as they make their way to the urban center – such value degradation then working its way back to adversely affect the value of the asset devoted to the production of those relatively more risky products.
The literature on stock market behavior refers to naïve agents as ‘noise traders’. . . . if investors have short horizons and noise traders' misperceptions cannot be forecasted by arbitrageurs, then the fundamental risk is not the only source of risk in the market . . . the unpredictability of noise traders' sentiments brings an additional risk into the market: the risk that noise traders' beliefs will not revert to their mean for a long time and might become more extreme in the meantime. (Palomino, Reference Palomino1996: 1537)
The risks in this model are therefore: (1) the effects associated with the selling of goods from certain parcels in the commons into a highly uncertain and distant urban market; and (2) the effects associated with swings in the valuations of others in the village as it affects their behavior with respect to their assets. If the naïve agents begin to undervalue their assets, and as the proportions of naïve and sophisticated agents shift over time, investment strategies of the remainder of villagers will be affected. With two kinds of assets (safe, risky) and two kinds of agents (sophisticated, naïve), I now turn to a specific model of institutional decay.
Assume that the two assets (safe, unsafe) pay identical returns across an overlapping-generations infinite future. The first asset (s) is relatively safe and pays a fixed real return r. Asset s is in perfectly elastic supply, meaning that it can be created out of, and converted into, a unit of consumption in any period. As above, the safe asset produces subsistence goods. Letting a unit of consumption represent the numeraire, the price of the safe asset is always fixed at 1. The dividend r paid on asset s is therefore the riskless rate of return.
The second asset (u) is relatively unsafe and pays the same fixed dividend r as does the safe asset s. The difference here is that asset u is not in elastic supply – it is in fixed and unchangeable supply normalized at one unit. The price of u in period t is given by p t. If the price of each asset were equal to the net present value of future earnings, assets s and u would be perfect substitutes and would both sell for a price of 1 in all periods. But in an economy exhibiting institutional decay as modeled here, this is not how the price of u is determined. It seems useful to pause here and discuss the ‘price’ of assets s and u in a setting in which they are not actually sold. In the model that follows, price is simply an indicator of the value of the asset. Even though the two assets are allocated by fiat within the village commons, or are bequeathed by the current occupant (the agent in this model) to relatives, these assets have quality attributes that affect their value. This measure of value is the (shadow) price of the asset.
Sophisticated agents are denoted by i, and naïve agents are denoted by n. The naïve agents are present in measure μ, while sophisticated agents are present in measure (1−μ). Agents within each type are identical. Both types of agents invest in the two kinds of assets in period 1 to maximize perceived expected utility under their own beliefs about the ex ante mean of the distribution of the price of u in the next period (t + 1). The (representative) sophisticated agent in period t accurately perceives the distribution of returns from the risky asset u and thus maximizes expected utility in light of that distribution. The (representative) naïve agent in the first period mis-specifies the expected price of the risky asset by an independent and identically distributed normal random variable ρt

The mean misspecification ρ* measures the ‘average’ overconfidence of naïve agents in the commons, while σ2ρ is the variance of the naïve agents' misspecification of the expected returns per unit of investment in the risky asset.Footnote 1 The naïve agents maximize their expectations of utility given the returns from the asset in the second period, the next-period variance of p t+1, and their (incorrect) belief that the distribution of the price of u in the next period has mean ρ t above its true value. Each agent's utility is a constant absolute risk aversion function of wealth in the second period

where γ is the coefficient of absolute risk aversion. If we assume that returns to investment are normally distributed, then maximizing the expected value of (2) is equivalent to maximizing

where ω is the expected final wealth, and σω2 is the next-period variance of wealth. The sophisticated agent chooses the amount λti of the risky investment u so as to maximize

where y 0 is a function of first-period labor income, an anterior subscript denotes the time at which the expectation is formed, and

is defined as the next-period variance of p t+1. At the same time, the representative naïve agent chooses λtn so as to maximize

The final element in (6) shows the extent of the naïve agent's misspecification of the expected return from holding λnt of the risky asset.Footnote 2
In the first period, members of the village divide their limited investment funds between u and s. The extent λnt and λit of investments made in the risky asset depends on its price p t, on the next-period distribution of the price of u, and – at least for naïve agents – on their misperceptions ρt of the expected price of the risky asset. When they are old, agents convert their holdings of s to the consumption good, ‘sell’ or bequeath their holdings of u for price p t+1 to the young inside the village, and consume all their wealth.
We can determine the investments in u for both types of agents by solving the maximization problems (4) and (6), yielding
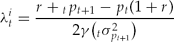

The demands for holding the risky asset are proportional to its perceived excess return, and inversely proportional to its perceived variance. The additional term in the demand function of naïve agents (8) comes from their misperceptions of expected returns. When they overestimate expected returns, they demand more of the risky asset than the sophisticated agents do. When they underestimate expected returns they demand less. The price variation (denominator) arises from naïve agent risk. Both naïve agents and sophisticated agents limit their demand for asset u because its value (in essence, its shadow price should they imagine selling it) depends on the uncertain beliefs of the next period's naïve agents. This price uncertainty affects all agents regardless of their beliefs about expected returns, and thus limits the extent to which they compete with each other for investments. In the current setting, this modulates the extent to which villagers move into the production of traded goods as compared to sticking with subsistence goods. If the price in the next period were certain, both kinds of agents would hold (with certainty) different beliefs about expected returns.
In working out equilibrium prices, notice that the old liquidate their holdings, and thus the demand of the young must sum to 1 in equilibrium. Considering equations (7) and (8), we see that

Here is the risky asset's value (price) in period t as a function of: (1) period t's misperception by naïve agents (ρt); (2) the parameters (r) and (γ); (3) the proportion of agents who are naïve (μ); and (4) the moments of the next-period distribution of p t+1.Footnote 3 From this, the endogenous next-period distribution of the value of asset u can be eliminated from (9) by solving recursively the following

Notice that γ, ρ*, and r are constants, meaning that only the third term in (10) varies. The next-period variance of p t is a simple unchanging function of the constant variance of a generation of naïve agents' misperception ρt
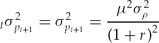
The final form of the pricing rule for u, in which price depends only on exogenous parameters of the model, and on shared information about present and future misperception by naïve agents, is

The final three terms in both (10) and (12) show the effect of the naïve agents on the price of the uncertain asset u. As the distribution of ρt converges at 0, the equilibrium pricing function (12) converges to its base value of 1. The second term in (12) captures the fluctuations in the price of u because of variation in the naïve agents' misperceptions – its price shifts as the naïve agents' options shift. If a new generation of naïve agents is more optimistic than the average generation, they will bid up the price of u. When they hold their average misperceptions (ρt = ρ*), this term is 0. If naïve agents begin to perceive a worsening of the economic situation, they can rather quickly bring on a downward trend in the price of the uncertain asset u. Notice that as naïve agents become more prevalent compared to the sophisticated agents, asset prices become more volatile, and the situation can quickly spiral downwards. The third term in (12) captures deviations of ρt from its fundamental value due to the fact that the average misperceptions by naïve agents are not 0. If such agents are aggressive, this will show up as price pressure driving the price of the risky asset higher than otherwise. These optimistic naïve agents bear above-average price risks. Since the sophisticated agents bear a smaller share of price risk with higher values of ρ*, they will require a lower expected excess return and are thus willing to pay a premium price to acquire u. The heart of the model is found in the third term of (12). Sophisticated agents will not wish to hold the risky asset (land devoted to tradable goods) unless compensated for bearing the risky prospect that the naïve agents will turn timid and drive down the price of that relatively risky asset.
With this model in hand, I now turn to an illustration of how institutional incoherence in the larger economy is transmitted into common property regimes, how this transmission of institutional decay initially manifests itself in the gradual deterioration in the value of the asset devoted to the production of traded goods (u), and how this decline in the value of (u) then ultimately induces a gradual deterioration in the value of the relatively safe asset (s) devoted to the production of the subsistence (non-traded) good. In other words, we can account for the gradual depreciation (degradation) of assets (land) in common property regimes in the absence of standard accounts of theft, shirking, and free riding.
Notice that I have ignored the possibility of a labor market in or near the village commons that would offer a source of income other than the production of subsistence and traded goods within the village. If we imagine a third income strategy – wage employment – we must also assume that returns to labor (wages) in that market would not (indeed could not over the long run) differ in large measure from what is possible as a return to labor from work applied to s and u inside the village. In the absence of constraints on the movement of labor between the wage sector and the production of goods and income from village common land, we must anticipate general equilibrating processes at work. That is, the institutional incoherence that is here modeled as being parasitic on the realized price (value) of traded goods would generate side-effects across all sectors in the rural economy. Of course, rural labor could certainly leave the village for part of the year and possibly take up urban employment – provided that the national economy offered such promising prospects (not always a reasonable assumption). But with institutional incoherence in the larger economy this prospect seems unlikely to offer sufficient promise for villagers. Hence, while I have ignored wage employment outside of the village, doing so does not seem to alter the analytical insights of the basic model.
5. The commons in the national economy
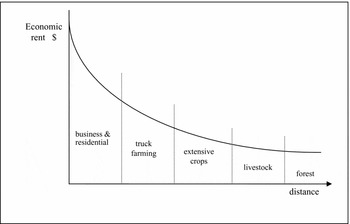
In an earlier paper (Bromley, Reference Bromley1989b), I presented a model depicting a continuum of property regimes in a developing economy, and I then derived the frontier between private (individual) rights in land, and communal land at or near the extensive margin. I now build on that continuum by recalling the work of Johann Heinrich von Thünen concerning rent gradients radiating out from an urban place. In figure 7 we see a classical von Thünen featureless plain.
The rent-gradient model

The rent gradient in figure 7 is predicated upon a functioning market and general mobility of factors and products across space under some assumption on transport costs. Notice that the different land uses are equally dependent on a set of assumptions about productivity, prices, technology, and spatial preferences for work and living.
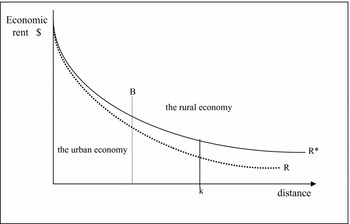
In figure 8, I have modified the classic von Thünen model so that there are but two types of land uses in the economy: (1) urban, and (2) rural. People live in both places, with the urban economy consisting of non-agricultural activities, and the rural economy containing agricultural activities organized under a regime of village-based common property. The border between the two regimes is at B.
Two rent gradients

Recall that in the rural economy there are two kinds of investment opportunities – the relatively safe asset and the relatively risky asset. All production from the safe asset (s) is consumed by the individual making investments in s, while all production from the risky asset (u) is marketed outside of the village in the urban sphere. These products are embodied in the usual account of the rent gradient – here depicted by R*. It is here that the institutional incoherence of the nation-state bears on the value of the relatively risky asset (u) that gives rise to the traded goods. As above, the rent gradient in figure 7 is an idealized gradient embodying prices received under the assumption of complete and well-specified institutional arrangements concerning the movement, contracting over, and disposition of traded goods from the rural economy. However, the economic problem in most developing countries is precisely concerned with the weak institutional arrangements, where the primary purpose is to assure the low-cost movement of inputs and products among suppliers, producers, wholesalers, and final consumers. That is, the purpose of an economy's institutional architecture is to allow for the low-cost functioning of the economy. When that institutional architecture is flawed, transactions costs dissipate the possible gains from trade, and localized autarky is the expected result (Bromley and Chavas, Reference Bromley and Chavas1989). In such instances, the standard (idealized) rent gradient overstates the economic rent arising from assets (land) in consequence of institutional incoherence in the economy. We may think of this as a problem of decay in the value of assets as one moves out from the urban core – not because of transportation costs (which are the central idea of the standard rent gradient), but because of institutional incoherence. More distant points in an economy suffer from increasing (with distance) institutional decay.
The dashed line (R) in figure 8 depicts the effects of institutional decay. The earlier model of two types of agents and two types of assets remind us of the extent to which there is an intimate relation between the prices (the values) of each asset. It is now possible to explore how institutional decay in the marketing realm of traded goods works its way into the value of the asset (u) used for the production of traded goods, and then undermines the value of the asset (s) used for the production of the subsistence good. Consider equation (12) from above.

Recall that the price (p t) of the relatively unsafe asset (u) is normalized on 1, and that the other components of equation (13) indicate the extent to which the outlook of the naïve agents will cause that price to deviate from 1. Now let ϕk depict the degree of institutional decay associated with a village at point k. Let this index of decay be depicted as 0 < ϕk < 1, and let this index be under the control of the members of the village. That is, ϕk reflects the effect of mitigating activities undertaken by villagers to provide institutional coherence when it is otherwise missing. If villages are able through their individual efforts to create a perfect institutional environment in which traded goods from u move to urban markets, then the value of ϕk equals 0 and there is no decay in the market value of traded goods (other than transport costs) as a function of their remote origins at k. On the other hand, if the villagers are unable through their own efforts to recreate the conditions of a coherent institutional regime for the transfer of traded goods from the village to the urban center, the value of ϕk will approach (but not equal) 1. We can expect the incorporation of ϕk into the model to give even greater scope for naïve agents to play a role in price (value) formation. With this idea in hand, we can write the rent from parcel u at point k as

where Q is the average yield of a good produced from the relatively unsafe asset (parcel) u, p t is the sale price of that good in the urban center, ϕk is the index of institutional decay associated with point k, TC is the average total and variable cost of producing a unit of Q at point k, c is the transport costs per unit of Q per unit of distance from the urban center, and k is distance from the urban center. Notice that when ϕk = 0, equation (14) reduces to the pure von Thünen rent gradient (R* in figure 8), but that when ϕk takes on values greater than 0 the rent gradient traces out the inferior gradient R in figure 8.
Villagers can, of course, expend their own time and financial resources to bring ϕk closer to 0 in order to preclude the value of asset (parcel) u being driven down because of institutional decay. This was the idea developed in Bromley and Chavas (Reference Bromley and Chavas1989). However, when the outlay of private financial resources is required to create the missing public good by private means, there is less discretionary income available for agricultural investments in both types of parcels – both s and u. And even if there is a labor market, it cannot be expected that this opportunity for off-farm work will return wages in the long run that differ much from the meager opportunities available from cultivation of either type of parcel. Unless the government is willing to devote its energies and financial resources to improve the institutional aspects of agricultural marketing channels – to mitigate institutional decay – these costs must fall on the villagers themselves. Agricultural producers are thus faced with a difficult choice. If they devote time and money to protect against institutional decay that reduces the realized value of their traded products from the relatively unsafe asset, they must divert resources away from investment in production-enhancing improvements on landed assets in the village, or they must withdraw their labor from the wage sector in order to provide for enhanced institutional coherence. Regardless of which route they choose, it is only a matter of time before necessary investment funds are diverted away from the parcels (s) devoted exclusively to the production of the subsistence good. The village commons is on a trajectory of resource degradation even though the internal institutional arrangements governing the workings of the commons are perfectly incentive-compatible and conducive to ensuring that individuals do not free ride or shirk.
The model suggests that widespread immiserization and resource degradation in much of Africa must be considered in a different light. The standard literature on the commons has situated the blame – the alleged ‘explanation’ – for resource degradation inside the commons, where it is claimed that tenure insecurity and the lack of private title to agricultural land is the cause of (the reason for) inadequate investment and the inexorable cycle of resource degradation, poverty, and further resource degradation. The model developed here offers an alternative explanation.
6. Implications
Accounts of economic stagnation and immiserization in Africa are now standard fare in the development literature (Bigsten, Reference Bigsten2002; Easterly and Levine, Reference Easterly and Levine1997; Ndulu and O'Connell, Reference Ndulu and O'Connell1999; Pritchett, Reference Pritchett1997; Sender, Reference Sender1999; Tiffen, Reference Tiffen2003). Reflecting on some of the data described above, we see a 40-year history of serious declines in per capita agricultural yields. In addition, other data suggest that growth in per capita GDP has been largely missing, and the record of job creation to keep abreast of population growth is not encouraging (WDI, 2006). In the light of this history, it is not surprising that asset deterioration is to be expected – not as the cause of the economic problems and immiserization, but as the inevitable result (the effect) of those problems (Larson and Bromley, Reference Larson and Bromley1990).
Curiously, much of the literature on common property resource issues has ignored these general economic circumstances and has concerned itself, instead, with accounts of how the desultory commons could be revitalized if only tenure could be made more secure. There is now a major effort to ‘formalize title’ (de Soto, Reference de Soto2000). It is claimed that if only tenure was individualized, and titles then issued, individuals would have an incentive to invest in land, and they would have a title to secure the necessary credit to do so (Feder and Onchan, Reference Feder and Onchan1987). The conceptual and empirical provenance of this work has been challenged (Atwood, Reference Atwood1990; Carter and Olinto, Reference Carter and Olinto2003; de Janvry et al., Reference de Janvry, Platteau, Gordillo, Sadoulet, de Janvry, Gordillo, Platteau and Sadoulet2001; Deininger, Reference Deininger2003; Deininger and Feder, Reference Deininger, Feder, Gardner and Rausser2001; Fitzpatrick, Reference Fitzpatrick2005; Lund, Reference Lund2000; Migot-Adholla et al., Reference Migot-Adholla, Hazell, Blarel and Place1991; Ndulu and O'Connell, Reference Ndulu and O'Connell1999; Ouedraogo et al., Reference Ouedraogo, Sawadogo, Stamm and Thombiano1996; Place and Hazell, Reference Place and Hazell1993; Platteau, Reference Platteau1996; Sjaastad and Bromley, Reference Sjaastad and Bromley1997, Reference Sjaastad and Bromley2000).
I have sought here to demonstrate that the explanation for resource degradation in the African commons cannot plausibly be isolated within the confines of the village and its customary tenures. No community of villagers, regardless of the property regimes in which they are embedded, can possibly be treated as isolated and autonomous entities set apart from the institutional milieu of the nation-state of which they are a part. It follows that concern for the African commons is misplaced if the focus of development assistance is confined to the assets and working rules (property regimes) entirely inside of villages. Indeed, an exclusive focus on the property relations of isolated villages and their commons will necessarily fail if development programs ignore the institutional architecture of markets and market processes throughout the entirety of a nation. The model developed here demonstrates the inevitable and quite obvious linkages and entailments that connect village commons and villagers together – regardless of the property relations inside of their communities. It is time for conceptual and empirical research to pay much more careful attention to the institutional isolation of the African commons.