Introduction
History has credited Edward Augustus Inglefield (1820–1894) (Stone Reference Stone1987) with several achievements during his voyage of 1852 in search of the missing Franklin expedition. Among these is the penetration of Jones Sound to 84° W longitude, the furthest point west in the sound recorded to that date. That particular claim has not been seriously questioned and continues to be reported in modern books on Arctic history (for example Mills, Reference Mills2003). In this paper the claim of reaching 84°W is examined by analysing Inglefield's own chart of Coburg Island at the entrance to Jones Sound.
Background
The first recorded European visit to Jones Sound was in 1616 by William Baffin but then the region was neglected until John Ross observed the sound again in 1818. He did not land and assumed, as with Lancaster Sound, that it was simply a deep bay with no outlet (Vaughan Reference Vaughan2007). During the first half of the 19th century, Jones Sound was neglected although whalers were doubtless familiar with the region. In 1848 a whaler, Captain Thomas Lee was reported to have sailed well into Jones Sound although considerable doubt hangs over this voyage (Ross Reference Ross2003). The following year another whaler, Captain John Gravill, entered the sound and landed somewhere on the south east coast of Ellesmere Island from where he examined it with a telescope for some 40 to 50 miles (Great Britain 1850).
In 1851 the two steam ships in Horatio Austin's large expedition sailed north out of Lancaster Sound and entered Jones Sound but were prevented by ice from going further west than Cone Island. They surveyed the coast and Coburg Island before sailing to their rendezvous with the remainder of the fleet (Osborn Reference Osborn1854). Austin's chart of the entrance to Jones Sound was published on his return (Great Britain 1852A). In the following year 1852, Inglefield conducted a search for the Franklin expedition privately sponsored by Lady Franklin. He took a single, steam-assisted yacht Isabel with a crew of seventeen. After traveling northwards along the west coast of Greenland he reached latitude 78° 28’N, well north of the furthest point north reached to that date in that area. Because of the small crew, Inglefield personally carried out the observations and measurements for the surveys.
Returning south he followed the Ellesmere Island coast into Glacier Bay where he conducted a survey of Coburg Island. Continuing along the Ellesmere Island coast he reported passing Smith and Cone Islands until reaching ‘an extraordinary shaped island’ which he named Sir Robert Inglis Peak. Having claimed to have reached about 84°W near this point, the meteorological record in his book gives 85° 20’, Inglefield crossed to the south shore, turned east and sailed rapidly out of Jones Sound later returning to England a hero (Inglefield Reference Inglefield1853). An obvious problem with this claim is that there is no feature in Jones Sound around 84°W that corresponds to his Sir Robert Inglis Peak.
Charts of the entrance to Jones Sound
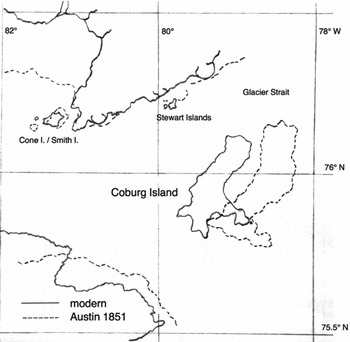
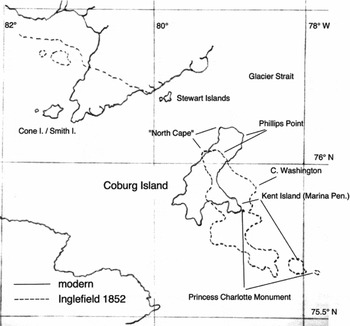
Austin's chart of the entrance to Jones Sound is shown in Fig. 1 with the modern map superimposed. Agreement is good. The position of Cone and Smith Islands is exact, the coast of Ellesmere Island corresponds well, while Coburg Island has the correct shape and orientation but is slightly enlarged and displaced about 15km to the east. In contrast, Inglefield's chart (Hydrographic Office 1853), shown in Fig. 2, is very inaccurate. Of particular note is Coburg Island drawn rotated to the left and greatly enlarged. Marina Peninsula (his Kent Island) is placed more than 30km from its true position.
Austin's chart of Jones Sound

Inglefield's chart of Jones Sound

Since Inglefield did not land, his chart was based on a running survey carried out by measuring the bearings of prominent features such as headlands, either directly using an azimuth compass or by measuring the angles relative to features with known bearings. The ship would then run a fixed distance in a straight line and the observations repeated. The fixed distance formed the baseline for plotting the bearings and would be determined from the ship's speed as measured with the logline. The intersection of the bearings marked off from the two ends of the base line provided the position of the headland or feature. If bearings were measured by compass a correction for magnetic variation (declination) would be applied to obtain true bearings (Bowditch Reference Bowditch1837).
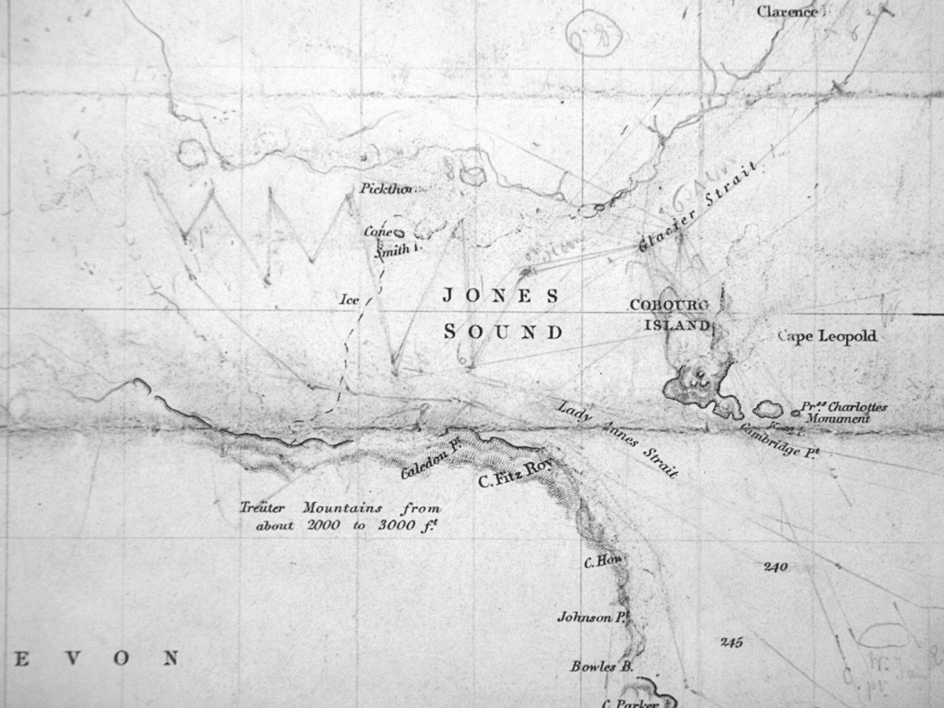
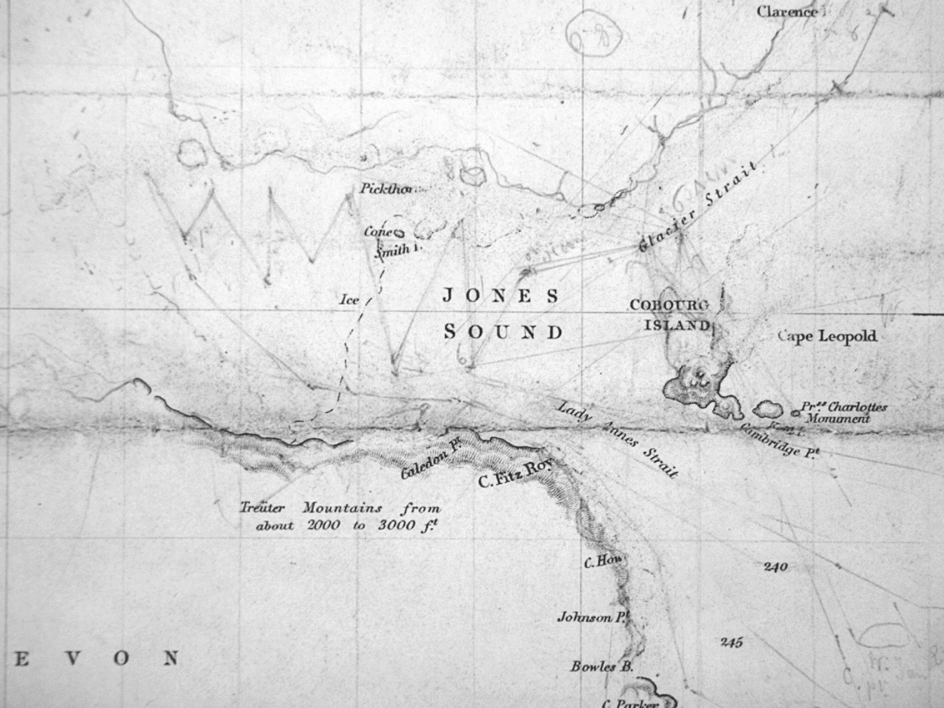
Evidence for the Isabel's estimated position on the morning of 31 August 1852 when Coburg Island was surveyed is obtained from the track charts, two versions of which exist. One (Hydrographic Office 1852) is a working chart heavily marked-up (presumably by Inglefield himself) with courses, survey lines, and full of corrections and changes. Being the chart taken on the voyage it includes Austin's mapping of the entrance to Jones Sound. The second track chart (Hydrographic Office 1853) is the finalised version showing Inglefield's mapping and on which Fig. 2 is based.
Part of the working chart showing the entrance to Jones Sound is shown in Fig. 3. Although difficult to read a number of important observations can be made. The upper part of Austin's Coburg Island has been partially erased and replaced by several alternatives in new locations. Two positions in Glacier Strait in the morning of 31 August are marked from which survey lines are drawn. Lines are drawn to Princess Charlotte Monument and Kent Island implying these were visible at the time and had not been obscured by Phillips Point as the ship moved west. From the morning positions the course continues straight until the noon position following which the ship begins to tack. The track shows Cone/Smith Islands being approached directly from the south. The furthest west shown by the track on this chart is 83° 49’ W.
Inglefield's working track chart (from the UK Hydrographic Office)
During the morning of 31 August when Coburg Island was surveyed, conditions were nearly calm, the sky blue, and visibility good. It clouded over during the day and became misty. Towards noon light variable wind arose permitting the ship to tack under sail. Winds increased to a stiff breeze out of the sound during the night and on the 1 September misty conditions, squalls, and snow were experienced and the ship had much difficulty plying through drifting ice 25 to 30 feet thick.
Analysis of Inglefield's Coburg Island chart
The accuracy of a running survey depends very much on the length and position of the baseline. An overestimate of the length results in the feature being placed too far away. Accurate baseline length requires accurate measurement of the ship's speed and would be particularly prone to error if there were a significant current. Errors in measuring angles between prominent features, a simple process, are likely to be small but errors in true bearings could result from poor corrections for magnetic variation and deviation being applied to compass bearings or from an incorrect reference bearing due, for example, to an error in position. Errors in true bearings result in a feature such as an island being rotated. It is apparent that such errors have occurred in Inglefield's survey.
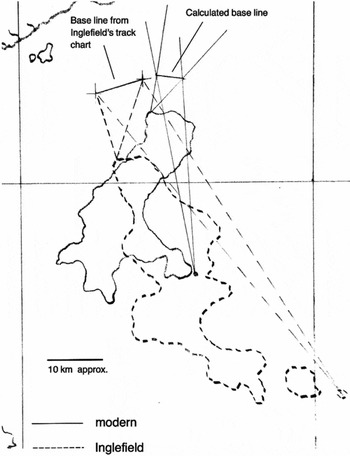
To put this on a more quantitative basis, an analysis of Inglefield's chart of Coburg Island has been carried out using a procedure that essentially reverses the survey process. From a pair of identifiable headlands on his chart at opposite ends of the island lines were drawn to two points defining the assumed baseline in Glacier Strait taken from his working chart. The bearings of these lines were measured. These angles were then adjusted by an amount required to align the two features on Inglefield's chart with those on the modern map. Lines were then constructed at these angles from the corresponding headlands on the modern map and the points of intersection determined. The two points of intersection thus defined the ‘true’ position and length of a baseline from which observations of Coburg Island would produce Inglefield's chart when subjected to his errors. A typical example is shown in Fig. 4.
Example of construction to determine Inglefield's true position in Glacier Strait (using “North Cape” and Princess Charlotte Monument).

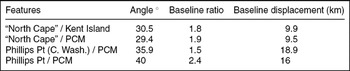
A difficulty with this method is being certain of which features on Inglefield's chart correspond to those on the modern map. There is no ambiguity with Princess Charlotte Monument (PCM), Marina Peninsula (his Kent Island) or the northernmost tip (called here ‘North Cape’) but there is less certainty about which of his features on the east coast corresponds to Phillips Point. It may well correspond to his Phillips Point but it is possible that it corresponds to his Cape Washington (Great Britain 1852B). The calculations were therefore carried out with four pairs of features and the results are presented in Table 1. The Table shows the angle required to align each pair of features with the modern map, the ratio of the assumed baseline length to the corresponding true length, and the distance between the midpoint of the assumed baseline and that of the true baseline.
Summary of results for various pairs of features

The results show that to align features on Inglefield's map with those on the modern map a clockwise rotation in the range 30° to 40° is required depending on the choice of features. In all cases the length of the assumed baseline is considerably longer than that of the calculated baselines and the assumed baseline is displaced well to the west of that calculated. It is therefore concluded that Inglefield's incorrect chart of Coburg Island resulted from three main errors: 1) an error in position that assumed he was further west along Glacier Strait than he really was, 2) an error in determining true bearings, and 3) an overestimate of the ship's speed during the survey. Some of these errors are related to each other.
Discussion
There are many possible sources of these errors. First, consider the problem of position. During a voyage the estimated position was plotted (usually every two hours) on a chart based on course and speed measured with the logline, that is by dead reckoning. Where possible the position would be corrected by measuring the true latitude and longitude by astronomical observation or from the bearings of known features if an accurate chart was available. Latitude was always relatively easy to determine simply by measuring the altitude of the sun at its highest point at noon at the end of the nautical day. With higher latitudes this measurement becomes more accurate as the altitude changes little with time. Although errors can arise because of difficulties in seeing the horizon, there is no reason to doubt most of Inglefield's latitude measurements, including his furthest north of 78° 28’ achieved on 27 August 1852.
Longitude determinations were more difficult and involved either the lunar distance method under which the angular distance between the moon and another celestial body (usually the sun) was measured or by using the chronometer, the more common method. By this Greenwich time from the chronometer was compared to local time determined from observation of the sun in the late afternoon when it was rapidly dropping. Such an observation, however, becomes increasingly inaccurate at higher latitudes. It is not known how often Inglefield determined longitude by chronometer but comparing his chart of Smith Sound with the modern one shows his longitudes are in error by up to 3°, a very large error as Wright has noted (Wright Reference Wright1940). Naturally, measurements of longitudes were also subject to errors in the chronometer itself.
In this context it should be noted that estimating the time at which the sun reached its highest point was not sufficiently accurate. If the ship was stationary times in the morning and afternoon at which the sun's altitude was the same could be observed and the difference divided by two to give the local noon. The preferred method, however, was to take an altitude measurement of the sun in the afternoon or morning when dropping or rising rapidly then use tables in the Nautical Almanac to find the time. As an example Inglefield reports (Inglefield Reference Inglefield1853: 57) ‘. . .and my sights at nine supplied a tolerable longitude.’ The methods are detailed in Bowditch (Reference Bowditch1837).
When Inglefield reached his claimed position of 84°W at ‘Sir Robert Inglis Peak’ on 1 September he had difficulty determining his position by observation. In fact he admitted that his observations at noon were ‘indifferent’ because of difficulty in seeing a clear horizon. Determining local noon accurately would have been impossible, and since fog rolled in around 2pm and Isabel departed the area, there could be no observations made later in the day. Thus Inglefield could not have made a longitude determination by chronometer. Whether he attempted chronometer determinations of longitude while in Glacier Strait is not known.
It is also worth noting that in 1852 at 76°N latitude there was no moon from 22 to 29 August. On 1 September the moon rose after 10pm (approximate local time) just after sunset and Inglefield had already left his furthest west point. Thus the lunar method could not have been used for any longitude determination in Glacier Strait or at ‘Sir Robert Inglis Peak’ (U.S. Navy 2011). The conclusion is, therefore, that Inglefield's longitude of 84°W and likely other positions in Glacier Strait and Jones Sound were not based on observation but on dead reckoning. In addition, Inglefield did not have the ability to correct his position by observation of well known prominent features as he came from the north along the poorly charted coast of Ellesmere Island. Austin, on the other hand, approached Jones Sound from well-charted Lancaster Sound. Without corrections from observation dead reckoning results in an accumulating error in longitude from errors in course direction and speed.
The second error concerns the determination of true bearings. The bearings of the various headlands on Coburg Island may have been measured with an azimuth compass and then corrected for variation or the angles between the headlands may have been simply measured (for example with a sextant) with some known feature used as a reference. The use of the magnetic compass in these Arctic regions was unreliable because the decreasing horizontal component and increasing vertical component of the magnetic field hinders rotation of the compass. In Lancaster Sound Inglefield acknowledged that the compass was useless (Inglefield Reference Inglefield1853). Magnetic variation changed as ships sailed north in Baffin Bay and Inglefield re-measured variation while near Cape York. What value he used as he approached Jones Sound is not known, but an error in variation does not appear to account for true bearing errors of 30° to 40°.
Magnetic deviation (distortion of the magnetic field due to the ship itself and its contents) was measured at Greenhithe before Isabel departed. As deviation depends on the orientation of the vessel, the ship was swung through 360° and during the voyage Inglefield adjusted the deviation in an attempt to account for latitude. Deviation was measured again on the return journey at Hunde Islands and found to be significantly different. During most of the voyage in the northern regions, therefore, Inglefield would not have had a good idea of the deviation. Since deviation only applied to the ship's compasses and not to handheld instruments like the azimuth compass, the most likely result of compass problems would be errors in course and dead reckoning position.
If Inglefield did not use a compass for the Coburg Island survey but simply selected a feature as a reference then the error in position itself introduced the true bearing error. The fact that lines are drawn on the working chart from the observation position to Kent Island and Princess Charlotte Monument strongly suggest this.
The third error of Inglefield's was in estimating speed. Since speed was measured with a logline, the values are relative to the water and must therefore be adjusted for any current. The survey of Coburg Island was done while the Isabel was progressing slowly under steam after entering Glacier Strait at 4am on 31 August. Light winds did not pick up until noon. Because the vessel under steam progressed in a straight line, it provided the best opportunity for the running survey, but Inglefield reported a strong opposing current that he estimated was almost 2 miles per hour (3.2 km/h), and the ship made not much more than 3 knots (5.5 km/h). The speed of the current was only an estimate and this could provide a major source of error in the ship's speed. The strong current could also introduce an error in course direction.
Regardless of the exact sources of Inglefield's errors they had significant consequences. His reported position at noon on 31 August was 76° 10’N, 80° 30’W, well to the west of Stewart Islands. On sailing further west the only distinctive features on the existing chart were Smith and Cone Islands that he reported passing. Correcting, however, for his initial position in the morning of 31 August by 9km and reducing his speed by 40% according to the present analysis places his noon position well to the east of Stewart Islands. This strongly suggests that he mistook Stewart Islands for Smith and Cone Islands and took his dead reckoning position from the position of Smith and Cone Islands charted by Austin. Such a mistake is understandable as both island groups comprise a large island with a smaller cone shaped island to the west. Inglefield's chart simply reproduces Austin's longitude and shape of Smith and Cone Islands (moved somewhat to the north) indicating there was no new survey of them. Interestingly, although he claimed he was assiduously examining every detail of the coast for evidence of cairns, Inglefield made no mention of the cairn erected by the Austin party on Cone Island the previous year (Osborn Reference Osborn1854). Having passed Stewart Islands Inglefield would, assuming reduced speed, arrive at Smith and Cone Islands by noon on 1 September. It is concluded that his ‘extraordinary shaped’ Sir Robert Inglis Peak was, in fact, Cone Island. Thus the evidence from Inglefield's own survey and chart of Coburg Island indicates that he reached no further west into Jones Sound than Austin did the year before.
After Austin returned in 1851 his new discoveries, including his quite accurate survey of the entrance to Jones Sound, were included in the map published in 1852 by the London mapmaker Arrowsmith. Within a few months this was edited to include Inglefield's discoveries including his claimed penetration of Jones Sound to 84°W. Interestingly in this rapidly edited edition Arrowsmith did not change Austin's map of Coburg Island (Hayes Reference Hayes2003). Soon after, however, the Inglefield map was adopted complete with his distorted Coburg Island, and this became the standard accepted map. There was no further mapping of Jones Sound until Sverdrup surveyed the south coast of Ellesmere Island during his 1898–1902 Arctic expedition. Sverdrup entered the sound by Lady Ann Strait (south of Coburg Island) and headed for Sir Robert Inglis Peak but failed to find it. Whether he had any suspicions over Inglefield's chart he did not reveal them but simply reported he did not find the peak and stated ‘to this day I have never been able to make out what had become of it’ (Sverdrup Reference Sverdrup1904: 218). Sverdrup did not survey Coburg Island and Inglefield's ‘tipped over’ Coburg Island was not corrected until the 1930's (Wright Reference Wright1940).
An important question arises as to why Inglefield's chart was accepted so readily. Why was the chart of Austin's large navy expedition, equipped for accurate scientific work, so quickly rejected in favour of Inglefield's one-man effort (Lambert, Reference Lambert2009: 198–199) Such a question is open to wide speculation and will not be discussed here, but it is clear that the ready acceptance of Inglefield's claims set back the accurate mapping of an important part of the Arctic for over three quarters of a century.