

3.1 Human Development and Health
Malaysia’s health development has been part of the wider process of human and other socio-economic progression. This chapter provides the broader context to the Malaysian health system through a brief analysis of socio-economic development and its impact on health risks and conditions. There were also associated health improvements that in turn fostered human development. This analysis provides a macro and concise framework for the more detailed examination in other chapters of the development of the Malaysian health system in terms of its service delivery, related inputs and more detailed outcomes.
Malaysians have made noteworthy socio-economic progress since the country’s independence in 1957, in view of the advantages and challenges of their physical and equatorial environment. As a result of these efforts, Malaysia is now among the countries that have achieved very high human development according to the United Nations Development Programme (UNDP), based on attained life expectancy, education and income per capita (United Nations Development Programme, 2018). Malaysia is also among the group of high- to middle-income countries with a gross national income per capita of $26,190 in 2015 (purchasing power parities, 2015), compared with the substantially lower average of $15,627 for countries in the same income group (World Bank, 2017), and is on the pathway to joining the high-income group of nations.
Malaysia is a good example of a comprehensive approach to development. Since independence, government policies have been progressively articulated in five-year development plans in a holistic manner that deals not only with the economic elements but also other social elements of human development, including health. Thus health interventions are planned and implemented in the context of a range of complementary activities in socio-economic development. They reflect priorities set across the board, including labour force and financial resource constraints, and the steps taken to address them. Therefore, it is essential to examine health advances in conjunction with concurrent socio-economic development that affects the way people live and where, and what they do, with an impact on social organisation, as well as geographical and financial factors that have a bearing on relative access to health services and living conditions.
The progress made in human development in Malaysia has been substantial in terms of the three measures used by the UNDP in its index of human development: life expectancy, education and gross domestic product (GDP) per capita. Using 1970 as a basis, life expectancy had increased by 11 years to 75.6 years in 2015, secondary education enrolment more than doubled to 85%, and GDP per capita increased by more than five times to 35,100 Malaysian Ringgit (Table 3.1).
| Year | Human development measures | ||
|---|---|---|---|
| Life expectancy (years)1 | Education: secondary school enrolment (%)2 | GDP per capita constant prices (MYR 000s)3 | |
| 1970 | 64.4 | 39.2 | 6.2 |
| 2015 | 75.1 | 85.0 | 35.1 |
| 2015/1970 | 1.17 | 2.17 | 5.66 |
1 The average number of years lived from birth.
2 The percentage of children of relevant age attending secondary school.
3 The average gross domestic product (GDP) per capita at constant prices in thousand Malaysian Ringgit (MYR).
Three major phases can be identified in human development since independence. Their expression in health development is as follows:
The first phase, during the 1960s and 1970s, emphasised rural development and capacity building of the health system.
The second phase, in the 1980s and 1990s, was one of consolidating socio-economic transformation and the health system, from a rural setting to rising employment in secondary industries, urbanisation with migration from rural to urban centres and growing health system capacity.
The third phase, in the 2000s and 2010s, has the characteristics of a more developed socio-economic configuration, with growing urbanisation and sustained employment in manufacturing but a larger proportion of people employed in services. Conditions have continued to improve, but growing affluence and more sedentary occupational and recreational activities have led to lifestyles that compromise the rate of health enhancements.
Health status has been closely associated with poverty, and in turn, health services provision has contributed to poverty alleviation (Reference Hammer, Nabi, Cercone, van de Walle and NeadHammer et al., 1995). In addition to socio-economic factors in development during the above three phases, four variables will be used in the analysis to examine the evolution that affected health status in Malaysia: poverty prevalence for social and economic security affecting health status; urban/rural residence for the manner of social organisation and geographical access to health services; rate of safe deliveries for access to and coverage by basic health services; and infant mortality rates as a marker of health status in a relatively young society, even today.1
3.2 Reaching the Poor in Rural Malaysia and Increasing Capacity (1960s and 1970s)
At independence in 1957, about three-quarters of Malaysians lived in rural areas (74%), and close to half of the labour force worked in agriculture (47%), mostly in rubber plantations and rice cultivation. The unemployment rate was estimated at 13%, but it was posited that there was considerable additional disguised unemployment (Reference Fernandez, Hawley and PredezaFernandez et al., 1975; Reference JonesJones, n.d.; Supplementary Table 3.J). Poverty was pervasive, with 51% living below the poverty line on average and 60% living in rural areas (Reference RoslanRoslan, 2001; Supplementary Table 3.D). This was associated with a high population growth rate (almost 3% per year) driven by a high fertility rate of more than 5 live births per woman, which led to a large proportion of the population being under 15 years of age (44%) and a dependency rate of 82% on the working-age population but a relatively low proportion of people aged 65 years and over (3%). However, the high rate of infant mortality (75/1,000 live births) contributed to low life expectancy at birth of only 57 years at that time (Reference Fernandez, Hawley and PredezaFernandez et al., 1975; Supplementary Tables 3.E, 3.H and 3.I). In addition, poor health due to the high incidence of malaria, tuberculosis and other communicable diseases (Reference RoemerRoemer, 1976) affected the productivity of human capital. There is also evidence of malnutrition in children from poor rural areas (Reference McKay, Lim, Notaney and DugdaleMcKay et al., 1971; Reference Chong, Tee, Ng, Kandiah, Hussein, Teo and ShahidChong et al., 1984). The low level of education was another dimension of the quality of human capital: in 1957, more than half the population aged over 14 years (53%) were illiterate in any language (Ministry of Education Malaysia, 1967), with implications for female fertility and maternal and child health associated with the level of education of women.
Few doctors and nurses were concentrated in urban centres in relation to the population (Supplementary Tables 3.K and 3.L) to address the large burden of disease and mortality. There was significant reliance on traditional healers, with services provided by bomohs (healers) and kampong bidans (village midwives) in the Malay tradition. Sinsehs (Chinese physicians) provided herbs and other traditional Chinese medicines, supplemented on occasion by Western-type medicines. There were also a few Ayurvedic practitioners from India. It was not uncommon for care to be sought interchangeably regardless of ethnicity. Although there were reservations about the effectiveness of traditional practices, the household expenditure survey for 1957/1958 indicated that households spent almost as much on traditional medicines with a lower price as they did on more costly Western ones (Reference RoemerRoemer, 1976).
It was in this context that various Malaya and Malaysian2 plans were formulated to address both economic and social development during this first phase. Rural development became a major policy objective in the 1950s and 1960s to address the productivity, income and living conditions of most people in Malaysia. Government development expenditure rose from 3.6% of the GDP in 1956–1960 to 6.8% in 1966–1970 and government revenue from the export of oil rose to 12.6% of the GDP in 1976–1980 (Reference Lee and Chew-GingLee & Chew-Ging, 2017). During 1956–1980, about a third of development expenditure was for infrastructure such as roads, power and communication that enhanced rural and regional transport and communication, and about one-quarter was for agriculture to improve productivity and the income of poor rural populations engaged in rice cultivation, reforming rubber plantations and developing palm oil cultivation in small holdings with improved productivity. A substantial development expenditure that included security (due in part to internal emergency and confrontation with Indonesia over the sovereignty of Sabah and Sarawak) absorbed some 16% of the total government development expenditure during this period. Development expenditure on education and health (which tends to be less than that on security, transport and public works) amounted respectively to about 8% and 2% of the total during this period (Reference PeacockPeacock, 1981; Reference FongFong, 1985; Reference Aslam and HassanAslam & Hassan, 2003).
The importance of health services reaching the poor in rural areas was expressed in the priority given to the following complementary activities (Reference Suleiman and JegathesanSuleiman & Jegathesan, n.d.):
Training of health personnel and recruitment in rural areas.
Provision of rural health services, including safe water and sanitation.
Prevention and management of communicable diseases.
Improved hospital capacity to support primary care.
Family planning and nutrition supplementation.
This reflected the considerable regional differences in infant mortality that prevailed through the 1960s and 1970s, which were associated with the proportion of people living in rural areas and with levels of household poverty. Accordingly, the state of Terengganu, with 68% of households living in poverty and 73% of its population in rural areas, had an infant mortality rate of 54 per 1,000 live births; Selangor, including Kuala Lumpur (Malaysia’s large urban capital), had a lower proportion of rural population (55%), a lower level of poverty (43%) and a substantially lower infant mortality rate of 30 per 1,000 live births (Reference HasanHasan, 1986).
The efforts made to improve economic productivity resulted in an average GDP annual growth rate of 7.1% in the 20-year period of 1960–1980. However, the large population growth reduced it to a still-helpful rate of 3.7% per head of population (Supplementary Tables 3.A and 3.E). Even though primary industries continued to constitute a large proportion of the GDP (31%) in 1980, the proportion of secondary production almost doubled to 25% of the GDP, with little change in the proportion of services (44%) (Supplementary Table 3.B). Employment saw a substantial decline in the proportion of the population employed in primary industries, mostly in rural areas, from 50% to 39% during the 20-year period and an increase in the proportion of those employed in services from 30% to 40% (Supplementary Table 3.C). Although the majority of the population continued to live in rural areas, greater urbanisation took place, and the proportion of the population living in urban areas increased from 26% in 1960 to 42% in 1980 (Supplementary Table 3.J), with consequences for the mode of living, type of work and conditions and relative ease of access to health services. Further, substantial gains were made in education. By 1967, enrolment among children of relevant age in primary education had risen to 94% and to 52% in lower secondary education, with considerable progress in the education levels of women (Ministry of Education Malaysia, 1967), which is associated with fertility and maternal and child health (Reference HasanHasan, 1986). This was coupled with the increase in the female labour force participation rate from 37% in 1970 to 44% in 1980 and the observed substantial decline in fertility, which was also enhanced by the family planning programme in 1965 (Reference Fernandez, Hawley and PredezaFernandez et al., 1975; World Bank, 2019d; Supplementary Table 3.G).
Development in terms of personnel and rural health facilities made substantial progress during this phase. The number of people per nurse declined about four-fold and that per doctor declined by about half during the 20-year period of 1960–1980 (Supplementary Tables 3.K and 3.L; Chapter 8). Public hospital services were upgraded without an increase in the number of beds per head of population, but their use rose by 43% during the same period (Chapter 5). The proportion of the population served by sewerage rose by about 89% and that with access to safe water increased by about 82% in the 10-year period 1970–1980 (World Bank, n.d.; Chapter 7). The impact on health of the various preventive and management interventions is illustrated by the 29% decline in the incidence of malaria and 96% decrease in the incidence rate of diphtheria in the 4-year period of 1976–1980 (Chapter 6). This progress was achieved with a relatively low total health expenditure. Estimates for 1973 indicated that total health expenditure amounted to only about 2% of the GDP, and that 65% of it was spent in the public sector (Reference RoemerRoemer, 1985; Chapter 8).
During 1960–1980, socio-economic development and changed employment opportunities increased the proportion of the urban population from 26% to 42% in 1980, and poverty levels declined from 49% in 1970 to 37% in 1980. Easier access to health services and increased service provision in rural areas led to greater health services coverage. In Peninsular Malaysia, safe deliveries by professionally trained health personnel rose from 41% to 85% during this 20-year period; as a proxy measure of health improvement in a young population, the infant mortality rate declined by more than half from 69 per 1,000 live births in 1960 to 24 in 1980 (Table 3.2). Life expectancy at birth rose by 8 years to 68 years in that period (Supplementary Table 3.G).
3.3 Transition and Consolidation (1980s and 1990s)
The core development objectives in the 1980s and 1990s were the eradication of poverty, the re-structuring of society and more balanced regional development (Prime Minister’s Department, 1989). The related health policy goals set out in the Fourth to Seventh Malaysia Development Plans were (Reference Suleiman and JegathesanSuleiman & Jegathesan, n.d.):
Training of health personnel and their engagement to serve the growing population and a better mix of human resources to provide needed services.
Reduction in the disparity of health status among different population groups and areas.
Control of preventable infectious diseases.
Promotion of healthy living environment.
Collaboration in health promotion between the public and private sectors and among agencies.
Improvement in productivity and quality of services.
A major transition took place in Malaysia during these two decades. The population almost doubled from about 14 million to 23 million (Supplementary Table 3.E) in spite of a decline in the average fertility from four to three children per woman (Supplementary Table 3.G). Consequently, the proportion of children aged under 15 years decreased, with a compensating increase in the proportion of working-age people (15–64 years), which reduced child dependency on working-age people from about 70% to 53%, but the proportion of older people aged over 64 years remained low at 4% (Supplementary Tables 3.H and 3.I). The growth in working-age people was accompanied by a major shift in economic activity from agriculture to manufacturing and related employment. Accordingly, employment in primary industries, mostly agriculture, declined from 39% in 1980 to 16% in 2000, and the proportion of people employed in secondary industries (manufacturing and construction) rose from 21% to 36% (Supplementary Table 3.C). The economic transformation provided a wider range of employment opportunities, and the unemployment rate, which had risen to 8% in 1987 (Department of Statistics Malaysia, 1989), fell to 3% in 2000 (Department of Statistics Malaysia, 2001a). Income rose faster than the large growth in population and led to a substantial increase in GDP per head of population at an average annual rate of 3.7% during that period (Supplementary Table 3.A).
However, the rate of progress was upset by the oil crisis in 1979, which affected government revenue and led to fiscal constraints in the 1980s and an economic recession in 1985–1986. Government development expenditure that was still substantially high at 11% of the GDP in 1981–1985 dropped to 6% by 1996–2000 (Reference Lee and Chew-GingLee & Chew-Ging, 2017). As the emphasis on development moved to manufacturing, government development expenditure on agriculture was reduced by about half to 12% of the total in 1981–2000, while investments in infrastructure for roads, communication and power generation continued to receive about one-third (34%) of the total, and investments in industry increased somewhat from 14% to 17%. Government recognition of the importance of the continual improvement of human capital for both economic and social purposes was shown in the rise of development expenditure on education from 8% to 12% and that on health from 2% to 3% (Reference Aslam and HassanAslam & Hassan, 2003). Primary education enrolments became almost universal (97%); secondary school enrolments rose to 65% and that in tertiary education to 26%, with female enrolments, of particular importance to health, being at least on a par with that of men (United Nations Educational, Scientific and Cultural Organization, 2011).
Another aspect of the socio-economic transformation was internal migration to urban areas with employment opportunities. A study carried out in 1989–1990 (Department of Statistics Malaysia, n.d.) indicated that the more rural states lost some of their population due to internal migration, while the more industrialised states gained population that way. As might be expected, internal migrants, both male and female, were younger, and with a higher level of secondary and tertiary education. The majority were Malays from rural areas. By 2000, most people lived in urban areas (Supplementary Table 3.J).
These major socio-economic shifts involved a number of inter-related features that affected population composition and altered health risks. The larger urban population employed in manufacturing and services and the greater participation of better-educated women in the labour force were associated with lower fertility and a rise in the proportion of people of working age, with lower levels of unemployment, higher household income and less poverty. However, occupations required less physical activity, while food intake was enhanced by higher household income and less poverty. As the socio-economic transformation took hold, demographic and epidemiological transitions took place. The epidemiological transition was expressed in terms of a decline in the burden of disease from infectious diseases because of the success of related health interventions, but non-communicable diseases increased with occupational and leisure activities and greater affluence, with an effect on health risks, health conditions and mortality (Table 3.3).
| Cause of death | Age-specific death rates Percentage change for 1982–1990 in age group (years) | ||||||
|---|---|---|---|---|---|---|---|
| <1 | 1–14 | 15–29 | 30–44 | 45–59 | 60–64 | >64 | |
|
|
|
|
|
|
| |
| Old age (aged over 64 years) | −2.7 | ||||||
| All causes | −36.3 | −37.4 | −14.9 | −8.8 | −11.3 | −17.7 | −2.7 |
Access to medical services improved during the two decades of 1980–2000 as the number of people per doctor declined by more than half (Supplementary Table 3.K; Chapter 8). The number of nurses and midwives rose in relation to the population, but the number of assistant nurses declined (Supplementary Table 3.L; Chapter 8). Vaccination of infants for a range of communicable diseases reached over 90% coverage in most cases (Chapter 4). Rural household sanitation rose to 98% and access to safe water to 94% (Ministry of Health Malaysia, 2002; Chapter 7). The rise in urbanisation and higher household incomes made access to private health services easier. This was associated with an increase in the proportion of doctors in the private sector (46%) (Ministry of Health Malaysia, 2002) and almost double the number of people employed in private hospitals and maternity homes (Department of Statistics Malaysia, 2001b). This meant that the rate of both outpatient visits and inpatient admissions to public hospitals per head of population either stayed about the same or declined slightly (Ministry of Health Malaysia, 1992; 2002). The transition is reflected in the estimated proportion of visits to doctors that might have been about equal between the public and private sectors in the 1980s but might have been higher in the private sector in the 1990s (Health Policy Research Associates et al., 2013). The rising use of the private sector had an impact on the level of health expenditure in relation to the GDP. A study of health financing indicated that total health expenditure in 1983 amounted to 2.8% of the GDP and that 76% was related to services provided by the public sector (Westinghouse Health Systems, 1985), while estimates for 2000 show that total health expenditure was 3.3% of the GDP and that 54% was financed by the public sector (Ministry of Health Malaysia, 2017; Chapter 8). This indicates that the rise in total health expenditure in relation to the GDP in that period might have been mostly from the growth in the private sector.
The socio-economic transformation during 1980–2000, with increasing employment opportunities and migration to urban areas, resulted in most people living in urban areas. It also led to a dramatic drop in the proportion of households living in poverty, from 37% in 1980 to 9% in 2000. Empirical evidence shows that, in addition to its direct impact on health status, the provision of health services by the public sector had considerable distributional effects on alleviating poverty in Malaysia (Reference Hammer, Nabi, Cercone, van de Walle and NeadHammer et al., 1995). Greater coverage of and access to healthcare was facilitated by urbanisation and services rendered by both the public and private sector and the greater use of preventive and other services in the public sector. This was reflected in the increase in the proportion of safe deliveries by health professionals to 97% in 2000. Infant mortality at 7 per 1,000 live births in 2000 had declined to about one-third of that in 1980 (Table 3.4); life expectancy continued to rise by 5 years to 73 years in 2000 (Supplementary Table 3.G).
| Year | Households in poverty (%) | Urban population (%) | Safe deliveries1 (%) | Infant mortality rate2 |
|---|---|---|---|---|
|
|
|
|
|
| −28.9 | +20.0 | +11.2 | −17.0 |
1 Those performed by professionally trained health personnel.
2 The ratio of the number of deaths of those aged under 1 year per 1,000 live births.
3 Peninsular Malaysia.
4 The poverty rate is for 1999.
Progress was also made in narrowing the differences between regions, although the differences prevailed. Kelantan, with a high proportion of its population living in rural areas (66%), had the highest infant mortality rate in Peninsular Malaysia, being about twice that of Selangor in 2000 (Table 3.5). However, the difference had been almost three times higher in 1980 (Suleiman & Jegathesan, n.d.).
| State | Infant mortality rate1 | Households in poverty (%) | Rural population (%) | |||
|---|---|---|---|---|---|---|
| 20002 | Change 19803 | 19992 | Change 19803 | 20002 | Change 19803 | |
|
|
|
|
|
| |
|
|
|
| |||
| Malaysia | 6.8 | −17.0 | 7.5 | −34.9 | 38.0 | −27.8 |
1 The ratio of deaths of those aged under 1 year per 1,000 live births for 2000.
2 The infant mortality rate and percentage of rural population are for 2000 whereas the percentage of households in poverty is for 1999.
3 Represents the change in the rate from 1980 to 2000 or from 1980 to 1999.
4 Changes for Selangor and Kuala Lumpur could not be estimated because of aggregation of the two in 1980.
5 Labuan was aggregated with Sabah for 1980 and 1999.
6 Birth and infant mortality recorded, especially in Sabah, were of questionable reliability.
3.4 Health in a More Affluent and Urban Society (2000s and 2010s)
The steered socio-economic transformation of Malaysia has led to a more affluent and increasingly urban society. Globalisation of the economy is nothing new to Malaysians. At independence, Malaysia was substantially dependent on rubber and tin production for global markets. Its economy evolved as global markets for different commodities changed to the production of palm oil and crude oil and the manufacture of electronic components and products, again mostly for global markets. Thus Malaysia felt the effects of both the Asian financial crisis in the late 1990s and the impact of the global financial crisis in the mid-2000s. Economic growth that faltered in the late 1990s to the mid-2000s regained its strength after 2010, and the GDP per head of population grew at an annual rate of 3.5% in 2010–2017 compared with 2.6% in 2000–2010 (Supplementary Table 3.A).
The Malaysian economy has the features of more developed countries, with a decline in the proportion of the GDP from primary industries, a continuing large contribution from secondary industries and more than half of total production from services (Reference Martins, Guo and SwansonMartins et al., 2018), with similar employment patterns. By 2017, 62% of people employed worked in services, 26% worked in manufacturing and construction and 12% worked in primary industries, mostly in agriculture (Supplementary Tables 3.B and 3.C). The larger proportion of employment in secondary and tertiary industries and the decline in agriculture were associated with the growth of urbanisation to 75% in 2017 (Supplementary Table 3.J).
The importance of training and education to economic activity is reflected in the high level of education of people employed in 2016: no formal education, 3%; primary education, 15%; secondary education, 55%; and tertiary education, 27% (Department of Statistics Malaysia, 2017a). In 2017, the net enrolment of people of relevant age in primary education was 99% (female, 99%); secondary education, 75% (female, 78%); and tertiary education, 75% (female, 78%) (Ministry of Education, 2018). The labour force participation rate of working-age people increased to 68% in 2017, with female participation rising to 55% (Department of Statistics Malaysia, 2017a; 2018a). The unemployment rate rose only slightly from 3.1% in 2000 to 3.4% in 2017 (Department of Statistics Malaysia, 2003b; 2018a).
The greater urbanisation, higher education levels and greater female participation in the labour force were associated with a substantial fall in fertility from above replacement level (2.8 children per woman) in 2000 to below replacement level (1.9 children per woman) in 2017. Population growth continued to be high due to the large proportion of young people of reproductive age, but the rate of growth was reduced by half from an annual average of 2.6% in 2000 to 1.3% in 2017 (Supplementary Table 3.E). A feature of this continuing population growth was the increase in the proportion of people other than those identified as ethnic Bumiputra, Chinese or Indian3 from less than 1% (0.5%) of the population in 1980 to 11% in 2017, which indicated a substantial growth in immigration (Supplementary Table 3.F).
The decline in fertility led to a demographic bonus in terms of the rise in the proportion of working-age people from 63% in 2000 to 70% in 2017 and a more productive young population. In the same period, the proportion of children dropped from 33% to a still-high percentage of 24%, while the proportion of older people increased somewhat from 4% to 6% (Supplementary Table 3.H). This meant a fall in the child dependency rate on the working population from 53% in 2000 to 35%, and old age dependency rose from 6% to a still-low 9% during the same period (Supplementary Table 3.I).
Among other priorities, health priorities identified in the three Malaysia Plans covering 2001–2015 were concerned with (Economic Planning Unit, 2001; Ministry of Health Malaysia, n.d.):
Improving accessibility to affordable and quality care and addressing inequalities.
Expanding wellness programmes aimed at improving quality of life.
Promoting co-ordination and collaboration between the public and private providers of healthcare.
Addressing efficiency issues in healthcare delivery.
Strengthening regulatory and enforcement function to administer the health sector.
The concern with human resources in the provision of health services was met by a substantial increase in the availability of the two major professional resources. The number of people per doctor was about halved from 2000 to 632 in 2016 (Supplementary Table 3.K), and the number of people per nurse more than halved to 308 (Supplementary Table 3.L). By 2016, an increasing proportion of the larger number of doctors were in the public sector (65% in 2015), and even more so in the case of nurses (76% in 2015) (Ministry of Health Malaysia, 2018a; Chapter 8).
Prevention of infectious diseases remained a major objective, and child vaccination coverage continued to be high (Ministry of Health Malaysia, 2018a; Chapter 4). The same was true for access to safe water and sanitation, and the incidence of malaria continued to be low (Ministry of Health Malaysia, 2018a; Chapters 6 and 7). Another achievement was the eradication of polio. However, the incidence of dengue, often associated with growing urban centres, increased considerably, but better management of those affected resulted in a decline in case fatality rates. A major concern during this period was the threat of HIV/AIDS, which reached its incidence peak in 2002. Prevention efforts led to a fall in incidence by about half in 2016. However, HIV/AIDS affected efforts to control the incidence of tuberculosis, which increased to some extent (Ministry of Health Malaysia, 2018b; Chapters 4 and 6).
Urbanisation, sedentary occupations and greater affluence are associated with a rise in health risks related to non-communicable diseases, such as obesity (Ministry of Health Malaysia, 2018b). A study of diet, physical activity and smoking, which have an impact on health risks, such as diabetes, circulatory diseases and lung cancer, indicated that cultural differences resulted in varying behaviours among ethnic groups, and the authors proposed that a more culturally targeted approach was needed for these health risks. It is noteworthy that the study found that access to healthcare also made a difference (Reference Botobara-Yap, Razon-Estrada and BalilaBotabara-Yap et al., 2017). The increasing burden of non-communicable diseases was reflected in the increasing proportion of heart and cerebrovascular diseases from 18% to 21% of all deaths from 2001 to 2017 (Department of Statistics Malaysia, 2007; 2018b). It is also manifested in the prevalence of diabetes, which increased from 12% to 15% in the 5-year period from 2006 to 2011 (Ministry of Health Malaysia, 2013; Chapter 6).
Public hospital outpatient visits increased, but their number per head of population declined, and visits to other public health clinics rose (Ministry of Health Malaysia, 2018a; Chapters 4 and 5). Evidence from household surveys indicated that the number of visits to doctors in the private sector might have been larger than the number of visits to doctors in the public sector (Health Policy Research Associates et al., 2013). Nevertheless, public sector health services remained the highest provider of both preventive and medical care. The number of people employed in private hospitals continued to grow by more than two-fold in 1999–2015 (Department of Statistics Malaysia, 2001b; 2017b), and the use of private inpatient care increased. However, admissions to public hospitals also rose substantially (Ministry of Health Malaysia, 2002; 2018a; Chapter 5). Despite the rise in private sector provision, the public sector continued to be the largest provider of inpatient as well as preventive and ambulatory medical services. It has been estimated that the above-mentioned considerably higher proportion of both preventive and curative services supplied by the public sector was financed by the public sector at only 51% of total health expenditure in 2015. The private sector, with a considerably lower proportional provision, was financed by 49% of the total health expenditure (Ministry of Health Malaysia, 2017; Chapter 9). A possible implication of this, all other things being equal, would be a considerable rise in health expenditure as a proportion of the GDP (4.6% in 2015) if all health services provided were at the expenditure per unit of service prevailing in the private sector.
Continuing economic development and employment opportunities in secondary industries, but especially in services in urban areas, continued to fuel the growth in urbanisation, which rose from 62% in 2000 to 75% in 2016. It was also associated with high levels of employment that improved social and income security further, which helped to alleviate poverty and its associated health conditions. The household poverty rate declined from 8.5% to 0.4% in 2000–2016 (Table 3.6). Although the substantial decline in poverty is not questioned, the actual levels and methodology have been queried in more recent times in view of alternative estimates (Reference RavallionRavallion, 2019). Despite caveats regarding the measurement of poverty, it is apparent that poverty has continued to decline since 1999. Infant mortality was highest in Sabah, which had the highest rate of poverty and a large proportion of its population still living in rural areas, and was lowest in urban Kuala Lumpur, which had one of the lowest levels of poverty in Malaysia (Reference Nair and SagaranNair and Sagaran, 2015; Department of Statistics Malaysia, 2013; 2016a).
| Year | Households in poverty (%) | Urban population (%) | Safe deliveries1 (%) | Infant mortality rate2 |
|---|---|---|---|---|
|
|
|
| |
| −8.1 | +12.8 | +2.9 | −0.1 |
1 Those performed by professionally trained health personnel.
2 The ratio of the number of deaths of those aged under 1 year per 1,000 live births.
3 Poverty rate is for 1999.
4 Poverty rate is for 2009.
As a measure of essential health service coverage and provision in a still relatively young population, safe birth deliveries by professional personnel were almost universal (99.5%) by 2016. Although fertility declined substantially, the momentum from the high proportion of people of reproductive age kept the birth rate at 16 per 1,000 people. A reflection of the need to support the larger number of childbirths is that about a third of admissions (32%) to public hospitals, which provided the most obstetric care in 2015, were related to childbirth and related conditions (Department of Statistics Malaysia, 2017a).
In contrast to previous periods, the infant mortality rate did not improve to any significant extent, remaining at about 7 per 1,000 live births during 2000–2016 (Table 3.6). This lack of improvement was also observed for maternal mortality, which remained at around 24 per 100,000 live births during the same period (Ministry of Health Malaysia, 2018b). Although not reflected in formal records of infant mortality (Department of Statistics Malaysia, 2003a; 2016a), analysis of the location of the growing number of non-citizens (10% of the total population in 2017) (Department of Statistics Malaysia, 2017c) shows that states that experienced continued improvements in infant mortality, such as Kelantan, tended to have a lower proportion of non-citizens in the population, while those with a higher proportion, such as Johor, experienced either a standstill or a worsening (Department of Statistics Malaysia, 2003a; 2016a). This raises the question of potential inaccuracies in the registration of infant deaths of non-citizens.
Notwithstanding the stagnation in the recorded trend towards lower infant and maternal mortality, an achievement was the increase in life expectancy since 1999, in spite of the threat of HIV/AIDS and risks from more sedentary occupations and affluent lifestyles: life expectancy rose by more than 2 years between 1999 and 2017 (Table 3.7).
| Age (years) | Life expectancy (years) | Change in years 2017–1999 | ||||
|---|---|---|---|---|---|---|
| 1999 | 2017 | |||||
| Female | Male | Female | Male | Female | Male | |
|
|
|
|
|
|
|
The potential for further improvements in health status and life expectancy is suggested by studies of avoidable deaths (Ministry of Health Malaysia & Harvard T. H. Chan School of Public Health, 2016) and potential years of life lost due to premature mortality and disability (Institute of Public Health, 2017).
These studies point to the potential gains from improvements in occupations and lifestyles that affect mortality and disability from non-communicable diseases, as well as better identification and management. Injury from traffic accidents and other causes is another major area for potential gains. The importance of mental health is also apparent. The research also indicates the continuing importance of preventing and managing infectious diseases (Table 3.8).
| Cause/disease | DALY1 | YLL2 | YLD3 |
|---|---|---|---|
| Percentage of total | |||
|
|
|
|
| Other | 25.6 | 18.1 | 38.0 |
| All causes/diseases | 100.0 | 100.0 | 100.0 |
| Number of years lost | 4,993,000 | 3,099,000 | 1,894,000 |
1 The combined potential years of life lost from premature mortality and disability.
2 The number of potential years of life lost due to premature mortality.
3.5 Progress and Challenges
This chapter provides a concise and macro analysis that places salient features of health development in its socio-economic framework as a basis for the following chapters, which address the various components of the health system and their complementary contributions to health outcomes.
Health has been an integral and important part of Malaysia’s socio-economic and human development that has aimed at alleviating poverty, enriching human capital, improving living conditions and enhancing health status.
Strategies have been articulated in five-year development plans in which health development has played a vital role in conjunction with education, employment and living conditions. These strategies have evolved as the success of rural development has taken hold and economic development has provided employment opportunities in secondary industries, with growing urbanisation and an increase in related living conditions. The health system’s success in preventing and managing communicable diseases has led to an epidemiological transition that has improved health status but that has made it more dependent on the control of the non-communicable diseases characteristic of more developed, urban and affluent societies. Accordingly, progress has improved health, but it has also created new challenges to continued success in addressing the risks of infectious diseases while strategies and means of tackling the threats posed to wellbeing by the burden of non-communicable diseases are being developed.
3.6 Key Messages from Malaysia’s Experience
3.6.1 What Went Well?
The provision of healthcare can be an important factor not only for the improvement of health status but also for the quality of human capital, its productivity and the alleviation of poverty.
Poor people cannot afford to pay for health services; for them, services need to be free of charge.
Market mechanisms did not meet the health needs of most of the population, especially those in rural areas, and public intervention was required.
Social change, urbanisation and economic development alleviate some health problems but give rise to others.
3.6.2 What Did Not Go So Well?
Fragmentation of responsibility between various agencies significantly impacted health. Recognition and management of fragmentation varied.
The health system is constrained in its ability to deal with some politically charged issues, such as undocumented migrant groups.
3.6.3 Trends and Challenges?
The continued growth of the private health sector and rising health expenditure will be a challenge for the future development of healthcare.
4.1 Introduction
The term ‘primary health care’ (PHC) has been operationalised in a variety of ways since it was first coined as part of the historic Alma Ata Declaration (Box 4.1). In this chapter, we operationally define PHC to cover the ‘first level of contact of individuals, the family and community with the national health system’ and ‘reflect(s) and evolve(s) from the economic conditions and sociocultural and political characteristics of the country’. The elements of PHC we will focus on include ‘education concerning prevailing health problems, … maternal and child health care including family planning and immunization, and appropriate treatment of common diseases and injuries’. Other aspects of PHC, such as safe water and basic sanitation, prevention and control of locally endemic diseases, and provision of essential drugs, are covered in other chapters.
Primary health care is essential health care … made universally accessible to individuals and families in the community through their full participation and at a cost that the community and country can afford.
It is the first level of contact of individuals, the family and community with the national health system … and constitutes the first element of a continuing health care process.
Involves, in addition to the health sector, all related sectors and aspects of national and community development, in particular agriculture, animal husbandry, food, industry, education, housing, public works, communications and other sectors; … and demands the co-ordinated efforts of all those sectors.
Sustained by integrated, functional and mutually supportive referral systems, leading to the progressive improvement of comprehensive health care.
This chapter explores the development of PHC during the 60-year period after Malaysia achieved independence (1957–2018). The development process is viewed in the context of the interaction of various components of the health system, as well as the interactions with other sectors and the influence of international movements. Two distinct phases of development are evident, as described in Sections 4.2 and 4.3.
4.2 The First Phase of PHC Development (1960s–1990s)
4.2.1 Drivers and Contexts
At independence, about 75% of the population lived in rural areas, and almost half the population lived in poverty (Reference Mohd Ashad and ShamsudinMohd Ashad & Shamsudin, 1997). The ethnic composition reflected the urban–rural divide, with ethnic Malays being largely rural, ethnic Chinese largely urban and ethnic Indians largely in the rubber estates. Maternal and child mortality was high, nutritional status was poor and the incidence of infectious diseases was high. Table 4.1 provides a glimpse of Malaysia’s health status at independence and its evolving status during the subsequent 30 years.
| 1957 | 1970 | 1980 | 1990 | |
|---|---|---|---|---|
| Life expectancy at birth, male (years) | 55.8 | 61.6 | 66.4 | 68.9 |
| Life expectancy at birth, female (years) | 58.2 | 65.6 | 70.5 | 73.5 |
| Maternal mortality ratio per 1,000 live births | 2.81 | 1.62 | 0.6 | 0.2 |
| Infant mortality rate per 1,000 live births | 73.01 | 43.82 | 23.8 | 13.1 |
| Toddler mortality rate per 1,000 population aged 1–4 years old | 8.91 | 5.02 | 2.1 | 1.0 |
1 1956–1960
2 1966–1970
The PHC system developed for Malaysia was built on the healthcare system inherited from the British colonial system. It consisted of outpatient clinics attached to hospitals, a few dispensaries and infant welfare centres provided by the government, and private sector clinics operated by doctors (general practitioners, or GPs). Almost all of these services were in urban areas. This healthcare system evolved from the requirements of the expatriate governing staff, that is, the more educated and affluent urban population.
The predominantly rural population depended on practitioners of traditional medicine, while workers in the larger rubber estates depended on estate clinics provided by employers. However, four years prior to independence, the country introduced a service to serve the rural population, which evolved into the Rural Health Service (RHS) in 1956, just before Malaysia gained independence (Reference RudnerRudner, 1972; Reference IsmailIsmail, 1974; Reference Wong, Ng and SuJ. H. W. Wong et al., 2019).
Independence brought into power an elected coalition of ethnically based political parties, led by the ethnic Malay political party. Unsurprisingly, the political focus shifted to prioritise rural communities to reflect the location of strong Malay support. The major thrust of development was to achieve socio-economic transformation by developing the country’s basic rural infrastructure, modernising agricultural production in rural areas and improving education and health (Federation of Malaya, 1960; Reference RudnerRudner, 1972; Reference Lee and LeeLee & Lee, 2017). Infrastructure development was an integrated approach that included rural roads, drainage and irrigation, schools and clinics (Reference Mohd Ashad and ShamsudinMohd Ashad & Shamsudin, 1997). Planning and development was co-ordinated by the Economic Planning Unit in the Prime Minister’s Department, and the progress of all elements within each administrative district was monitored in an integrated fashion through a ‘Red Book’ that commanded the attention of politicians and civil service administrators at national, state and district levels. The RHS was a major component of this integrated development, such that a district would receive an integrated package that increased physical access to basic education and healthcare, while parallel initiatives addressed its economic needs.
4.2.2 The Rural Health Service
The RHS was government funded. A basic RHS unit served 50,000 population. It consisted of a main health centre (MHC), 4 sub-centres (HSC) and 20 satellite midwife clinics, each with an attached residential facility for the midwife (MCQ). This basic unit was designed to provide ‘integrated curative and preventive health services’ (Reference JayasuriaJayasuria, 1967). Table 4.2 illustrates the services and notional staffing pattern of the basic RHS unit. The number of rural health facilities increased significantly between 1960 and 1980 (Table 4.3).
| Facility | Services | Notional staffing pattern |
|---|---|---|
|
|
|
| Health sub-centre (HSC, 10,000 population) |
|
|
| Midwife clinic and quarters (2,000 population) | Domiciliary midwifery | Midwives (with supervisory nurses from MHC or HSC) |
During the first 10 years, the major challenges included difficulty in matching the rate of facility construction with that of population growth, inadequately trained staff for facilities that had been completed, and prevailing cultural beliefs and taboos that hindered service utilisation. After 15 years of development, by 1975, the facility-to-population ratios showed that only 50% of population coverage targets had been achieved. A community survey showed that 24% of the rural villages in the survey areas were ‘underserved’ (Reference NoordinNoordin, 1978). To increase access, the static facility-based services were supplemented with mobile clinics-cum-dispensaries that travelled by road or river, and dental clinics funded by the government, all providing free access to the population (Reference IsmailIsmail, 1974; Reference Tate Abdullah, Khoo and GabrielTate Abdullah et al., 2005). These teams visited remote villages and provided a PHC package consisting mainly of curative, MCH and immunisation services periodically.
4.2.3 The Influence of the Alma Ata Declaration on the RHS: Community Mobilisation, Enhanced Intersectoral Co-ordination, Referral Systems
By the time of the Alma Ata Declaration (1978), Malaysia had already adopted many of the basic concepts of the Declaration. The serving Director-General of Health, Dr Raja Ahmad Noordin, stated: ‘Malaysia viewed PHC as an extension to its existing health care services’ (Reference NoordinNoordin, 1978). The major contribution of Alma Ata was to provide a fillip for the conceptual enhancement of PHC services by spurring the introduction of community mobilisation, enhancing inter-sectoral co-ordination and strengthening referrals to and support from hospitals (secondary healthcare) (Box 4.2).
Use of trained allied health personnel (particularly nurses and midwives) instead of reliance on doctors. Infrastructure development quickly outstripped the availability of human resources. Rapid but strictly regulated training of nurses and midwives, with registration, defined roles with relevant competencies, and appropriate deployment was a success (see also Chapter 8).
Partnerships with traditional birth attendants (TBAs). In the Malay communities, TBAs (bidan kampung) were influential. In 1967, about 3,000 TBAs conducted an estimated 47% of the 174,000 deliveries (Reference PengPeng, 1979). In some areas, the percentage could reach 80% due to both the shortage of midwives and the belief system of the community (Reference Ali and Howden-ChapmanAli & Howden-Chapman, 2007). Recognising the key position of TBAs in rural communities, the Ministry of Health introduced a training programme for TBAs in 1965 (Suleiman and Jegathesan, n.d.) to change their role. They would recognise the danger signs of pregnancy and childbirth, avoid harmful practices and conduct home visits to encourage women to utilise midwife clinics and health centres for antenatal and postnatal care. They also provided support to certified government midwives during home deliveries. The TBAs were allowed to continue to perform harmless traditional practices such as postnatal massage.
Community mobilisation. Several parallel thrusts mobilised community support. Health officials took advantage of the system of village development committees established by the rural development programmes to mobilise the support of the penghulu (village headman) and his committee for various health issues (Reference Pathmanathan, Liljestrand, Martins, Rajapaksa, Lissner and de SilvaPathmanathan et al., 2003). Women’s development programmes provided entry points to raising awareness and providing practical avenues for better child-rearing and nutrition. The school health programme provided the vehicle for mobilising school children not only to understand and improve their own lifestyle but also to influence their parents’ health behaviour.
Partnerships with other public sector agencies with grassroots presence. Police posts in rural villages had the function of issuing birth certificates and burial permits. Midwives and nurses obtained data on births and deaths in their districts from the police. Similarly, police communications systems (radios) provided the means for front-line health staff to call for ambulances and assistance during medical emergencies.
Dr Noordin spearheaded community mobilisation to make it an integral complement to expanding health services. Additionally, facility expansion was accelerated such that the RHS configuration was modified to extend the coverage of the basic unit to serve a population of 20,000. Staffing profiles changed accordingly. Emulating the successful experience in one state (Sarawak), midwives were upgraded to become rural (community) nurses and given a wider scope of responsibility (Chapter 8). Accelerated training of nurses and midwives enabled rapid upgrading of the quality of services. Simultaneously, community mobilisation took several forms, with active efforts to encourage communities and families to promote health, prevent illness and utilise health services appropriately. Health staff became focal points for organised community efforts, as exemplified in the rural sanitation programme (Chapter 7). Nursing and midwifery staff gained entry to male-dominated village development committees by working in partnership with sanitation staff. This approach enabled them to promote safe childbirth by sensitising communities to the danger signs in childbirth and pregnancy and encouraging the acceptance of prompt medical intervention to save the lives of mothers and babies. Pregnancy care included supervision of childbirth at home by trained, certified midwives, followed by 10 days of daily postnatal home visits that enabled the visiting health staff to build a rapport with the family and the community while establishing breastfeeding and healthy nutritional habits (Reference Pathmanathan, Liljestrand, Martins, Rajapaksa, Lissner and de SilvaPathmanathan et al., 2003).
Inter-sectoral co-ordination became a part of service delivery as well as infrastructure development. Child health included growth monitoring, oral re-hydration techniques, breastfeeding, immunisations, food supplementation, female literacy and family planning. Partnership with rural women’s development programmes enabled health staff to raise awareness of hygiene and nutrition. Health topics were integrated into school curricula through interagency co-ordination between the Health and the Education Ministries, and school visits by nurses and dental nurse teams brought basic screening, referral and simple treatment to the doorstep of the expanding school-enrolled population. Partnership with traditional birth attendants (TBAs) reduced unsafe childbirth while giving the TBAs a continuing role in supporting birthing women (Reference Pathmanathan, Liljestrand, Martins, Rajapaksa, Lissner and de SilvaPathmanathan et al., 2003). Nutrition demonstration sessions by nurses in rural clinics gained popularity. The Applied Food and Nutrition Programme, implemented in districts with high levels of malnutrition, is an example of a partnership with the agriculture, rural development and women’s empowerment initiatives.
Regional disparities in social status and poverty led to targeted poverty reduction programmes. These programmes included initiatives for better access to healthcare and for addressing childhood malnutrition in disadvantaged areas. The prevalence of childhood malnutrition was used as a surveillance tool, while the prevalence of undernourished children was a criterion for identifying low-income families to receive food supplementation as well as assistance with education, housing and employment (Economic Planning Unit, 2004).
Another influence of Alma Ata was to highlight the health needs of remote populations, including the indigenous people (Orang Asli), who had limited access to transport to and communication with healthcare facilities. Mobile teams had to travel over unsealed roads, by river and on foot to serve these communities periodically.
The effectiveness of these measures, in combination with the broader socio-economic development issues discussed in Chapter 3, is evident, for example, in the rising levels of childbirth attended by skilled birth attendants, immunisation coverage and declining maternal and child mortality (Table 4.4) (Reference Suleiman and JegathesanSuleiman & Jegathesan, n.d.). The proportion of deliveries by trained personnel increased from 77.2% (Peninsular Malaysia) in 1975 to 95.2% (Malaysia) in 1996 (Reference Suleiman and JegathesanSuleiman & Jegathesan, n.d.). Referral systems were established particularly for maternity and for infectious diseases such as malaria and tuberculosis (TB). When nurses based in rural clinics referred patients with obstetric problems to hospitals, these patients were given priority and prompt attention. Pregnant women and young children carried personal health cards displaying their pregnancy and healthcare information, thereby facilitating information exchange between PHC and secondary levels of care (United Nations Development Programme, 2005; Reference AwinAwin, 2011). The major communicable disease control programmes established similar referral systems (Chapter 6). The parallel development of rural roads and the provision of ambulances stationed at the MHCs facilitated the movement of referred patients, thereby supporting the referral system. This service delivery system in turn enhanced the credibility and acceptability of health services for the rural population. Senior obstetricians who served in public sector hospitals during that period freely attributed the decline in maternal death to the sterling efforts of rural-based nurses and midwives in identifying complications of pregnancy and childbirth and getting patients to hospital in time for effective interventions (Reference Pathmanathan, Liljestrand, Martins, Rajapaksa, Lissner and de SilvaPathmanathan et al., 2003).
| 1970 | 1980 | 1990 | |
|---|---|---|---|
| Place of delivery | |||
| Government hospitals | 30.01 | 43.91 | 59.1 |
| Other medical institutions | 11.41 | 10.71 | 16.1 |
| Home deliveries | 58.61 | 45.41 | 24.8 |
| Immunisation coverage | |||
| Bacille Calmette-Guerin (BCG) (infant) | 46.6 | 88.2 | 98.7 |
| Diphtheria, pertussis and tetanus (DPT) (3rd dose) | 15.0 | 67.0 | 92.0 |
| Polio (3rd dose) | 15.0 | 72.0 | 91.5 |
| Measles (infant) | 10.0 | 20.0 | 69.6 |
1 Peninsular Malaysia only.
4.2.4 PHC in Urban Areas
Public sector.
During the first three decades after independence, the ambulatory health service component of PHC in urban areas was provided by a combination of government-funded public services, the private sector (funded through out-of-pocket expenditure by users) and non-governmental organisation (NGO) services supported by civil society and government grants. There was very little co-ordination across these sectors. However, these services are collectively credited with raising awareness and acceptance of allopathic medical interventions, particularly among those who had relied mainly on traditional remedies and were steeped in cultural beliefs that were obstacles to the use of effective healthcare.
The public sector hospitals each had outpatient (ambulatory) services that provided walk-in care mostly geared to acute episodes of illness, as well as accident and emergency (A&E) services that were available 24 hours a day. In the larger hospitals, doctors aided by hospital assistants (later re-named medical assistants) were backed by pharmaceutical services (Reference Suleiman and JegathesanSuleiman & Jegathesan, n.d.). These services provided referrals for admission and specialist care when needed. Almost all of these hospital-based outpatient services were confined to curative care, except for pregnancy, for which antenatal and postnatal clinics provided counselling and services, including that for family planning. Additionally, in the larger urban configurations, the local authority (such as the city council) provided maternal and child health services through a network of clinics. These services predated independence and were the prototype that was later used by the RHS for maternal and child health services. All of these services were provided for nominal or no fees, and utilisation rates in ambulatory facilities were very high, resulting in queues and long waiting times. During the third decade post-independence (the 1980s), the state of the overcrowded, understaffed services began to cause concerns about the quality of care. This contributed to the genesis of the Quality Assurance initiative (see later in this chapter and Chapter 5).
Private sector.
The private sector complemented the public sector in urban areas. Medical doctors (GPs) owned and provided healthcare, including dispensing medication through small clinics that operated from modest premises. Most were in ‘shop houses’, that is, two- or three-storeyed premises with the clinic on the ground floor. The higher floors sometimes served as short-stay hospitals for patients and came to be known as nursing homes or as private hospitals. Such premises were flanked by other shops. Most patients paid a fee for the service, which was generally very low, affordable and popular with the urban population. They received ‘one-stop’ care by the doctor, sometimes assisted by trained nurses or medical assistants; medication was dispensed on the spot, and minor surgery was performed on the premises.
Non-governmental organisations (NGOs).
NGOs played a small but very significant role in the development of PHC in urban areas. Some NGOs, such as St John Ambulance and Red Crescent, filled gaps in the services provided by the public sector. Others, such as the family planning associations (FPAs) (Box 4.3) and several associations related to special needs, such as impaired hearing, vision and disabilities arising from illness (e.g. leprosy) or genetics, provided small-scale models of care and strong advocacy that served to mobilise civil society to recognise unmet needs. They established partnerships with the public sector, which provided financial grants. For example, the FPAs received an annual grant of RM 200,000 from the government from 1962 until the early 1980s (Reference Tey, Robinson and RossTey, 2007). In later years, when capacity grew, the public sector took over many of these services and used the care models developed earlier by the NGOs.
The FPAs (now known as the Federation of Reproductive Health Associations, Malaysia, or FRHAM) were largely led by prominent obstetricians and personalities active in civil society. They had the ear of policymakers, although the services they provided were limited mainly to small clinics situated in urban MCH clinics and hospital postnatal wards. The uptake of contraceptives was not impressive. The West Malaysia Family Survey conducted in 1966 found that the contraceptive prevalence rate was only 8.8% (Reference Ahmad, Tey, Kamarul Zaman, Muhd Sapri, Abdul Manaf and YeohAhmad et al., 2010). Advocacy and the service models used by the FPAs contributed to the establishment of the National Family Planning Program under the First Malaysia Plan in 1966 to improve families’ health and welfare and promote national economic development. The programme was expanded and integrated into RHS in the mid-1970s to serve rural and remote communities. The rapid expansion of the MCH and FP services have been a major factor in lowering the infant mortality rate across the country (Reference Pathmanathan, Liljestrand, Martins, Rajapaksa, Lissner and de SilvaPathmanathan et al., 2003).
Traditional and complementary medicine (TCM).
Although traditional practitioners were and continue to be widely available, there is little information about them. They were not registered, and their practice was not regulated. More recently, there has been stronger oversight of the products they use, and this is discussed in Chapter 11.
4.3 The Second Phase: The Continuing Journey towards Integrated PHC Services (1990–2017)
4.3.1 Drivers of Change
Economic growth continued over the following 30 years, although there were a number of setbacks, including the Asian financial crisis. The population became increasingly urban, reaching almost 70%, and the proportion of teens and young adults increased, followed by an increase in the number of elderly people (Chapter 3). Lifestyles and health-related behaviour, particularly around food and physical activity, began to change. For example, during the 1990s, tobacco smoking and drug addiction were major concerns, while in the 2000s, the obesity epidemic took centre stage (Reference Suleiman and JegathesanSuleiman & Jegathesan, n.d.). As people became increasingly well-connected with the world through media and travel, public expectations of healthcare increased.
Rising healthcare costs competed with other priorities in the national budget and increased pressure on the health sector to consider alternate approaches for healthcare financing (Chapter 9) and cost containment. The voices of civil society became stronger, with a growing dichotomy between conservative and liberal value systems. This generated debates and tension on many health-related issues, such as reproductive health and HIV/AIDS. Additionally, international pressures, first towards achieving Millennium Development Goals (MDGs) and subsequently re-aligning towards Sustainable Development Goals (SDGs), influenced national health goals (Chapter 6, Case Study 6.1).
All of these interacting forces were drivers that influenced health policy and the evolution of PHC, first towards the provision of a greater range of services to cater for new and emerging needs; second towards better integration between services. Integration and co-ordination were needed to remove institutional barriers between the multiple healthcare services that catered to any particular family and to focus on providing health services to meet the needs of people within their families and communities. The rapid urbanisation also required different modalities from rural settings for the provision of integrated PHC.
The Seventh Malaysia Plan (1996–2000) marked a change for PHC with the establishment of a new PHC division in the Ministry of Health (MoH) (Economic Planning Unit, 1996). The evolving PHC services during this period had two major characteristics. First, in the public sector (mainly MoH services), there was convergence of the hitherto separate services for promotional-cum-preventive health provided at health centres and the curative outpatient services provided by MoH hospitals and health centres. Second, in the private sector, serious stresses emerged in services provided by GPs, associated with issues of financing and competition from public-sector clinics and by specialist practitioners who also provided primary care (Chapter 4, Case Study 4.2).
4.3.2 PHC Services in the Public Sector
The overarching goal of the public sector was to achieve equitable access to more comprehensive primary care. Three threads of interlinked thrusts towards this goal are discernible, namely:
Expanding the scope of PHC services to encompass additional age groups and health needs.
Integrating preventive-cum-promotional services with curative services to address segmentation and compartmentalisation and provide seamless care for individuals, families and communities.
Improving the quality of services to respond better to expectations in the community and professional groups.
4.3.2.1 Expanded Scope of Preventive PHC Services in the Public Sector
During the 1990s, responding to demographic and morbidity trends, the preventive and health promotional services provided by health centres expanded to include additional age groups (adolescents, adults, women’s and workers’ health, the elderly, children with special needs) and health problems, such as mental health and screening for iodine deficiency and glucose-6-phosphate dehydrogenase (G6PD) deficiency, while the national childhood immunisation programme expanded to include measles, mumps and diphtheria, and Haemophilus influenzae (Reference Suleiman and JegathesanSuleiman & Jegathesan, n.d.).
The clinic-based services were complemented by community-based programmes. The nutritional surveillance of children and pregnant women conducted in 1988 provided valuable input to the national poverty reduction initiatives and rehabilitation efforts (National Coordinating Committee on Food and Nutrition, 2006). The Food Basket Programme (also known as the rehabilitation programme for malnourished children) for children with poor nutritional gain continued to reach out to poor communities (National Coordinating Committee on Food and Nutrition, 2006). Clinic-cum-community services were also initiated to support anti-tobacco smoking efforts, which included smoking cessation clinics. The health clinic advisory panels (panel penasihat), with local community representatives, worked with health staff on four major areas: healthy ageing, advocacy for immunisation, dengue control, and diabetes and overweight management (Reference Mustapha, Omar, Mihat, Noh, Hassan and Abu BakarMustapha et al., 2014).
Simultaneously, the hitherto rural health services gradually increased their coverage to include urban areas in response to demands from local authorities that had little interest in providing services that did not generate revenue. This required organisational re-structuring, including the transfer of authority, staff and some physical facilities from the local authority to the national MoH, particularly in the metropolitan cities of Penang, Melaka and Kuala Lumpur. It also paved the way subsequently for easier integration of preventive and curative services.
Gaps in and limitations to expansion.
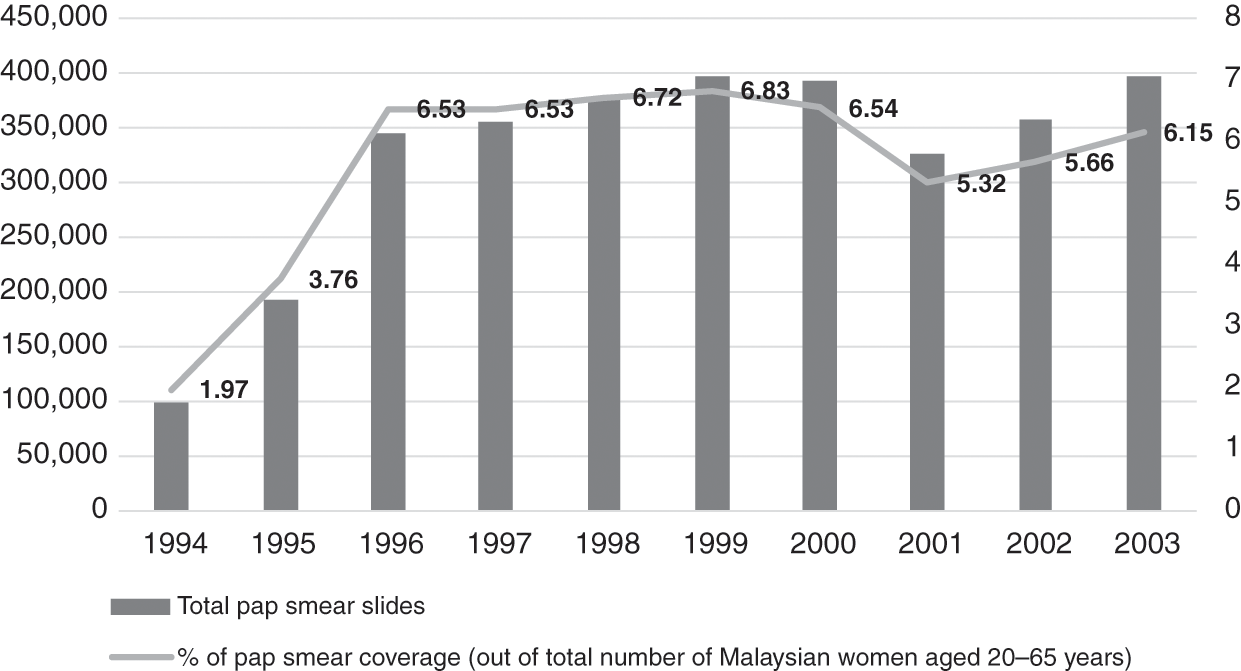
Financial and human resources constraints limited some of the service expansion. For example, cervical cancer screening had already been planned to incrementally cover larger sections of the target age group, but laboratories could not cope, and the turnaround time was slow. Screening reached only 6% of eligible women (aged 20–65 years) between 1996 and 2003 (Figure 4.1) (Ministry of Health Malaysia, 2005), and follow-up call services were inadequate (Reference Wong, Wong, Low, Khoo and ShuibL. P. Wong et al., 2008). Also, other components of the health system interacted with PHC services in the public sector to initiate, facilitate or limit the expansion of PHC services. Examples are summarised in Box 4.4.
Examples of Limiting Factors
Finance: Dictated the speed and influenced the scope of expansion. While new programmes were added, some existing programmes, such as family planning and cervical cancer and breast cancer screening programmes, failed to gain traction.
Workforce: Upgrading the competencies and recruitment of new categories with different competencies needed, such as finance, training and managerial support. For example, the lack of trained staff hampered the ability to provide rehabilitation, occupational therapy, home visits and home care nursing services for the elderly.
Examples of Enabling Factors
Medical products and technology: Additional affordable vaccines (measles, mumps and rubella (MMR), hepatitis B, human papillomavirus (HPV)) and the availability of simple field tests (G6PD and hypothyroidism screening) enabled the expansion of services. Staff training and financial support enabled this expansion.
Health information: Nutritional surveillance identified anaemic pregnant women and malnourished children and enabled the provision of food baskets for them as part of multi-sectoral poverty reduction; Teleprimary Care enabled better management of diabetes and hypertension by providing data for targeted monitoring and follow-up.
Governance: Community mobilisation and inter-sectoral co-ordination supported strategies for reducing disease risk factors. Grants were allocated for promotion, prevention, early screening and rehabilitation care. Illustrative examples are the mobilisation of teens through peer-to-peer counselling within school communities for targeted purposes such as tobacco smoking and drug use (PROSTAR) and for more general behaviour change purposes such as healthier lifestyles (Doktor Muda) (Ministry of Health Malaysia, 2005). New legislation established standards for care, including care of older people in private healthcare facilities, and also mandated the sale of iodised salts in districts with high risk of iodine deficiency disorders.
4.3.2.2 Integration of Preventive and Curative Services in the Public Sector
Prior to the mid-1990s, curative PHC services were provided by:
Outpatient departments (OPDs) of public sector hospitals and some satellite clinics for free or for a nominal charge.
Public sector health centres and dispensaries, also free or for a nominal charge.
During the 1990s and early 2000s, two related organisational changes within the MoH led to better integration of preventive and curative services. First, the implementation of a policy decision to move OPDs out of hospitals and into health centres began in the late 1990s and continued incrementally over the next decade. Second, this move was followed by the re-organisation of services in the health centres to better serve the goal of developing people-centred PHC.
Transfer of OPDs.
Historically, hospital OPDs primarily catered for acute episodes of illness, rarely providing health prevention or promotion, and were not geared for the continuity of care essential for non-communicable disease (NCDs). Conversely, health centres had separate arms – the family health arm had good competence for providing preventive and health promotional services for family health aimed at clients in various phases of the life cycle (pregnancy, childhood, adolescence, old age), including individuals, families and communities on a long-term basis. However, the outpatient arm of the health centres mainly provided for walk-in patients. The utilisation of OPD services evolved, with the health centres gradually overtaking the hospital OPDs in terms of volume of utilisation (Figure 4.2).

Additionally, by the late 1990s, the proportion of patients with illnesses such as hypertension and diabetes, which require long-term management, was increasing. Meanwhile, public sector hospitals had difficulties managing outpatient services (OPDs), as their focus was mainly on secondary and tertiary care. Therefore, a policy decision was implemented to transfer OPDs from hospitals to health centres.
Re-organisation of health services.
The outpatient services in health centres were re-vamped to cater to the integration of preventive and health promotional services with illness management (Economic Planning Unit, 1996). The health centres adopted a new approach that integrated basic PHC concepts in addressing the continually expanding initiatives required to deal with NCDs. Box 4.5 summarises the concepts involved, and the illustrative case study on REAP-WISE (Reviewed Approach: Wellness, Illness, Support Services, Emergency Information) elaborates on the initiative. Imaging, laboratory and pharmacy facilities were upgraded progressively as staff and physical infrastructure became available (Economic Planning Unit, 1996; 2001). Communication between primary, secondary and tertiary care was strengthened, and information systems were upgraded to include electronic personal medical records that facilitated the integration of information from the various services that catered to each patient and family (Economic Planning Unit, 2001).
The health centre services renewed the PHC concept with a new approach to accommodating its additional services, namely:
1. Preventing and reducing disease burden by treating the ill, managing those with risks and preventing the onset of preventable risks.
2. Enhancing healthcare delivery for fast access to safe and high-quality services with greater comfort in a hassle-free environment.
The wellness focus covers the life-course from antenatal to child and geriatric age for early identification of and management of medical conditions. All new activities for wellness are mapped against age group needs. Teams oversee policy development for the collective activities for each age group in order to integrate workflow processes, accounting for monitoring indicators, quantity and quality of human resources required, the diagnostic equipment, pharmaceutical requirements, and physical space for these activities. These workflow processes are then phased in at clinics nationwide.
Gaps and limitations to the integration and re-organisation.
This re-organisation process required the re-allocation of budget and human resources between hospitals and health centres, and it also required re-engineering health information systems to provide real-time access to patient information for care providers at primary and secondary level. Table 4.5 illustrates the gaps and challenges in integration and re-organisation as well as the action taken to address such challenges.
| Gaps and challenges | Action taken | |
|---|---|---|
| Finance | Limited | Transfer of OPDs was done incrementally over a period of more than a decade |
| Health workforce | Rapid turnover of staff, particularly junior doctors who needed rotational postings as part of career development |
|
| Medical products | Hospitals and health centres have separate budgets for pharmaceuticals – it was difficult to estimate the portion of hospital pharmacy budget needed for OPD as separate from inpatient care | State-level pharmacy departments took over budget management for pharmaceuticals for both health and hospital services |
| Service delivery |
|
|
4.3.2.3 Focus on Improving Quality of Care
During the late 1980s, the rising expectations of the public, as well as the strong commitment of professional leaders to quality of care, led to the introduction of a variety of quality improvement initiatives in the MoH (Reference Suleiman and JegathesanSuleiman & Jegathesan, n.d.). The scope of quality improvement was defined as including technical quality of care, client satisfaction and resource utilisation. This compares well with the statement 30 years later by the Organisation for Economic Co-operation and Development (OECD), the World Health Organization (WHO) and the World Bank defining the ‘measurable characteristics of quality as effectiveness, safety, people-centeredness, timeliness, equity, integration of care and efficiency’ (OECD et al., 2018). The key initiatives included raising the levels of competence in the PHC workforce and introducing systematic monitoring of quality followed by measures to identify and address systemic weaknesses that contributed to inadequate quality.
Higher levels of competence in the PHC workforce.
Medical officers, who were the front-line providers of care for illness episodes in health centres and OPDs, had no post-graduate or vocational training and had limited ability to manage more complex and chronic conditions, such as NCDs and mental illness. Years of effort by professional leaders (Reference RajakumarRajakumar, 1984) culminated in universities offering a new post-graduate training programme of Family Medicines, while the MoH created a new cadre of specialist: the family medicine specialist (FMS). This new category of FMS was expected to provide leadership in upgrading the quality of primary care services that included a more holistic approach of seamless care for health promotion, disease prevention, illness management and rehabilitation for individuals and families (Reference AwinAwin, 2004).
In tandem, the competencies of nurses and medical assistants were upgraded. The local production of allied health professionals, such as diagnostic radiographers, medical laboratory technologists, physiotherapists and dieticians, was stepped up with a higher level of qualifications and was modernised through integrated training approaches. Previously, the services of these allied health personnel were available only in hospitals, but now they were added to PHC teams (Ministry of Health Malaysia, 2006).
Quality monitoring and improvement strategies.
Hitherto focused on monitoring and improving ethnic and regional disparities in equitable access to care and health outcomes, PHC services added new dimensions to their performance monitoring (Box 4.6). Table 4.6 shows illustrative examples. The conglomerate of activities created a ‘bottom–up’ quality culture within the organisation.
| Approaches to quality improvement | Examples | Benefits derived from the initiative |
|---|---|---|
MoH Quality Assurance Programme adopted the approach of:Nationwide monitoring of selected indicators of system failure, for:
| During the early stages of the programme, indicators were:
|
|
| Participation in nationwide quality improvement strategies by health districts, health centres, hospital OPDs, laboratories and pharmacies |
|
|
Workforce skill levels and competence
Outcomes of prevention and management of illness
Client satisfaction
Resource utilisation
4.3.3 PHC Services in the Private Sector
In the private sector, doctors (GPs) provide ambulatory non-specialist curative services on a fee-for-service basis. In the 1980s and 1990s, as rural to urban migration increased and the economy improved, the size and utilisation of the private sector increased rapidly (Figure 4.3).

Box 4.7 summarises the characteristics of GPs, who provide about half of ambulatory care in Malaysia. Despite their importance in the health sector, governance and financing arrangements result in GPs having few incentives to provide prevention and promotion services. Their fee schedule is per visit and has not been adjusted for inflation over the past 15 years (Reference MaharajahMaharajah, 2018). It is not geared to reward the time and effort spent on health promotion. For many GPs, the fee is so low that it is not financially sustainable, and they rely on the sale of medications to maintain financial viability. Patients are free to move between doctors; doctor-hopping is frequent and therefore continuity of care could be compromised, and it can be difficult to build a trusting and long-standing relationship between providers and clients and their families. Additionally, there is no restriction on patients seeking primary care from doctors who practise as specialists in any discipline in the private sector. Therefore, specialist doctors are in direct competition with GPs.
GPs are medical doctors.
Few have any specialist or vocational training to function as providers of comprehensive PHC such as the requirements for GPs in the United Kingdom or Australia.
Most GP clinics are urban and semi-urban, with fewer than six staff members. They use private laboratory and imaging services.
GPs prescribe and dispense medicines.
The public utilises GP services largely for acute illness episodes while largely visiting public PHC clinics for more chronic and complex conditions (Table 4.7).
| Rate per 100 encounters | |
|---|---|
| Public sector primary care clinics | |
| Hypertension | 31.3 |
| Diabetes | 22.5 |
| Lipid disorder | 18.5 |
| Private sector clinics | |
| Fever | 28.3 |
| Cough | 26.5 |
| Runny nose/rhinorrhea | 19.4 |
A Quality and Costs of Primary Care (QUALICOPC) study showed that three-quarters of the patients who visited private clinics reported that they did not have a primary doctor to follow up on their condition (Reference Sivasampu, Mohamad Noh, Husin, Wong and IsmailSivasampu et al., 2016). Health information systems are underdeveloped. Few patients’ medical records are computerised and there are no incentives for recall and follow-up of patients who require long-term management. There is no systematic monitoring of the quality of care (Reference Sivasampu, Mohamad Noh, Husin, Wong and IsmailSivasampu et al., 2016). In contrast, for example, in Australia, there are targeted incentives for private sector primary care providers to support immunisation and cervical smear testing and for installing information technology (Reference KhooKhoo, 2002).
Additionally, GPs face serious economic challenges arising from the introduction of third-party administrators (see Case Study 4.2). On top of that, medical insurance schemes generally do not cover ambulatory care. In a recent survey, 70% of GPs interviewed cited as serious threats market competition from community pharmacies, and 55% cited market competition from the public sector 1Malaysia clinics (Reference KennyKenny, 2017).
The policy environment in which private clinics currently operate presents obstacles to preventative and chronic care. This shows how stated goals, such as the aim of the MoH to increase integration and comprehensiveness of primary care, may differ from systems outcomes. Policies and resources for public clinics have enabled significant advances toward these goals. However, private clinics operate under fee structures, lack of integrated information systems and other policy obstacles that create barriers to preventative and chronic care. Private GPs have persisted in health promotion despite these obstacles (Table 4.9). The MoH needs to invest in an enabling system for private GPs to sustain and maximise their contribution to comprehensive primary care.
4.3.4 Traditional and Complementary Medicine
TCM is responsible for about 6% of expenditure on ambulatory care. For the first 50 years after independence, the allopathic healthcare system adopted an attitude of peaceful co-existence with TCM, responding only to curb practices that were known to be dangerous to health. This chapter is hampered because there is little empirical evidence of TCM practices or their outcomes. During the last 10 years, initial efforts were directed at establishing a database of practitioners and practices and developing regulations to set standards for practitioners (Reference Mahmud, Tahir, Ida Farah, Ami Fazlin, Sondi and AzmanMahmud et al., 2009; Division of Traditional and Complementary Medicine, 2017). These were the first steps in integrating TCM into the country’s PHC system. Case Study 11.1 provides insights into some of the challenges.
4.3.5 Outcomes of PHC in the Public and Private Sectors
Access, satisfaction, quality and continuity of care.
A QUALICOPC study showed that patients generally did not perceive barriers to access (physical and financial) to care and were satisfied with the care they received at both public and private clinics (Table 4.8) (Reference Sivasampu, Mohamad Noh and ChinSivasampu et al., 2015; Reference Rajakumar2016).
| Patients’ perceptions of accessibility of primary care and satisfaction with care | % of patients interviewed | |
|---|---|---|
| Public clinic | Private clinic | |
| Clinic not too far away | 77.5 | 85.4 |
| Opening hours not restricted | 59.2 | 73.3 |
| Able to get a home visit | 43 | 18.9 |
| Out-of-office hours | 58.3 | 68.1 |
| Never postponed or abstained from a visit when needed | 80 | 85 |
| Satisfied with the duration of the consultation | 96.7 | 96 |
The large majority of doctors in both public and private clinics were reportedly involved in health promotion as part of their normal patient contact, though not in group sessions (Table 4.9).
| Proportion (%) | ||
|---|---|---|
| Public clinic | Private clinic | |
| Smoking | 88 | 95 |
| Diet | 92.8 | 97.9 |
| Problematic use of alcohol | 52.9 | 66.5 |
| Physical exercise | 85.5 | 98.7 |
Referral linkages with secondary and tertiary care were not strong (Table 4.10), particularly in terms of feedback from secondary to primary care level and in horizontal communication between primary care providers.
| Proportion (%) of doctors stating: | ||||||
|---|---|---|---|---|---|---|
| Usually/always | Occasionally | Seldom/never | ||||
| Public clinic | Private clinic | Public clinic | Private clinic | Public clinic | Private clinic | |
| Received patient records from previous doctor | 36.2 | 7 | 51.6 | 39 | 12.2 | 54 |
| Used referral letters | 99 | 91 | ||||
| Obtained feedback from specialists | 19 | 19 | 30.8 | 31 | 50.2 | 50 |
| Obtained discharge report from hospital | 271 | 221 | 13.72 | 292 | 58.4 | 49 |
1 Within 1–14 days.
2 Delayed by >14 days.
As the doctor-shopping phenomenon was observed and there was a lack of longitudinal continuity at private primary care clinics (Reference Sivasampu, Mohamad Noh, Husin, Wong and IsmailSivasampu et al., 2016), it is not surprising that significant differences were noted in aggregated performance indicators of quality of care between public and private sector primary care, with the public sector surpassing the private sector (Table 4.11).
| Percentage of: | Public | Private |
|---|---|---|
| Controlled diabetics1 | 38.1 | 35.5 |
| Hypertension management2 | 44.1 | 39 |
| Hypertension management3 | 50 | n.a. |
1 MHSR (Malaysia Health Systems Research) analysis using NHMS (National Health and Morbidity Survey) 2015 data. Fasting blood glucose of 4.0–6.1 mmol/L or non-fasting blood glucose of 4.4–8.0 mmol/L.
2 MHSR analysis using NHMS 2015 data. Target blood pressure of ≤140/90 mmHg.
3 MHSR analysis using Teleprimary Care data, which relates only to care at MoH clinics.
n.a. – not available
4.4 Summary of the Malaysian Experience
Although the PHC services predated the Alma Ata Declaration of 1978, the guiding principles used in Malaysia were akin to those formulated in Alma Ata. Over 60 years, these services evolved in incremental stages in response to population dynamics and behaviour, changing disease patterns and economic pressures, taking advantage of local opportunities and recognising constraints. The government assumed responsibility for free public sector services that led the way and dominated the subsequent evolution of PHC in the country. Achieving equitable access for a wide range of ‘essential services’, including PHC services, has remained a cornerstone of the evolution. These services included preventive and health promotional services, including nutrition, as well as curative services provided at hospital OPDs and by the private sector.
PHC services retained the focus on people throughout the evolution – variously reaching out to communities to mobilise them in improving or sustaining health. The process of evolution saw a progressive expansion of the range of preventive and promotional services – beginning with pregnancy, childbirth and infancy and progressing through each age group to old age while simultaneously addressing specific localised concerns, such as iodine deficiency and mental health, as they arose. The parallel evolution of ambulatory curative services saw a progression from managing acute illness episodes to dealing with illnesses that require long-term care, such as hypertension and diabetes. The evolutionary process recognised the benefits of merging the parallel development of preventive/promotional services with the curative stream, and the system was able to accomplish rather complex organisational re-structuring to achieve such merging.
The other cornerstone of the evolution was the continuing thrust to improve quality. The features of the success in Malaysia are: strong and sustained leadership and commitment to quality; adherence to basic principles of quality improvement, including monitoring; and improvement that originated from the service providers themselves, thereby reducing the fear of punitive repercussions and increasing accountability and transparency.
Several challenges surfaced from time to time. As elaborated on in Chapter 8, some were addressed successfully, while others continue to haunt the evolutionary process. For example, the evolving profile of a workforce with higher qualifications has created demands for higher remuneration and better career paths. The workforce in the public sector PHC service is part of the larger civil service in the country. Hence, change is fraught with repercussions. Meanwhile, the private sector is reluctant to absorb higher-paid categories and prefers task-shifting, for example, using nurse assistants in place of trained nurses.
In the past, the private sector has complemented the public sector by providing care for those who were able to pay out of pocket for prompt and convenient care. The last couple of decades has seen publicly funded primary care growing faster than the private sector. While the public sector moves closer to comprehensive primary care and keeps an eye on quality and responsiveness, the private sector is struggling with issues of governance, financing, skills in the workforce and disincentives to move towards comprehensive care. There is a risk that public perceptions of public and private services will change. Wealthier sections of the population might change their health-seeking behaviour accordingly and drift towards the highly subsidised public sector despite being able to afford private services. This would have a negative impact on PHC by overburdening the government budget. Efforts to establish a more collaborative model of operation have been repeatedly frustrated by political pressures and priorities.
The development of PHC clearly illustrates the systems concept limits to growth, in which a previously successful strategy runs into a new limitation that requires a new approach. We see in this chapter the rapid expansion of maternal and child health clinics to improve coverage, followed by the expansion of services, which in turn led to the development of multi-disciplinary teams. Each of these developments came about as the prior strategy encountered limitations in improving population health, and they required substantial re-alignment of clinic organisation, practices and personnel. The growing challenges of chronic care and health promotion in urban settings will probably require similar experiments and paradigm shifts among public primary health clinics.
4.5 Key Messages from Malaysia’s Experience
4.5.1 What Went Well?
PHC is part of rural development; PHC benefits from the development of education and communication and contributes to rural development.
The cornerstone of PHC is equitable access to services; close linkages with secondary care and community mobilisation are key; urban settings require different modalities from rural settings in the provision of integrated PHC.
Appropriately trained and supervised allied health workers provide low-cost, high-impact PHC.
Systematic monitoring, focused on identifying and resolving systems issues rather than creating a blame culture, improved quality of care.
4.5.2 What Did Not Go So Well?
The dichotomy between the public and private sectors in terms of financing and governance continually generates challenges that have not been addressed adequately.
The rigid structure of the civil service (including the public sector health services) and the fee-for-service mechanisms of the private sector continue to be major constraints in the development of PHC.
4.5.3 Trends and Challenges
Epidemiologic, demographic and technological trends will require flexible adaptive responses from PHC.
5.1 Introduction
Secondary and tertiary care (STC) as discussed in this chapter are services provided in a facility such as a hospital or an ambulatory care setting by a specialist that require more specialised knowledge, skill or equipment than can be provided at the primary care level. The Alma Ata Conference on Primary Health Care (PHC) clearly defined the role of STC within PHC:
[T]he support of other levels of the health systems is necessary to ensure that people enjoy the benefits of valid and useful technical knowledge that is too complex or costly to apply routinely through primary health care. The rest of the health system, therefore, has to be organised in such a way as to provide support for primary health care.
Mahler, the Director-General of the World Health Organization (WHO) from 1973 to 1988, furthered the concept, for example, by stating in 1980 that ‘people in need must have access to skilled surgical care at first-line referral hospitals’ (Reference MahlerMahler, 1980). The evolution of STC in the Malaysian health system demonstrates the challenges and achievements in implementing these concepts.
This chapter discusses how access to and quality of STC improved progressively in Malaysia during the 60 years since independence and how the system is currently grappling with the challenge of providing affordable, integrated, seamless care. It discusses the dynamic interactions of various components of the health system and their influence on STC and the influence of the larger Malaysian ecosystem, such as political, socio-economic, demographic and population behaviour.
The appendices provide details of the analysis that underpins the chapter. Appendix I illustrates the application of systems thinking, while Appendix II provides illustrative details of the interactions between components of the health system that are defined in the WHO health system ‘building blocks’ (see Chapter 1) and also the interaction between the health system and the larger ecosystem.
5.2 The Early Phase (1960s and 1970s): Increasing Access and Reducing Disparity
At independence, Malaysia inherited secondary care services consisting of 10 major hospitals and 56 district hospitals concentrated mainly in urban centres in the West Coast states of Peninsular Malaysia (Box 5.1). Many of them were dilapidated (International Bank for Reconstruction and Development, 1955). Doctors and nurses were in short supply, and specialists were almost entirely expatriate.
5.2.1 Socio-demographic Pressures and Political Forces
After independence, political and community forces dictated development. Policies aimed to improve health and social services and reduce disparity between regions and ethnic groups (Prime Minister’s Department, 1961) (see Chapter 3). For secondary care, these policies translated into measures to increase access to secondary care by upgrading existing hospitals where necessary and providing hospitals in districts that had none. Each hospital provided inpatient as well as outpatient (ambulatory) care. Together with rural health centres and dispensaries that also provided outpatient services (see Chapter 4), outpatient services provided first-contact curative care. A report by the then Director-General of Health credits the ‘widespread establishment of outpatient departments and referrals to hospitals’ with ‘provoking awareness of the rural people of the benefits of modern medical treatment’ (Reference IsmailIsmail, 1975).
Pre-independence, specific demands led to the establishment of hospitals.
The colonial government established hospitals for the healthcare of:
◦ Colonial officers and their families
◦ Government employees and their families
Chinese charitable foundations established hospitals that provided a combination of western and traditional Chinese medicine (TCM), basically for the private sector Chinese employees.
Corporate owners of rubber estates provided small estate clinics with a few beds for their employees, mainly Indians.
Christian missionaries established a few not-for-profit hospitals, mainly as part of their charitable work.
The respective target populations resided mostly in the urban centres in the West Coast states of Peninsular Malaysia. The largely rural Malay population had limited access to secondary care services (Reference Tate, Khoo and GabrielTate et al., 2005; Tung Shin Hospital, n.d.).
5.2.2 Hospital Services Supported PHC
Even before Mahler’s historic 1980 address, the Malaysian district hospitals were first-line referral facilities. They provided support for PHC through secondary care for patients referred from the national disease control programmes, such as those for malaria, tuberculosis (TB) and leprosy (see Chapter 6), and the rural health services, particularly for pregnancy, childbirth and illnesses of childhood (see Chapter 4). The staff of these hospitals were mainly nurses, midwives, medical assistants and junior doctors who were able to address emergencies, minor surgery, childbirth and its simpler complications, and the management of illnesses that required hospitalisation. However, the hospitals had neither the staff and the operating theatres for surgery nor the laboratory and imaging facilities for more complex secondary care. However, the district hospitals did have ambulances that provided free transport links on the one hand between district hospitals and state-level hospitals that had more sophisticated facilities and on the other hand between hospitals and health centres that provided PHC. These ambulances ferried patients, staff and laboratory samples and were crucial in providing the referral link between primary and secondary levels of care.
State-level hospitals provided, at a minimum, specialist care in internal medicine, surgery, obstetrics and gynaecology, paediatrics, and anaesthesia, with appropriate support services (Reference IsmailIsmail, 1975). During this period, several existing, dilapidated state-level hospitals were re-built or refurbished. The government highly subsidised medical care in the public sector hospitals and therefore imposed only a nominal charge on patients at the point of care (see Chapter 9).
The development of STC required the production of a sufficient workforce of doctors and nurses. However, the number of doctors produced was small, as there was only one local medical school (later three) (see Chapter 8). Furthermore, there was no local facility for postgraduate specialist training for Malaysian doctors, and very small numbers were sent abroad annually for training, mainly to the United Kingdom. On their return, they slowly replaced the expatriate specialists and provided specialist services and leadership for the different clinical disciplines. However, the rapid production of nurses and assistant nurses (see Chapter 8) facilitated district hospitals in providing selected forms of secondary care services, and this, to some extent, compensated for the much slower production of doctors. Working alone or with doctors, medical assistants provided secondary care for communicable diseases and other common ailments that did not require specialist care. Nurses who had an additional year of midwifery training became nurse-midwives and, assisted by trained midwives, managed uncomplicated childbirth in all hospitals. The number of district hospitals increased, as did hospital beds for TB, leprosy and childbirth. The hospitals also provided support for the rapidly developing primary health care services (Box 5.2).
The hospitals provided support for the evolution of PHC. The key features were:
Ambulances that provided free transport for patients, staff and laboratory samples between front-line PHC facilities, first-line hospitals and higher-level hospitals.
Doctors (particularly obstetricians and paediatricians) who worked in state-level hospitals participated in training nurses and medical assistants who subsequently served in district hospitals or PHC facilities.
This helped establish rapport and trust between staff at PHC and STC level, thereby fostering timely recognition and referrals from peripheral facilities. Such referrals were given priority in the larger hospitals, thereby enhancing the credibility of the staff in the peripheral facilities.
During the subsequent three decades, advances in medical products and the success of the disease control programmes enabled hospitals to reduce the beds provided for acute communicable diseases (Figure 5.1). Also, improved access to STC for pregnant women contributed to the reduction in maternal deaths and sustained the demand for institutional childbirth. Box 5.3 provides illustrative examples.

Hospital care had a major role in reducing incidence of TB (Reference Suleiman and JegathesanSuleiman & Jegathesan, n.d.).
In 1960, beds reserved for TB patients accounted for 25% of hospital beds.
The aim of hospital management was to treat patients to render them non-infective before sending them back into the community.
The advent of effective drugs shortened inpatient stay and enabled a reduction in TB beds by 1996.
Maternal deaths declined through an effective and credible system that provided safe childbirth care with timely access to STC (Reference Pathmanathan, Liljestrand, Martins, Rajapaksa, Lissner and de SilvaPathmanathan et al., 2003).
Essential obstetric care: By 1976, overwhelming demand for childbirth in hospitals resulted in maternity units having extremely high bed occupancy and turnover rates (Institute for Public Health, 1983).
Emergency and comprehensive obstetric care: Ambulances from rural health centres and district hospitals provided prompt transport for the referral of patients with obstetric complications to hospitals with higher levels of care that included specialist care from obstetricians.1
The rapid increase in the utilisation of hospitals throughout the country demonstrated the rising demand for STC (Figure 5.2).

Although the availability of hospital services increased, they barely coped with the rate of population increase. Fifteen years after independence, the disparity in the availability of STC between the more urbanised West Coast states in the Peninsula and the less developed East Coast states2 remained evident (Table 5.1).
| Acute beds (per 1,000 population) | Admissions (per 1,000 population) | |
|---|---|---|
| West Coast states | 2.16 | 37.25 |
| East Coast states | 1.69 | 22.50 |
| Peninsular Malaysia | 2.08 | 34.58 |
| East Malaysia | 1.94 | n.a. |
| Malaysia | 2.05 | n.a. |
5.2.3 Demand for STC Outstripped Supply
Financial and implementation capacity constraints slowed the progress of building new facilities. In addition, the limited production of doctors led to numerous vacancies in medical officer positions. Meanwhile, societal perceptions were changing. Increased access to hospitals led to a rapid increase in demand for STC. By the mid-1970s, public sector hospitals, particularly the larger ones, faced overwhelming demand, leading to overcrowding. A study of the utilisation of public sector hospitals (Institute for Public Health, 1983) delved into the phenomenon. It found that about 50% of medical officer posts were vacant, although nursing posts had fewer vacancies. Medical staff were unable to cope with the workload. About 25% of patients bypassed smaller district-level hospitals to seek care in larger hospitals. The commonest reason reported was the lack of surgical services. Patients were also dissatisfied with ward conditions (Public Health Institute, 1983). Many doctors, frustrated with conditions in the public sector, resigned to become general practitioners in the private sector. This contributed to the continued shortage of doctors in public sector hospitals (see Chapter 8 re. brain drain). Moreover, it exacerbated the difficulty of improving access in the less-developed states in the country.
5.2.4 STC in the Private Sector Began to Grow
In the meantime, the number of local doctors with specialist qualifications increased steadily, and they served under high pressure in the overcrowded larger hospitals. Recognising the strong demand for more comprehensive STC and exhausted by the high pressure of work, several of them resigned from the public sector during the late 1970s and established four private for-profit hospitals in the largest towns on the West Coast. These hospitals began the trend for the growth in private sector STC in response to demands by the more affluent section of the community for more personalised care and better ‘hotel-type’ facilities. By 1980, 4.3% of all hospital beds were in private hospitals.
The few established non-governmental organisation (NGO) hospitals that predominantly served the ethnic Chinese population had close links with Chinese traditional practitioners and provided some traditional Chinese medicine (TCM) services.
Supplementary Table 5-a in Appendix II summarises the interaction between different elements in the health system and the larger ecosystem as they influenced the evolution of STC during the first post-independence phase.
5.3 The Second Phase (1980s and 1990s): Drive for Better-Quality Access
5.3.1 Political, Socio-economic and Professional Influences
During the 1980s and 1990s, the population became increasingly urban, and literacy rates and socio-economic status rose, as did the population’s expectations of healthcare. Many communicable diseases decreased, while non-communicable diseases (NCDs) increased. A dual thrust in health policy governed the development of STC. The first was the continued struggle to improve equitable access to STC. The second was to respond to the rising expectations of the community and of professional bodies to provide higher-quality care, including care that was:
a. clinically more sophisticated, with more equitable access to surgical interventions, and
b. better quality in terms of
◦ effective outcomes,
◦ higher client satisfaction, and
◦ improved use of resources.
5.3.2 More Sophisticated Clinical Care
Doctors with postgraduate training in specific disciplines had the higher level of competency required to provide comprehensive STC. Specialist training in local universities for doctors began during the 1980s (see Chapter 8) and resulted in the availability of larger numbers of doctors with specialist qualifications and the establishment of a wider range of specialised units in public sector hospitals. This, in turn, triggered the upgrade of laboratory and imaging services and the training of allied health personnel, such as medical laboratory technologists and radiographers, for these services (see Chapter 8). To promote equitable access to specialised medical services, the Ministry of Health (MoH) adopted a regional development approach. State-level and larger district hospitals were categorised into three levels, with Level 1 consisting of five basic medical specialities, Level 2 having six additional specialities and Level 3 consisting of further specialisation within narrow fields of the more general disciplines (such as cardiologists and neurologists within the broader field of internal medicine). Every region in the country had one hospital of Level 3 status and at least one with Level 2 status. The availability of speciality services increased from 12 units per million people in 1970 to 16 units in 1997 (Table 5.2).
| 1970 | 1980 | 1997 | |
|---|---|---|---|
| Peninsular Malaysia | 121 | 220 | 283 |
| Sabah | 4 | 15 | 31 |
| Sarawak | 5 | 25 | 38 |
| All | 130 | 260 | 352 |
| Units1 per million people | 12.1 | 18.9 | 16.2 |
1 One unit was equivalent to one or more specialists in a specialist unit or department.
With the growing numbers and types of specialist qualifications from various universities and countries, professional bodies and the MoH were concerned about safeguarding the standards of competence to preserve the quality of care. This triggered governance actions in the form of the establishment of procedures for credentialing and certifying specialists (see Chapter 8).
The increasing numbers and types of sophisticated clinical services required better laboratory and imaging services. For example, Table 5.3 illustrates that the upgrading of laboratory services in MoH hospitals was linked to the type of specialist services available. The upgraded laboratory services required the appropriate allied health personnel with higher levels of qualifications. Appropriate training programmes and deployment strategies came into place.
| Type of facility | Laboratory service |
|---|---|
| No specialist doctor | Medical laboratory technologist (MLT) |
| Specialist doctor but no pathologist | Biochemist OR microbiologist plus MLT |
| Pathologist | Biochemist AND microbiologist plus MLT |
| National referral level (IMR) | All plus sub-speciality pathology services |
| IMR and universities2 | Very sophisticated tests and research |
The developments required higher investment and maintenance costs. The rising gross domestic product (GDP) facilitated the financing of these investments.
Figure 5.3 provides a summary of the dynamic interactions in the health system as it moved towards providing more sophisticated clinical services.

5.3.3 Private Sector
Meanwhile, there was high demand for STC in the private sector, leading to the rapid expansion of hospitals (Table 5.4). In 1997, 70% of private hospitals were small, with less than 20 beds, and several were in buildings not suited for providing quality care (Reference Suleiman and JegathesanSuleiman & Jegathesan, n.d.). Concerned about quality standards, the government enacted legislation (Government of Malaysia, 1998) with stringent standards for physical structure and with corporate and clinical governance, including procedures for monitoring quality (see Chapter 12). Enforcement began in 2006.
| Year | No. of private hospitals | No. of private hospital beds | Private as % of all hospitals | Private as % of all admissions |
|---|---|---|---|---|
| 1980 | 50 | 1,171 | 4.3 | n.a. |
| 1985 | 133 | 3,559 | 11.5 | 12 |
| 1990 | 197 | 4,675 | 14.1 | 14 |
| 1996 | 215 | 7,417 | 20.4 | 17.2 |
n.a. – not available
In parallel, there was high demand for care by the few specialist doctors who had established larger private hospitals since the mid-1970s. Recognising a good business opportunity, corporate entities moved in and bought up the larger hospitals. Corporate ownership led to a change in philosophy. While catering for the demands of the well-to-do who could afford private sector fees, these hospitals now also paid serious attention to profit margins. Their expansion and development plans reflected this change (Reference Suleiman and JegathesanSuleiman & Jegathesan, n.d.). One evident feature was the trend towards the rapid proliferation of higher-cost technology in the private sector as compared to the public sector (Table 5.5). These hospitals were concentrated in the wealthier regions of the country, thereby challenging the objective of equitable development.
| MoH hospitals | Private hospitals | |||||
|---|---|---|---|---|---|---|
| CT scan1 | Mammogram2 | MRI3 | CT scan1 | Mammogram2 | MRI3 | |
| Nine West Coast states | 11 | 10 | 2 | 42 | 32 | 11 |
| Three East Coast states | 3 | 3 | 0 | 2 | 1 | 0 |
| Sabah and Sarawak | 3 | 2 | 0 | 4 | 3 | 2 |
1 Computed tomography (CT): The MoH had one unit per state except for the capital city, Kuala Lumpur, which had four units. Private hospitals had 17 units in Kuala Lumpur and neighbouring Selangor and 10 units in Penang.
2 Mammogram: The MoH had one unit per state except Kuala Lumpur, which had three units. Private hospitals had nine units in Kuala Lumpur, four units in Selangor and eight units in Penang.
3 MRI – magnetic resonance imaging.
The MoH initiated health technology assessment (HTA) as a means of rationalising the acquisition of newer technology. The output of the HTA unit provided input into the formulation of policies in the public sector and provided the basis for the development of clinical practice guidelines (CPGs), purchasing decisions, drug regulation and health-related advertisements (Reference Roza, Junainah, Izzuna, Ku Nurhasni, Mohd Yusof and NoormahRoza et al., 2019). However, there is limited information on whether the private sector uses the HTA information for guiding the development of technology.
The development of the private health sector in Malaysia is an example of how solutions to health system challenges can create long-term, irreversible changes to the system. Rising demand for more sophisticated medical care in the 1960s and 1970s led to a gap in public hospital capacity as limits in financial and human resources caused capacity to lag behind demand. This demand continued to increase in the 1980s and 1990s, so the rise and rapid expansion of private sector hospitals was welcomed by the public sector. While the private sector alleviates the burden of the public sector in some ways, it has become apparent that it draws medical practitioners, especially specialists, away from the public sector (Figure 5.4). The public sector thus has had to invest further resources and change policies to retain medical practitioners to keep up with healthcare demands.
Rising demand for medical care outpaced public hospital resources, creating a gap in public sector capacity (B1). The expansion of private sector hospitals (B2 loop) offered a means of bridging this gap with private sector resources. However, private healthcare has drawn on medical personnel from the public sector, becoming another source of pressure on public sector capacity (R1 loop). This is a well-known system archetype known as ‘shifting the burden’, in which actions taken to address the outcomes of a problem (a gap in hospital capacity) can exacerbate the underlying causes of that problem (public hospital human resources).

Private sector care has become corporatised and supporting structures such as private insurance and medical tourism have been developed, creating a self-sustaining industry. In addition to health workforce challenges, the resulting fragmentation of healthcare providers and financers has created challenging tensions regarding the locus of responsibility for the provision and payment of healthcare.
5.3.4 Quality: Monitoring and Improving Outcomes
In the late 1980s, the government of Malaysia initiated nationwide efforts to improve quality in the public sector. The MoH was one of the agencies that led the way in implementing the national call to action. The National Quality Assurance Programme (QAP) of the MoH spearheaded efforts to instil concern for quality as a culture at all levels of the organisation. It established a system for the explicit measurement of outcomes. This included monitoring performance trends in clinical care, patient satisfaction and better use of resources (physical, time and human resources). Box 5.5 provides illustrative examples.
Approach and Methods
Peer groups in each clinical discipline or hospital management group selected performance indicators.
The MoH collected data on the indicators, analysed and rank-ordered the performance of individual hospitals, and shared the results with all stakeholders.
Outliers were encouraged to analyse the factors contributing to their status and were helped to remedy issues.
Performance trending enabled peer groups to discard or replace indicators periodically to move towards more sensitive and specific monitoring of performance outcomes.
Examples of Results
Improvement in the management of acute myocardial infarction.
Decreases in waiting time to see doctors and decreases in rejection rates for X-rays and laboratory specimens.
Improved client satisfaction with counter services (e.g. pharmacy counters), cleanliness and facilities. For example, a small district hospital (Kuala Krai) in one of the more disadvantaged states won a national award for improving the quality of public services in 1995.
The thrust for improving clinical outcomes (Figure 5.5) provided a fillip for strengthening clinical governance measures such as the development and use of Clinical Practice Guidelines (CGPs) and for stronger implementation of existing initiatives such as clinical audits and mortality reviews. It also contributed to improving the quality of data for health information (see Chapter 10), particularly in terms of accuracy of International Classification of Diseases (ICD) coding and timeliness of data, as healthcare providers became aware that this had a critical impact on the accuracy of indicators that measured performance.
Dynamics of improving clinical outcomes and establishing a quality culture at every level.

The drive for improved outcomes of clinical care led to the establishment of disease registries for selected conditions such as end-stage renal disease (ESRD) and cancer, which are managed largely at the secondary care level. The registries are meant to provide information on disease conditions as well as treatment effectiveness and cost. The National Renal Registry, established in 1993, was a trailblazer, and it monitors trends in the quality, cost and effectiveness of different modalities of care for ESRD (Reference Lim and LimLim & Lim, 2004). It provided the data for a cost analysis that enabled the move to public–private partnership in the provision of dialysis (Reference Lim, Lim, Wong, Ahmad, Singam and MoradLim et al., 1999).
The thrust for better outcomes in patient satisfaction and use of resources (Figure 5.6) stimulated a need for increased managerial competence at all levels of the MoH system (see Chapter 8). It also facilitated the growth of team approaches and the use of health systems research as a management and problem-solving tool. Hospitals won national ‘quality awards’ for improving client satisfaction and reducing waiting times (Reference Suleiman and JegathesanSuleiman & Jegathesan, n.d.). Budgeting systems were modified to provide greater authority to hospital managers to manage funds more flexibly to respond to local requirements (see Chapter 9). However, as the MoH was part of a larger public sector system, there were constraints. The degree of flexibility that could be decentralised was limited due to financial rules and regulations (see Chapter 9). Similarly, as all MoH staff are part of the federal civil service (see Chapter 8), constraints arose. For example, nurses with training and credentials in one discipline had to move to another discipline to further their careers (Institute of Health Management, 2006).
Dynamics of improving resource utilisation and client satisfaction.

The thrust for improved resource management extended to strategies for improving the maintenance of building structures and biomedical equipment in public sector hospitals. New posts were created for hospital-based engineers, and maintenance services were outsourced to private contractors, with hospitals retaining oversight of the contractors’ performance (see Chapter 7). Performance indicators of quality applied not only to clinical aspects of care but also to support services.
The quality-improvement measures also strengthened support from STC for PHC services (Box 5.6).
Various measures contributed to further strengthening supportive linkages between hospitals and PHC. Examples include:
In the QAP, the senior specialist for a discipline in each state hospital took responsibility for improving quality in all facilities. For example, the state obstetrician provided oversight to prevent maternal deaths throughout the state and therefore liaised with district hospitals, health centres and rural midwives, resulting in an improvement in the early detection and referral of complications of pregnancy (Reference Pathmanathan, Liljestrand, Martins, Rajapaksa, Lissner and de SilvaPathmanathan et al., 2003).
Outbreaks of dengue fever resulted in health inspectors visiting hospitals for epidemiological investigations that strengthened communication between STC and PHC. Conversely, health centres and private clinics used clinical management protocols originating from hospital-based specialists to improve the quality of care for dengue patients.
Supplementary Table 5-b in Appendix II summarises the interactions in the health system during the 1980s and 1990s (STC development Phase 2).
5.4 The Third Phase (2000–Present): Drive towards Integrated, Seamless, High-Quality Care
By the beginning of the new century, the health sector still fell short of the requirements for equitable access to quality care and faced several threats that arose from the ‘successes’ of the past. Section 5.4.1 and Case Study 5.1 analyse the interactions between various components of the health system in addressing some of these threats.
The major threats to STC included:
In the public sector: Rapid increase in specialisation that led to increasing fragmentation at both clinical and managerial levels.
In the private sector: Increasing conflict between medical care as a profit-oriented business and as a service to improve the welfare of the community.
Conflicts arising from the changing roles in the public–private split of the health sector.
The health sector reactions to these threats included (but were not restricted to):
Implementing organisational change to address the fragmentation that arose from increasing trends of specialisation.
Taking advantage of changes in medical technology and information communication technology (ICT) to improve access and efficiency while reining in escalating costs.
Attempting to use governance measures (legislation, financing) to address the challenges and governance gaps in dealing with the public–private split in the health sector.
5.4.1 Organisational Change
In the public sector, there was a rapid increase in the types of clinical specialist units in hospitals and the types of programme management units at national and state levels. Communication between organisational units deteriorated. For example, communication between hospitals and health centres, between hospital outpatient departments (OPDs) and wards, between departments of different clinical disciplines and between district- and state-level hospitals became more challenging (Reference SuleimanSuleiman, 1999). This carried threats to continuity of care for patients, such as people with diabetes, who required long-term care provided by more than one unit or department. There was an increased risk of worse-than-desired health outcomes.
Furthermore, duplications and missed opportunities could contribute to organisational inefficiencies, resulting in rising healthcare costs. The MoH addressed these threats by adopting a policy to ‘provide seamless health care by enhancing integration’ (Institute for Public Health, 1999). Two structural changes of note occurred. First, OPDs in hospitals were moved to health centres that were better suited to provide seamless preventive, promotive and curative care in ambulatory settings and adopted family and community perspectives in the management of conditions such as NCDs. Chapter 4 discusses this initiative.
The second strategy was the formation of hospital clusters to increase access to specialist care and improve utilisation rates in the smaller hospitals. The smaller hospitals had quite a large proportion of unused beds. During the previous experience in the regionalisation approach to improving access, specialists visited non-specialist hospitals. This proved unsuccessful because the smaller hospitals did not have the facilities or expertise to support specialist care. In the cluster concept, a major hospital that had a wider range of specialities formed a cluster with a few neighbouring smaller hospitals to share financial and human resources and equipment. In addition, there was an initial investment in upgrading surgical facilities in the smaller hospitals. Specialists and their teams from the lead hospital provided specialist services at the smaller hospitals on a visiting basis, negating the need to move patients to the major hospital. There was investment in training to enable staff at the smaller hospitals to provide adequate follow-up care after the team from the major hospital had provided treatment. The pooled budget enabled the sharing of financial and material resources such as drugs, equipment and travel between hospitals. There was shared responsibility for the outcomes of care. Initial assessment indicated that these measures provided relief from overcrowding in the major hospital and increased patient satisfaction and cost–benefit in the management of patients with moderate or serious illness. However, they did not increase utilisation rates in the smaller hospitals. Barriers to sustaining or expanding this initiative included frequent transfer of human resources from the smaller hospitals, thus negating the investment in upgrading capacity, and inadequate recognition of the need for the initial additional investment to prepare smaller hospitals to support specialist services (Institute of Health Management, 2016; 2017). Despite these initiatives, the bed occupancy rates of the non-specialist hospitals remained below 50% (Figure 5.7).

Another aspect was the strengthening of referral systems. Within the MoH system, there were continuing efforts to improve the logistics and communication of referral between primary, secondary and tertiary care levels. This included strengthened governance through the refinement and clarification of procedures, expected standards and technological support, for example, through the telehealth project that enables real-time sharing of patient data between primary and secondary care levels, thereby contributing to quality of continuity of care for patients (Reference AllaudinAllaudin, 2014). However, other major challenges arose from governance features of the health system. For example, patients have direct access to specialist clinics in both the public and private sectors without going through primary care (Reference Yiengprugsawan, Healy, Kendig, Neelamegam, Karunapema and KasemsupYiengprugsawan et al., 2017). This encourages the bypassing of primary care. In addition, in the private sector, it encourages rivalry between primary and specialist care providers, which in turn raises the risk of failure to refer conditions that require higher levels of competency. Additionally, evidence suggests that feedback and referral from STC services to primary care in the public sector is weak (Table 5.6). In larger hospitals in both the public and private sectors, rules for referral between different clinical disciplines have not been established.
| % of doctors stating | |||
|---|---|---|---|
| Usually or always | Occasionally | Seldom or never | |
| Received patient records from previous doctor | 36.2 | 51.6 | 12.2 |
| Used referral letters | 99 | ||
| Received feedback from specialists | 19 | 30.8 | 50.2 |
| Obtained discharge report from hospital | 27 (within 4–14 days) | 13.7 (delayed > 14 days) | 58.4 |
5.4.2 Advances in Technology
Technological advances affected STC profoundly. Two illustrative examples of the influence of technology on the delivery of STC services are telemedicine and day-care surgery.
Telemedicine.
The MoH introduced telemedicine progressively in several districts to increase access and reduce costs by enabling specialists based at larger centres to provide, through teleconsultation, diagnostic and therapeutic advice to doctors in hospitals without specialists or with a smaller range of specialities. Reference Yusof, Neoh, Hashim and IbrahimYusof and colleagues (2002) noted that the introduction of telemedicine increased access to STC in the remote, less accessible districts, such as Beluran and Kudat in Sabah, and led to ‘enhanced diagnostic options, cost savings and better health outcomes’. By 2016, telemedicine had increased to 45 facilities and 60 stations throughout the country (Ministry of Health Malaysia, 2016). Nurazean and colleagues reviewed the system and noted that the careful selection of sites influenced the usefulness and utilisation of teleconsultation. Factors in selection included sufficient need (i.e. inadequate expertise to address more complex problems), difficulty of physical access between sending and receiving sites, and discipline-specific guidelines (certain types of cases in each discipline are not amenable to distance guidance) (Reference Nurazean, Win, Singh and MasromNurazean et al., n.d.).
Day-care surgery.
Medical technology such as advanced anaesthesia and minimally invasive surgical technologies contributed to increasing numbers of day surgeries, for example, cataract surgery, laparoscopy and other endoscopies that require short postoperative monitoring and recovery. The evaluation of day-care cataract surgery has been possible through the National Eye Database, which facilitates the tracking of trends in cataract surgery. It provided evidence that contributed to improvements in techniques and technology, as reflected in practice patterns and outcomes (Table 5.7). An increasing proportion of cataract surgery is being performed as day-care, and visual outcomes have improved, indicating improved quality. The success of the day-care centres for cataract surgery is attributed also to the availability of dedicated, well-trained teams of care providers, including highly trained technicians, nurses, specialists and sub-specialists.
| 2002 | 2015 | |
|---|---|---|
| Cataract surgeries | 12,798 | 44,534 |
| Day-care (%) | 39.3 | 69 |
| Phacoemulsion (%) | 39.7 | 87.9 |
| Local anaesthesia (%) | 93 | |
| Intraoperative complications (%) | 5 | |
| Unaided visual outcome 6/12 or better (%) | 55.1 | |
| Visual outcome 6/12 or better with spectacles (%) | 87 | 95.1 |
Day-care surgery provides an avenue for controlling costs (Evaluation of Specialist Complex and Ambulatory Care Centre, 2018). The day-care centre approach has also contributed to integrated care, with specialists from various disciplines managing patients simultaneously. For example, endocrinologists managing problematic diabetic patients have simultaneous input from orthopaedic and vascular surgeons.

5.4.3 Governance Challenges Affecting STC
The fragmentation of clinical services is a challenge and occurs in at least at two dimensions of care. First, several clinical disciplines are compartmentalised into sub-specialties. Sometimes, the care provider in sub-speciality case management focuses on managing a particular condition to the exclusion of co-morbid conditions. At STC level, technological advancement necessitates multidisciplinary knowledge and skills and cross-discipline references in managing patients with multiple complex conditions. Care providers require the appropriate skills and attributes to recognise when cross-referral is needed and facilitate seamless cross-referrals. Currently, in Malaysia, the policies regarding intra- and inter-facility referral in both public and private sector clinical networks are weak.
Furthermore, clinicians at the PHC level who refer patients to STC levels of care have difficulties identifying the person or department in the hospital responsible for co-ordinating and facilitating such referrals. This situation is further complicated because patients have the right to an informed choice of providers that best fit their medical needs and financial resources. Many patients prefer to skip primary care facilities in favour of direct appointments at specialist clinics or hospitals, particularly in the private sector.
Another dimension of the fragmentation of STC is evident in the fragmentation between the public and private sectors, each with different payment and governance mechanisms. During the first 40 years after independence, the fragmentation of the Malaysian healthcare sector into the public and private sectors appears to have assisted the national goal of improving equitable use of healthcare (see Chapters 3 and 9). Although the schism created tensions, particularly in the distribution of the workforce, it also enabled the wealthier segment of the population who could afford it to utilise private hospitals, thereby facilitating the public sector to provide for the lower-income groups (Figure 5.9) (Health Policy Research Associates et al., 2013).
Composition of inpatient care utilisation in public and private sector by socio-economic status.
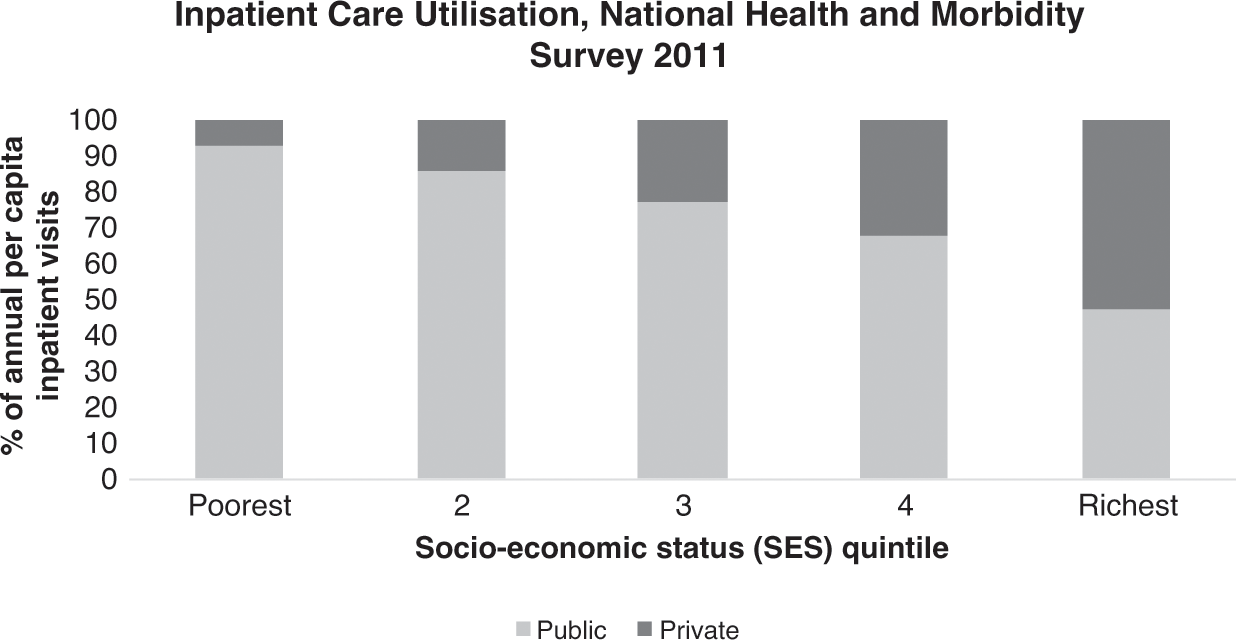
However, during the most recent two decades, fresh challenges have surfaced, arising largely from underlying governance structures and financing mechanisms.
5.4.4 Rising Expenditure and Costs in the Private Sector
STC accounts for a relatively high proportion (55%) of total health expenditure (THE) (Table 5.8). Private sector hospitals are responsible for an increasing proportion of THE, while that of public hospitals remains steady. Yet the proportion of discharges/admissions in public versus private hospitals has not changed during the period 2012–17. It is not clear whether the increased private sector expenditure is due to investment in new hospitals, investment in new expensive technology or higher cost of patient care.
| 2012 | 2017 | |
|---|---|---|
| THE | 42,764 | 57,361 |
| % public | 55.85 | 51.15 |
| % private | 44.1 | 48.85 |
| All hospitals as % of THE | 51 | 55 |
| Private hospital % of THE | 18 | 24 |
| Public hospital % of THE | 33 | 31 |
| Discharges from private hospitals (millions) | 0.91 | 1.05 |
| Discharges from public hospitals (millions) | 2.21 | 2.49 |
1 2012 data are reported as admissions, not discharges.
Clients are unhappy with the price of care in private hospitals (Table 5.9).
| Satisfaction with | % good to excellent | |
|---|---|---|
| Public | Private | |
| Provider behaviour | ||
| Ability to give diagnosis | 77 | 78 |
| Clarity of explanation | 77 | 79 |
| Courtesy and thoughtfulness | 78 | 82 |
| Characteristics of selected system | ||
| Private room/fewer people | 44 | 72 |
| Allowed to choose doctor | 45 | 73 |
| Waiting time to see doctor | 38 | 72 |
| Amount of time spent by doctor | 65 | 75 |
| Treatment charges | 80 | 27 |
| Outcome of service | 78 | 80 |
| Overall impressions | 81 | 72 |
The rapid increase in high-cost technology experienced in the previous decade continues in the private sector (Table 5.5 and Table 5.10). Are considerations of cost recovery from expensive investments driving costs in private hospitals? In the private sector, there is no overriding guide on technology acquisition. In contrast, reports from health technology assessment guide the acquisition of new technology in the public sector. Furthermore, in contrast to the public sector, no one monitors the outcomes of care and appropriateness of care across the private sector network of hospitals. Therefore, there are no feedback loops to trigger action from the authorities or to modify the behaviour of the providers themselves.
In theory, the public sector could harness the excess capacity of technology in the private sector, and there are examples of small-scale efforts in this direction, such as the purchase of PET (positron emission tomography) and CT (computed tomography) services. Case Study 5.1 on renal dialysis illustrates how imaginative cross-funding between public and private sectors can release private funds for initial investments and facilitate partnership for better utilisation of available private sector healthcare resources. However, this model has not been replicated, suggesting that there are serious barriers, perhaps related to finance and governance.
As there is no social health insurance and individual out-of-pocket payment is the largest source of private sector funding (Table 5.11), no organised entity has the responsibility of influencing rising costs. Private insurers are most likely to protect their own pockets by limiting payouts and passing on additional costs to individuals.
| Sources of funds | 2012 | 2017 |
|---|---|---|
| Private sources of financing (RM million) | 19,795 | 28,023 |
| Out of pocket (%) | 78.7 | 77 |
| Private insurance (%) | 14.0 | 15 |
| MCOs1 (%) | 0.5 | 4 |
| All corporations (%) | 5 |
Managed care organisations (MCOs) increased their participation in managing private sector funds from 0.5% to 4% of private funds over five years (2012–2017) (Table 5.11). This has raised further issues of gaps in governance, as illustrated by Case Study 4.2 on MCOs.
5.4.4.1 Governance Gaps
Corporate entities whose main driver is profit margins have acquired most of the private hospitals. Ironically, many of the larger corporations are government-linked agencies (Reference Chan and ChanChan, 2015), but they too share the profit motive. Additionally, encouragement of health tourism is now a major government policy (Economic Planning Unit, 2010), thereby accentuating the profit motive in the private sector. Thus, while public sector healthcare retains its vision and goal of the health and wellbeing of the population, including addressing inequitable access, quality, safety and cost containment, the private sector strives for return on investment and competitiveness. There is a conflict in vision about whether healthcare is for social wellbeing or whether it is a business enterprise. Few governance measures are in place to address evident or emerging conflicts.
5.5 Conclusion
In summary, STC evolved in response to demand from the larger ecosystem. Economic growth, population behaviour and epidemiological patterns created political pressures that in turn resulted in an ever-increasing demand for STC.
The evolution of STC has moved from selective secondary care towards increasingly comprehensive STC, moulded by the ability of the health workforce to respond to demands for higher levels of competency and by the availability and capabilities of medical products and technology.
The enabling sub-systems, in turn, have influenced the evolution of the healthcare provider sub-system. These sub-systems comprise finance (sources, recipients and modalities), health information (availability, quality and use) and governance (managerial competence, governance structures and legislative tools) that either enable or constrain the evolution of the provider sub-system.
The outcomes of the healthcare system, in turn, have influenced the larger ecosystem, thereby creating a perpetual cycle (Figure 5.10).

5.6 Key Messages from Malaysia’s Experience
5.6.1 What Went Well?
STC ability to respond to people’s desire for more sophisticated care and professionals’ desire to provide the best care available effectively and efficiently. Key factors are:
◦ Human resource production and use (see also Chapter 8).
◦ Systematic quality improvement strategies.
◦ Use of technology assessment for production of practice guidelines.
Investment in strengthening management, and decentralised decision-making.
5.6.2 What Did Not Go So Well?
Smaller hospitals built in response to public demand for access remain underutilised because of system inability to provide the human and material resources expected by the public.
Rapid growth of private sector STC affects social efficiency of STC and PHC.
In private sector STC: Unresolved conflict between the interests of shareholders (of companies owning hospitals) and those of stakeholders (users, providers, public sector STC).
6.1 Introduction
Disease prevention and control programmes aim to reduce disease incidence, prevalence, and morbidity or mortality (Reference DowdleDowdle, 1998). Within the first thirty years since independence in 1957, Malaysia successfully eradicated or drastically reduced the occurrence of several serious communicable diseases (CDs) (Figure 6.1). During the next thirty years, Malaysia had some success as well as limited or no progress in dealing with non-communicable diseases (NCDs), re-emerging CDs (such as dengue) and other new and emerging CDs (such as influenza H1N1). This chapter analyses the development and evolution of disease control in Malaysia over the sixty years since independence (1957–2017). It explores and analyses the influences and interactions of various components of the health system and beyond the healthcare system in controlling diseases. The chapter does not attempt to address all the threads of disease control efforts in Malaysia. Instead, specific examples of disease control programmes illustrate key features that contributed to the success or limited progress of control efforts.

Disease control programmes in low- and middle-income countries commonly use vertical or campaign-style programmes. Horizontal programmes, on the other hand, rely on a system of health services. Reference Atun, Bennett and DuranAtun, Bennett and Duran (2008) discuss the advantages of vertical programmes (rapid response; quick, economical and efficient solutions; better accountability within limited resources and timeframe) and constraints (donor- and value-driven (responsive to disease, lacking in people-centred care); expensive to sustain; creating subsequent redundancies, inefficiency and fragmentation in the health system). They note that some vertical programmes are standalone, completely separate and parallel to mainstream health services, and continue to remain in that mode. Others are designed as time-limited programmes that are then integrated with extant health services; yet others have varying degrees of integration from inception.
This chapter describes Malaysia’s developmental experience in disease control and explores how the characteristics of prevalent diseases and the health system have combined to influence the design of disease control programmes and their subsequent integration into the mainstream health service.
6.2 The First Phase (1957 until the Mid-1980s): Control of Communicable Diseases
By the time it gained independence, Malaysia had already controlled several major epidemic contagious diseases (smallpox, cholera, plague). The main CDs of concern were vaccine-preventable diseases (neonatal tetanus, diphtheria, pertussis (whooping cough)), which took a heavy toll of infant lives; vector-borne and water borne diseases (malaria, dysentery, typhoid and paratyphoid, and endemic cholera), which affected the productivity and lives of the work-aged population groups; and tuberculosis (TB), which caused illness and premature death in both adults and children (Box 6.1).
Malaria and TB were the fifth and sixth leading causes of hospital admissions and deaths, respectively (Supplementary Table 6.a) (Reference Ismail and MartinezIsmail & Martinez, 1974; Reference Suleiman and JegathesanSuleiman & Jegathesan, n.d.).
TB: An estimated 25% of all hospital beds were occupied by TB patients, most lt in advanced stages of the disease, and 75% of children had been infected by age 15 (MAPTB, 2012).
Malaria:
A 1965–66 survey showed 168,500 malaria cases reported from static and mobile clinics in Peninsular Malaysia, an annual 40,000 cases in Sarawak and 250,000 cases in Sabah (Reference Suleiman and JegathesanSuleiman & Jegathesan, n.d.).
Yaws was reported at 140.85 per 100,000 population in 1958 (Reference LoLo, 1985).
Filariasis was present in 20,000 of 600,000 people clinically examined between 1960 and 1984 (Reference Suleiman and JegathesanSuleiman & Jegathesan, n.d.).
Leprosy: An estimated 11,900 to 15,000 cases in Peninsular Malaysia in 1969 (Reference KamaludinKamaludin, 1990).
Tetanus, diphtheria, pertussis, poliomyelitis and measles contributed to high infant and child mortality rates (Figure 6.1 and Supplementary Table 6.b).
See Supplementary Tables 6.a, 6.b and 6.c for further information.
As elaborated in Chapters 3, 4 and 5, during the 1960s until the mid-1980s, healthcare for the predominantly rural population increased gradually, with expanding rural health centres and district hospitals and gradually increasing availability of nurses, midwives, hospital assistants (later known as assistant medical officers) and sanitation staff. Training and competence in public health and programme management was limited and concentrated mainly at the national and state levels. Monitoring systems were rudimentary. The high incidence and prevalence of the common CDs was a heavy burden for the nascent health services. The rationale for adopting vertical approaches for controlling selected CDs was to provide additional resources targeted at rapidly reducing specific disease burdens to enable the young health service to assume responsibility without being overcome by these diseases to the detriment of other functions.
A distinctive feature of Malaysian development was that disease control programme funding was from domestic sources and channelled through the budget allocated to the Ministry of Health (MoH). Malaysia generally does not receive significant bilateral aid for health (World Health Organization, 2017). Foreign aid was mainly in terms of consultant expertise for designing programmes and training staff, management and treatment protocols, and designing monitoring and surveillance systems. Therefore, the new programmes aligned as closely as possible to national health development strategies. There was no need to provide accountability to external donors. On the other hand, there were strong incentives to avoid unnecessary domestic financial burdens by using existing facilities and staff and avoiding human resource issues arising from redundant staff.
The factors that influenced the design of prevention and control programmes included:
the access of affected population groups to, and coverage provided by, the rural health service and public sector hospitals
the availability and technical skills of the staff in those facilities
the management capacity of the health services
the clinical nature of the diseases in question, which partly influenced how and when those who were affected made contact with health services
the epidemiological characteristics of the diseases in question, for example, the mode of transmission, the types of vectors and their habits, and the habits and lifestyles of human population groups
the availability of effective and affordable technology or medical products to address the diseases
The initiatives for preventing and controlling CDs during this period could be categorised in three groups:
1. No dedicated ‘programme’, for example, waterborne diseases, such as endemic cholera, typhoid and paratyphoid.
2. National programmes (or campaigns) with dedicated organisational entities for planning, training, monitoring and evaluation but service delivery through the mainstream health services. Examples are the vaccine-preventable diseases of childhood and TB.
3. National- or state-level programmes with dedicated management structures as well as service delivery mechanisms. Examples include vector-borne diseases such as malaria and filariasis.
Table 6.1 illustrates the key features that differentiated the various degrees of verticality in the spectrum of vertical programme designs.
| Examples of vertical disease control programmes | |||
|---|---|---|---|
| Vaccine-preventable diseases of childhood | Tuberculosis | Malaria | |
| Pressures that led to the adoption of national programmes | Professional and political awareness of the value of vaccines, influence of the WHO and availability of affordable vaccines | Strong advocacy by civil society (MAPTB) leading to political awareness and commitment | International pressure to move from control measures (based on species sanitation in cities and rubber estates) to nationwide eradication to avoid becoming a pool of infection dangerous to neighbouring countries |
Key organisational features of vertical national programmes at inception: |
|
|
|
| Duration and criteria for merging vertical programmes into mainstream health services |
|
|
|
Dedicated vertical programmes were suited for diseases that required the delivery of medical care (immunisation, diagnostic, medication) to specific target population groups or measures aimed at disrupting the lifecycle of specific vectors. In contrast, waterborne diseases required environmental control approaches coupled with surveillance and outbreak control. Therefore, instead of a dedicated disease-specific vertical national programme, preventing waterborne disease was the responsibility of environmental health services (see Chapter 7), while surveillance and control of disease outbreaks was the purview of mainstream health services for CD epidemiology and control.
6.2.1 Socio-economic Development Influenced the Development of Disease Control Programmes
The overall improvement of the country’s socio-economic and living conditions (see Chapter 3) facilitated the successes in controlling CDs. The gross domestic product (GDP) per capita increased substantially, with an annual growth of 7.7% between 1970 and the mid-1980s, improving standards of living for the majority of the population, making them less vulnerable to infectious diseases (Reference Tan, Kwok, Tan, Nagaraj, Tey and ZulkifliTan et al., 1987; UN Country Team, 2005). Significant improvements in roads and transportation made healthcare more accessible.
In addition to economic growth and infrastructure development, social development also progressed. The percentage of women (aged 15–19 years) who attended secondary school increased from 15% in 1960 to 75% in 1980, while the percentage of living quarters with piped water and flush toilets rose from 48% and 18% in 1970 to 68% and 60%, respectively, in 1980 (Reference Tan, Kwok, Tan, Nagaraj, Tey and ZulkifliTan et al., 1987). The increase in women’s education levels as well as improved environmental health contributed to the decline of infant mortality caused by CDs; in particular, vaccine-preventable diseases and food-borne and water borne diseases (Reference DaVanzo and HabichtDaVanzo & Habicht, 1986).
6.2.2 Programmatic Features that Influenced Outcomes
6.2.2.1 Collaborative and Co-ordinated Activities at Various Levels of Service Delivery
The national disease control programmes carried out promotion, prevention and early detection activities (education, vaccination and case detection) mostly at the primary care level. In the rural health units, disease control activities complemented maternal and child health and outpatient care, sanitation and environmental health services, and dental care. District and general hospitals served as training, treatment and referral centres. For example, hospitals supported rural health units by providing training for bacillus Calmette-Guerin (BCG) vaccination and served as referral points for case finding and contact tracing for TB control programmes (Reference Suleiman and JegathesanSuleiman & Jegathesan, n.d.). The dedicated management teams of the national disease control programmes played a critical role in aligning and co-ordinating disease control funding, strategies, processes, activities and services across different actors, sectors, levels and facilities. For example, TB managerial teams were formed at state level to provide continuous supervision, consultation and support and to ensure seamless co-ordination at all levels of care with available resources (Reference Ismail and MartinezIsmail & Martinez, 1974; Reference Suleiman and JegathesanSuleiman & Jegathesan, n.d.).
The rapid expansion of rural health facilities and services between the 1960s and 1970s and its linkages to district and general hospitals contributed to the reduction of morbidity and mortality from CDs. However, most of the disease control programmes included a unilateral (one-way) referral system from clinics to primary/district hospitals or national referral hospitals, and this system soon became established as the norm in the health services. The lack of a counter-referral system was workable when the country dealt with CD control that mainly required acute care and response. However, it would later create difficulties in the management of patients with diseases that required long-term care, such as NCDs and HIV.
6.2.2.2 Human Resources
Similar to the public sector health services, the disease control programmes relied on allied health personnel, including nurses, medical assistants, medical laboratory technologists and junior laboratory technicians rather than doctors. As discussed in Chapters 4, 5 and 8, this strategy enabled Malaysia to reach wider populations, especially those in rural areas, while there was a shortage of medical professionals. The allied health personnel received technical information and skills training and acted as front-line staff. For example, junior laboratory technicians trained by the Institute for Medical Research (IMR) did most of the sputum examination for TB (Reference CheongCheong, 2010). Allied health staff from rural health clinics assisted in case detection for malaria screening (Reference Jaafar, Suhaili, Mohd Noh and LeeJaafar et al., 2007). Not only did the front-line staff provide medical care, they also raised community awareness regarding early detection and treatment.
Staff employed by or deployed to the national disease control programmes were mostly from the same categories as those in the health services, and qualifications and employment conditions were the same. By the time the vertical programmes merged into the mainstream health services, economic and health service growth created the need for more of these personnel as well as the capacity to absorb them. Thus, career paths and absorption were not problematic, and the issue of redundancy was avoided.
6.2.2.3 Surveillance Systems
Each disease control programme developed a tailored surveillance system. For example, a central TB registry established in 1973 under the National TB Control Centre monitored TB cases. Chest clinics in hospitals in each state collected and compiled data for submission to the national level. The malaria eradication programme had a case registry system and entomological surveillance activities. Similarly, leprosy had a surveillance system.
Meanwhile, a standard epidemiological surveillance system had been developed for the Epidemiology Unit since 1971 (Reference Suleiman and JegathesanSuleiman & Jegathesan, n.d.). The separate surveillance systems were integrated into the standard epidemiologic surveillance system of the MoH during late 1980s and early 1990s when the vertical programmes merged into the mainstream. Although Malaysia has not evaluated the impact of the separate surveillance systems, it is possible to conjecture about both their advantages and their constraints. The dedicated surveillance and monitoring systems of the disease control programmes were probably of better quality because of special efforts in training, tighter supervision and less staff mobility. However, they would have created duplication and an additional burden on the reporting staff, particularly at the front line. However, the skills and experience gained through the better-quality surveillance in the vertical programmes probably carried over to the mainstream health services when the programmes merged.
6.2.2.4 Community Education and Mobilisation
The disease control programmes used the same strategies of community mobilisation and education as used successfully in primary healthcare (PHC), using local community organisations, particularly in rural areas (see Chapter 4). Also, the MoH programmes partnered with major non-governmental organisations (NGOs), which earlier had advocated for national disease control efforts, mobilised funding from civil society and developed care models. Examples are the Malaysian Leprosy Relief Association (MaLRA) and the Malaysian Association for the Prevention of Tuberculosis (MAPTB). Evidence of the success of such efforts is, for example, the fact that over 80% of registered TB cases in 1975–79 were self-referred by symptom-motivated patients (Reference CheongCheong, 2010). Not only did such partnerships address ignorance, scepticism and cultural prejudices, they also established practical measures for facilitating and supporting individuals and families to benefit from the disease control efforts. Examples include the provision of a TB allowance to compensate for travel and sickness absenteeism, and the provision of living allowances as well as housing and income-generation opportunities in sheltered communities for cured leprosy patients who carried the stigma that isolated them from their own communities (Reference Suleiman and JegathesanSuleiman & Jegathesan, n.d.).
However, there were failures. For example, resistance by the population in Sabah to spraying with DDT (dichlorodiphenyltrichloroethane) under the malaria control programme in the 1980s is attributed to the lack of engagement with the communities and failure to understand local needs and concerns (Reference RahmanRahman, 1982; Reference Mak, Jegathesan, Lim, Hakim, Rain, Ambu and ChongMak et al., 1992; Ministry of Health et al., 2015).
6.2.2.5 Introduction and Availability of Vaccines and Effective Medicines/Medical Products
The introduction of new technology, vaccines and medicine contributed to the prevention, early detection and control of CDs. The incidence of childhood TB declined sharply in the 1970s after the introduction of the BCG vaccination programme (Reference CheongCheong, 2010). Effective treatment such as single-dose penicillin with 2% aluminium monostearate (PAM) for yaws (Reference LoLo, 1985), multiple drug therapy (MDT) for leprosy and a shorter duration of TB treatment (from two years to six months) led to reductions in morbidity (i.e. deformity among leprosy patients) and mortality rates (Reference LoLo, 1985; Reference JayalakshmiJayalakshmi, 1994; Reference CheongCheong, 2010). The IMR played a significant role in introducing new vaccines and diagnostic tests in the early days (Box 6.2).
The production of vaccines for cholera, typhoid, plague, smallpox and rabies was started by the IMR in the 1940s (Reference Ramanathan, Cheah and DonderoRamanathan et al., 1976). The IMR initiated field trials and developed them as a standard protocol before any new vaccines were released to the public. In 1986, a trial on measles vaccines was conducted by the MoH and supported by the IMR before it was included as part of the national immunisation programme (UN Country Team, 2005).
The IMR acted as a central reference laboratory for the whole country for more specialised diagnostic and public health laboratory tests for diseases such as yaws, typhoid and cholera (Reference Ramanathan, Cheah and DonderoRamanathan et al., 1976).
6.2.2.6 Outcomes
The BCG vaccination programme realised its initial objective of providing at least 75% coverage of the susceptible population within a short period (Reference Ismail and MartinezIsmail & Martinez, 1974). The mass survey and treatment campaign with PAM under the yaws control activities also reduced the reported cases from 9,462 in 1958 to 335 in 1968 (Reference LoLo, 1985).
The incidence of most CDs declined dramatically (Figure 6.1). The incidence of TB declined from 151.5 per 100,000 population in 1961 to 56.8 per 100,000 population in 1985 (Reference Suleiman and JegathesanSuleiman & Jegathesan, n.d.); malaria cases reduced significantly from 150,000 to below 50,000 in the late 1970s, but the goal of disease eradication had yet to succeed fully (Reference Mak, Jegathesan, Lim, Hakim, Rain, Ambu and ChongMak et al., 1992). Yaws and filariasis were no longer a concern; the country had successfully eliminated leprosy in 1994 and achieved polio-free status in 2000 (Reference Suleiman and JegathesanSuleiman & Jegathesan, n.d.). With the increase of childhood immunisation coverage (Table 6.2), the infant and child mortality rates had also declined significantly in 1990 (Table 6.3).
| % of childhood immunisation coverage | 1970 | 1980 | 1990 | 2000 | 2010 | 2016/17 |
|---|---|---|---|---|---|---|
| BCG for infants | 46.6 | 88.2 | 97 | 99.3 | 99 | 98.55 |
| DPT (diphtheria, pertussis, tetanus) for infants (3rd dose) | 15.0 | 67.0 | 89.9 | 98.7 | 101.14 | 99.34 |
| Polio for infants (3rd dose) | 15.0 | 72.0 | 89.6 | 93.4 | 94.13 | 99.34 |
| Measles/MMR (measles, mumps, rubella) for infants | 10.0 | 20.0 | 87.1 | 93.9 | 96.1 | 88.8 |
| 1957 | 1970 | 1983 | 1990 | 2000 | 2010 | 2016/17 | |
|---|---|---|---|---|---|---|---|
| Infant mortality rate (per 1,000 live births) | 68.9 | 39.4 | 20.2 | 13.1 | 6 | 6.7 | 7.3 |
| Neonatal mortality rate (per 1,000 live births) | 29.6 | 21.4 | 12.3 | 8.5 | 3.1 | 4.3 | 4.2 |
| Toddler mortality rate (per 1,000 population aged 1–4 years) | 8 | 4.2 | 1.7 | 0.9 | 0.5 | 0.4 | 0.4 |
| Under-5 mortality rate (per 1,000 live births) | 110.4 | 55.9 | 26.6 | 16.8 | 7.9 | 8.5 | 8.6 |
The two programmes that failed to live up to their initial promise were those for TB and malaria. Although greatly reduced during the 1990s, TB incidence remained a problem. There were two contributing factors: first, the large concentration of foreign workers from neighbouring countries were a continual pool of infection. Local surveillance and control systems were ill-prepared to detect and manage them (Reference Suleiman and JegathesanSuleiman & Jegathesan, n.d.). Second, the HIV/AIDS epidemic brought with it an associated increase in TB due to impaired immune systems (Reference Suleiman and JegathesanSuleiman & Jegathesan, n.d.). The treatment modalities available at that time and programme strategies were inadequate for addressing this threat. For malaria, although incidence declined significantly, pockets of transmission and endemic levels persisted. There were several contributing factors, including people movement that was difficult to monitor, insecticide resistance, drug resistance and changes in vectors.
The role of feedback loops in CDs is well known among epidemiologists. They use stock-and-flow models, such as the susceptible-infectious-recovered (SIR) model, to predict and curb the spread of disease. Successful control of CDs relies on disrupting biological transmission feedback loops via vaccination, quarantine, culling of vectors, etc. The wide acceptance of such models in the health profession provides a useful entry point to many important system dynamics concepts.
6.3 The Next 30 Years: The Era of the Integrated/Horizontal Approach to Disease Control (Mid-1980s to the Present)
6.3.1 The Changing Disease Profile
6.3.1.1 The Rise of Non-communicable Diseases
After the late 1980s, socio-economic development, urban migration, changes in work and lifestyles, and demographic transition to fewer children and more people of working age resulted in an evolving disease profile (see Chapter 3). NCDs such as cardiovascular disease, diabetes mellitus and cancer emerged as major contributors to the disease burdens (Supplementary Table 6.a). There was also a shocking rise in the prevalence of NCD risk factors over the years, as shown in the National Health and Morbidity Surveys (NHMS) (Table 6.4). In 2016, NCDs accounted for 74% of all deaths (World Health Organization, 2018), while NCD-related morbidities and disabilities had increased by 80% between 1990 and 2013 (Ministry of Health Malaysia & Harvard T. H. Chan School of Public Health, 2016).
| NCD risk factor | 1996 (%) | 2006 (%) | 2011 (%) | 2015 (%) |
|---|---|---|---|---|
| Diabetes mellitus | 8.31 | 11.6 | 15.2 | 17.5 |
| Hypertension | 29.91 | 32.2 | 32.7 | 30.3 |
| Hypercholesterolemia | − | 28.2 | 43.9 | 47.7 |
| Overweight | 16.6 | 29.1 | 29.4 | 30.0 |
| Obesity | 4.4 | 14.0 | 15.1 | 17.7 |
| Physical inactivity | − | 43.7 | 35.2 | 33.5 |
| Smoking2 | 24.83 | 21.54 | 23.14 | 22.84 |
| Alcohol (current drinker) | − | 7.4 | 11.6 | 7.7 |
1 Data for population aged ≥30 years.
2 Data for population aged 15 years and above.
3 NHMS II definition: respondent who reported to be smoking at the time of the survey.
4 Centers for Diseases Control and Prevention (CDC) definition: respondent who reported to have smoked ≥100 cigarettes in their lifetime and smoked daily or some days in the past 1 month.
6.3.1.2 Emerging and Re-emerging Infectious Diseases
Since the 1990s, Malaysia has experienced emerging diseases, including HIV infection, dengue, Nipah virus and severe acute respiratory syndrome (SARS), and re-emerging diseases, including resurgent TB and measles, while malaria persisted in endemic areas, perpetually threatening to spread to other areas. (Table 6.5).
| 1990 | 1995 | 2000 | 2005 | 2010 | 2017 | |
|---|---|---|---|---|---|---|
| HIV | 4.30 | 20.30 | 26.97 | 23.42 | 12.89 | 10.33 |
| Dengue fever | 9.54 | 10.68 | 58.93 | 60.71 | 148.73 | 257.6 |
| Dengue haemorrhagic fever | 1.29 | 1.87 | 3.82 | 14.23 | 1.25 | |
| Tuberculosis | 61.2 | 56.93 | 63.29 | 61.20 | 68.25 | 80.78 |
| Measles | 3.17 | 3.16 | 2.83 | 5.39 | 0.26 | 5.28 |
The first case of HIV was detected in 1986, and by 2017, there were a cumulative 115,263 HIV cases (Ministry of Health, 2018a). Initially confined largely to injecting drug users (IDUs), sexual transmission thereof became more prevalent in recent years and has proved a challenge to control measures. First recognised as a public health issue in 1973, dengue incidence has increased tremendously, from 969 cases in 1973 to more than 100,000 cases, with 200 deaths per year, since 2014 (Ministry of Health, 2016).
The factors contributing to the emergence of new diseases or the resurgence of longer-standing diseases are complex and include population movements and lifestyle changes, globalisation and the movement of goods, adaptive mutations in pathogens and vectors, and environmental changes that facilitate or support changes. Table 6.6 shows the illustrative key features of emerging diseases in Malaysia.
| Year | Virus | Location | Relevant features illustrating the complexity of the disease |
|---|---|---|---|
|
| Sibu |
|
|
|
|
|
| 1998 |
|
| • Previously existing as infection in pigs, the virus adapted to infect humans, causing fever, encephalitis and a high mortality rate of about 40%. Genotyping and epidemiological studies in Malaysia and several neighbouring countries resulted in better understanding of natural reservoirs of the virus family and raised the international alert on potential danger in the future. |
|
| Kuala Lumpur |
|
| Avian influenza H5N1 |
| • Highly pathogenic virus originating in poultry. Adaptation to infect humans, causing fever; deaths reported in other countries. Outbreaks detected in poultry in Malaysia. Linked to fighting cocks smuggled from neighbouring countries. Rapid and effective control measures prevented the spread to humans. |
The Nipah virus outbreak in 1998–1999, SARS in 2002–2003 and the H1N1 pandemic influenza in 2009 not only posed an increased healthcare burden but also caused social disruptions and economic loss. Up to 40% of cases, or 105 people, with acute encephalitis (out of 265 cases) died during the Nipah virus outbreak (Reference Looi and ChuaLooi & Chua, 2007), while H1N1 caused 77 deaths (out of 12,307 reported cases) in 2009, the majority of whom were children (Reference SamSam, 2015).
Meanwhile, re-emerging diseases such as TB and measles continue to be a public health challenge. TB cases per 100,000 population declined over 30 years from 350 cases to about 60–68 cases but increased to about 84 cases in the subsequent 30-year period (Ministry of Health, 2016). Similarly, despite a strong childhood immunisation programme, measles increased during the 30 years after 1990, from an incidence of 3.1–5.18 per 100,000 population, and one-third of the cases during the recent 2-year period involved children who had never been vaccinated (Ministry of Health, 2016).
6.3.2 Drivers of Change in the Responses to the Disease Profile
6.3.2.1 Health Information Systems
Improved information systems provided information that spurred policy-makers and leaders in the health sector to review and revise national strategies for disease control (see Chapter 10). For example, surveillance systems provided information on emerging and re-emerging CDs. The NHMS provided evidence of the rapid increase and high levels of risk factors and disease prevalence for NCDs, while NCD disease registers provided information on disease trends and disease burdens, early detection and effective control. In some cases, the information also energised social activists to advocate for revised approaches, for example, for HIV/AIDS.
6.3.2.2 International Movements
International movements such as the United Nations’ millennium development goals (MDGs), sustainable development goals (SDGs) and the WHO Framework Convention on Tobacco Control (FCTC, ratified on 16 September 2005) served to focus attention and provide impetus for stronger efforts. For example, in 2005, the Cabinet Committee on AIDS agreed to pilot test a harm reduction programme for HIV prevention among IDUs despite it being incompatible with the country’s zero-tolerance policy on drugs (see Case Study 6.1). In 2018, the Cabinet Committee decided not to reintroduce ‘kiddie pack’ cigarettes (packs of ten) despite the possibility of increasing tax revenue (Bernama, 2018).
International concerns about cross-border transmission of emerging diseases contributed to stronger collaboration and co-ordination between Malaysia, regional and international agencies such as the ASEAN1 and the WHO2, and bilateral co-ordination with neighbours (e.g. the Thailand-Malaysia Border Health Goodwill Committee, the Health Task Force of the Asia-Pacific Economic Cooperation (APEC) group) (Reference Barraclough and PhuaBarraclough & Phua, 2007).
6.3.2.3 Leadership, Governance and Competing Priorities
The examples of cross-sectoral collaboration for NCDs quoted above also provide evidence of the government’s commitment and the influence of leaders from the health sector and of the MoH in shaping policy that transcended several sectors. However, balancing the competing priorities in health with other opportunities for economic growth and development remains a challenge for Malaysia, especially in NCD prevention. Several factors and entities outside of health have considerable influence. For example, food, beverages and tobacco are deemed promising industries for driving growth in the manufacturing sector in the Eleventh Malaysia Plan (2016–20). However, they might not contribute to the promotion of a healthy lifestyle for reducing CDs and NCDs (Economic Planning Unit, 2015). Population health outcomes require multi-actors and sectors to work together to address social, economic and environmental risk factors. There is top-level commitment in the form of a Cabinet-level committee comprised of ministers from various sectors and chaired by the deputy prime minister and several task forces for establishing priorities and developing strategies (Box 6.4).
However, progress in translating the top-level commitment into genuine collaborations across ministries and agencies is slow, especially at implementation level. The MoH faces a continuing challenge to advocate for and create an enabling environment and an integrated approach for implementing multi-sectoral strategic plans. Such plans require the acceptance of roles, responsibilities and incentives for each agency to contribute to disease control efforts as well as for monitoring and evaluation mechanisms to track performance and accountability.
| Communicable diseases | Non-communicable diseases |
|---|---|
National committee/task force
Laws and regulations
National Strategic Plan (NSP)
| National committee/task force
Laws and regulations
National Strategic Plan (NSP)
|
6.3.2.4 Programme Management and Service Delivery
Disease control programmes require considerable structural and functional change to address the changing epidemiologic picture. The previous national control programmes for CDs had tightly knit management structures at MoH level, together with a high level of authority. Hitherto, leadership for managing NCDs had primarily been the purview of various clinical disciplines, such as cardiology, nephrology or oncology. The introduction of a more holistic perspective to NCD control required a more collaborative management structure that allowed inputs from various disciplines and shifted the focus from patient care to population outcomes. This required shared leadership between public health, clinical and laboratory specialist disciplines. Inevitably, the authority structure and interrelationships changed. Also, disciplines that had previously worked within a small circle of related disciplines had to gain competence in collaborating at multi-sector level and aim at population-wide behaviour change, working with communities and using mainstream and social media.
The Epidemiology Unit, previously established under the Health Division of the MoH in 1971, had focused on CDs. It was re-organised in 1992 (Reference Suleiman and JegathesanSuleiman & Jegathesan, n.d.) to expand its scope to include NCDs, disease surveillance, HIV/AIDS, vector-borne diseases, occupational and environment health and tobacco control, and public health laboratories. Its responsibilities include policies, planning and strategic management, building integrated and collaborative efforts with other agencies including healthcare providers in the private sector, and providing a platform within the MoH to co-ordinate inputs from the various clinical disciplines as well as with the research institutions3 that provide laboratory expertise or programme evaluation and investigative skills.
As discussed in Chapters 4 and 5, since the early 1990s, the service delivery system was re-organised and upgraded with the appropriate technology and staff, particularly at the primary care level, to strengthen comprehensive management of CDs and NCDs. Box 6.5 provides examples of the initiatives. Public sector clinics have standardised clinical management protocols to guide service providers, but the process of placing fully trained multi-disciplinary teams is a slow, ongoing process and far from complete (see Chapter 4). For example, healthcare providers’ insufficient interpersonal and communication skills contributed to gaps in managing diabetic patients (Reference Lim, Aagaard-Hansen, Mustapha and Bjerre-ChristensenLim et al., 2018). Reference ChanChan (2015) highlighted the need for trained diabetic nurse educators to empower patients for self-care. Additionally, efforts at addressing NCD management are hampered by inadequate referral systems, lack of continuity of care between primary, secondary and tertiary care, and inadequate involvement of private general practitioners in the co-ordinated management of NCDs (see Chapters 4 and 5).
1995: Breast self-examination (BSE) and annual breast examination by trained health workers
1996: Decentralisation and transfer of general outpatient services in hospitals to PHC clinics
1998: HIV screening and management services such as prevention of mother-to-child transmission (PMTCT) programme
2000 onwards: Integration of diabetes screening and management, methadone services for IDUs, management of other NCDs
NCD monitoring evolved from early ad hoc initiatives from various clinical disciplines that established patient registries4 to monitor their disease speciality. This resulted in over 31 separate disease registries by 2012, most of which had resource constraints. There were over 70 databases with no linkages to each other, and data standards varied (Clinical Research Centre, 2012). Efforts to centralise the registries and standardise the quality of data face several challenges, including the lack of resources (workforce, funding and information communication technology (ICT) infrastructure), a governing body and data sharing between registries. The more successful registries are those that deal with single diseases or interventional entities and that require data input from fewer sources. Examples are the renal and cataract registries that contribute to continuous improvement in quality of care.
Recognising the high cost of managing and treating NCDs, the MoH adopted a key strategy of encouraging healthier lifestyles that would reduce NCD risk factors in the community. A series of national healthy lifestyle programmes targeted at the general population (Reference Suleiman and JegathesanSuleiman & Jegathesan, n.d.) disseminated key messages through a variety of channels. Also, specially designed community mobilisation efforts were implemented to empower communities to foster behaviour change with the involvement of multiple agencies such as the Ministry of Education and the Ministry of Information. Despite these efforts, diabetes, obesity and overweight increased dramatically, and smoking rates remained unchanged (Table 6.4). Malaysia has yet to find effective means of addressing these challenges.
The health system had to respond to emerging and re-emerging CDs with better tools for rapid diagnosis, rapid and effective analysis of epidemiological data and rapid response capability to control outbreaks – this required sophisticated technology at multiple levels: field, laboratory, clinical and digital information. The effort required financial resources and higher levels of competency in human resources. The continuing burden of dengue, malaria and TB required multi-agency collaboration.
Earlier years had seen the development of surveillance and systems to respond to CD outbreaks. The new challenges, illustrated in Table 6.6, resulted in further evolution, and the key milestones in Box 6.6 demonstrate the range of stakeholders and activities involved.
1999: Inter-ministry committee for the control of zoonotic diseases
2002: Epidemic intelligence programme
2006: National influenza pandemic preparedness plan
2007: Crisis preparedness and response centre
2008: Risk communication plan
New procedures required the district health office to act as a gatekeeper to collect data routinely from a wider range of stakeholders, including health facilities in the public and private sectors, such as laboratories, clinics and hospitals (clinical-based surveillance); the Department of Veterinary Services and FOMEMA (Foreign Workers’ Medical Examination); and communities (Ministry of Health, 2004).
Monitoring systems established by the earlier national control programmes for CDs such as TB had been merged into the mainstream by 1995, whereby district health offices were the nodal points for integrating data from hospitals and clinics. Nevertheless, at the national level, separate programme entities maintained some elements of their original structure. For example, the chest clinics maintained their own TB registry, and most of the district health offices had limited access to such data, leading to a lower priority for TB control (Ministry of Health, 2002). The situation only improved in 2002 when the National TB Information System (TBIS) gave the district health office full responsibility for co-ordinating and monitoring the information. Nonetheless, contact tracing for CDs such as TB and HIV remains a concern, particularly among the key populations, that is, migrant and rural populations, including the indigenous populations (Reference Suleiman and JegathesanSuleiman & Jegathesan, n.d.).
The health system has frequently struggled when it has had to change human behaviour for successful disease control. Health promotion often follows a knowledge gap theory, assuming that providing the right information will yield the right behaviour, but with very limited results. Positive feedback from unhealthy behaviour – for example, the satisfaction from eating unhealthy foods – is often immediate, whereas negative feedback – for example, cardiovascular disease – is distant, vague and uncertain. More immediate feedback that promotes healthy behaviour and discourages unhealthy behaviour, such as social approval, may provide useful tools for individual behavioural change. On a larger scale, we need to consider what types of feedback loops will create health-promoting environments.
6.4 Conclusion
Malaysia has successfully reduced the burden of several CDs through time-limited dedicated programmes aimed at specific diseases. These programmes largely avoided the well-known disadvantages of vertical programme approaches. There are several contributing factors: programme designs recognised and relied on the existing and developing healthcare delivery system. Thus, at the front line, service delivery was in the hands of the PHC providers.5 This avoided unnecessary duplication and inefficiencies and subsequent potential redundancy and wastage of human resources and physical facilities. On the other hand, the dedicated vertical approach enabled the development of competencies in programme management, supervision, monitoring and evaluation that later transferred to the public health sector. Conceivably, reliance on domestic and not foreign funding ensured that programme design was accountable to domestic authorities and therefore aligned to national health and development priorities and strategies. (Other chapters elaborate on these priorities and strategies.)
Emerging and re-emerging infectious diseases pose continuing challenges, some of which have been easier to address. The underlying factors are the adaptive behaviour of pathogens, changes in the habits and immune levels of communities that expose them to virulent pathogens, and changes in the environment that facilitate change in either pathogens or humans. There is insufficient knowledge on how the emergence of a new disease can be prevented. Therefore, health systems rely on rapid recognition and effective control of outbreaks. Quick to recognise that Malaysia has the climatic and geographic features that place it at risk of emerging diseases, particularly those arising from zoonotic pools of infection (Ministry of Health, 2002; 2004), the country rapidly developed the capacity for early recognition and containment of outbreaks (Reference LimLim, 1999). There has been less success in dealing with re-emerging diseases caused by human behaviour such as migration and drug use or by the adaptive behaviour of pathogens and vectors compounded by human behaviour, such as antibiotic-resistant microbes and dengue.
Malaysia has had less success in the field of NCDs. The reasons for this are unclear. The range of diseases is much broader and their causative and contributory factors more varied. For some, such as several neoplastic diseases, medical knowledge about their prevention and management is limited. For others, such as cardiovascular and metabolic diseases, the contributory factors require a change in human behaviour, which is complex and dependent on a wide variety of influences. The health sector has yet to devise effective means of addressing many of those influences.
6.5 Key Messages from Malaysia’s Experience
6.5.1 What Went Well?
The design of disease-specific control programmes, as far as possible, used existing healthcare delivery systems. They also developed specific competencies in programme management, supervision, monitoring and evaluation, which later transferred to the public health delivery system.
The health system rapidly developed the capacity for prompt recognition and effective control of outbreaks of new diseases, as knowledge on prevention was insufficient.
6.5.2 What Didn’t Go So Well?
7.1 Introduction
The protection and management of the natural and built environment and monitoring its relation to and impact on health are important components of any country’s health system. The ever-expanding global population and increasing urbanization place a strain on the environment and create new risks and exposures that exacerbate health problems. The first line of defence in disease prevention is controlling the physical, chemical and biological agents in the environment that have the potential to affect populations. Thus, every aspect of the environment that impacts on health falls within the scope of environmental health services (EHS). Clean water, safe disposal of solid waste and wastewater, vector and rodent control, air pollution control, food quality control and climate change are just some examples. In this chapter, we focus on providing a broad overview of the evolution of EHS in Malaysia as part of the overall health system.
7.2 Overview of EHS and Its Evolution in Malaysia
In the 1960s, after independence, 70% of the population was poor and resided in rural areas (see Chapter 3). Limited water accessibility and communicable diseases were major problems, which were addressed by the Rural Environmental Sanitation Programme (RESP), an integral component of the Rural Health Services (Reference Suleiman and JegathesanSuleiman & Jegathesan, n.d.). Highly effective community mobilization by allied environmental health officers and technical expertise from engineers trained in public health are credited as two success factors of the RESP, which achieved high levels of coverage and drastic reduction of the disease burden from waterborne diseases.
With increasing economic development, more than 70% of the population moved to urban areas, life expectancy increased, and there was a decline in infant mortality rates and incidence of communicable diseases (see Chapter 3) (Ministry of Health Malaysia, 1988–2017). However, population growth, increasing urbanization and industrialization introduced other environmental hazards, creating the need to address a wider range of environmental health issues such as sewerage, water quality, solid and hazardous waste, and radiation protection.
EHS in Malaysia began in an organized and structured manner with the establishment of the Environmental Health Engineering Programme in the Ministry of Health (MoH), pioneered by engineers seconded from the Public Works Department (PWD) in the 1970s. This pool of engineers, often assisted by sanitary engineers from the World Health Organization (WHO), went on to strengthen the EHS as an integral part of the MoH’s public health programme.
As the Constitution of Malaysia apportions responsibility for health to the federal government, and water supply and urban sanitation to state and local governments, the responsibility for managing EHS was split among different government agencies (see Chapter 12).
To provide leadership and the relevant authority, some public health engineers were seconded from the MoH to some of these departments. Thus EHS in Malaysia grew primarily because of the leadership and governance role the MoH took. EHS established an organizational structure and staffed it with trained personnel while at the same time empowering the organizational units with the required funding. The initial batch of public health engineers provided the leadership on the ground to support the health inspectorate and health officers. Human resources training and development were crucial to achieving success. Environmental health was introduced into postgraduate public health programmes. Engineers who had training in public health helped to upgrade the training of health inspectors and health overseers. The upgraded three-year course for health inspectors (see Chapter 8) included aspects of newer technologies in wastewater treatment, water treatment and waste disposal. Also, environmental health was included in the training of microbiologists and biochemists. Expertise was shared with other ministries and departments. The WHO contributed by establishing the Centre for the Promotion of Environmental Planning and Applied Studies (PEPAS), which conducted valuable research and training programmes that in turn led to policy and programme formulation such as the National Solid Waste Management Strategy (WHO Western Pacific Region, 1977). Introducing health impact assessment (HIA) to other agencies for development projects was a concerted effort using many existing channels available at the state and federal government levels (Reference Hashim and HashimHashim & Hashim, 2009).
7.2.1 Examples of Malaysia’s EHS Programmes
Some of the main environmental health programmes that were developed successfully are described in this section.
7.2.1.1 Rural Environmental Sanitation Programme (RESP)
Concerns about the quality of water supply and sanitation led to an environmental survey of Peninsular Malaysia in 1968. It revealed that only 3.6% of the population had piped water, while 85.3% used water from unprotected wells and 11.1% from untreated surface water (Reference Pillay, Sinha and Mohd TalhaPillay et al., n.d.). As a result, an environmental sanitation pilot project was carried out. The pilot project indicated that a national environmental health programme needed to have four basic elements to succeed: community participation, health education, appropriate technology and training. The initial efforts of EHS were directed to rural areas of the country that lacked safe water supply and sanitation and were plagued by waterborne diseases (Reference Suleiman and JegathesanSuleiman & Jegathesan, n.d.). The national programme was successful in increasing coverage of the rural population of safe water supply to 68.6% and sanitary latrines to 72.5% in 1987 (Ministry of Health Malaysia, 1989). This coverage reached 93.5% for safe water supply and 98.2% for sanitary latrines in 2000 (Ministry of Health Malaysia, 2002). The MoH had contributed to 22.2% of the water supply for rural communities. The MoH provided a high percentage of water supply in states such as Sarawak (62.3%), Sabah (43.5%), Kelantan (32.5%) and Terengganu (30.4%) (Reference Pillay, Sinha and Mohd TalhaPillay et al., n.d.).
This programme was not only a paradigm shift, with the MoH taking on a function that was traditionally that of state governments and the PWD, it also became an important programme under the MoH public health programmes. It complemented the other programmes, such as communicable disease control, vector hygiene, food quality control and others, and was implemented in all states (Ministry of Health Malaysia, 1988). The Environmental Health Engineering Unit grew and was later expanded with the recruitment of more public health engineers and health inspectors. The unit provided the needed policies, technical guidance and training, and it also monitored budget allocations. Initially, public health engineers were stationed in critical states such as Kedah, Perak, Pahang, Terengganu and Kelantan, but they are now present in every state nationwide. Health inspectors were trained in appropriate technologies for rural water supply and sanitation. RESP, later called the BAKAS (Bekalan Air dan Kebersihan Alam Sekeliling) or Water Supply and Environmental Sanitation Programme, clearly demonstrated the close interaction between the different levels of government. The federal government provided the funds and technical advisory services while the state governments provided the needed managerial support through the district levels right up to the village action committees (Reference Suleiman and JegathesanSuleiman & Jegathesan, n.d.). This was a key success factor, as was the people’s involvement through community participation (see Case Study 7.1 for more details).
One of the challenges in the application of systems thinking is that the actual system surrounding a particular problem often does not correspond to disciplinary or organizational structures. Therefore, solutions to these problems are often partial, with partial results. Indeed, while the ‘social and environmental determinants of health’ is a well-known concept, it largely remains on the periphery of health systems. A whole-system approach towards environmental health requires interfacing with non-health sectors as well as re-thinking the responsibilities and functions of the health system. The expansion of the MoH to create an engineering department and take on the task of rural water and sanitation is an excellent example of such cross-boundary work. Future advances in tackling non-communicable diseases are likely to require such re-thinking of what health services look like.
7.2.1.2 National Drinking Water Quality Surveillance Programme (NDWQSP)
Having succeeded in the BAKAS programme, the MoH engineering unit was entrusted with monitoring the quality of urban water supplies. This decision was made following a survey in 1983 that attributed the outbreak of diseases to poorly operated water supply systems. This programme, known as the National Drinking Water Quality Surveillance Programme (NDWQSP), had the objective of improving the standard of health by ensuring the safety and acceptability of public water supply systems (Reference Suleiman and JegathesanSuleiman & Jegathesan, n.d.). The components of the programme included monitoring, sanitary surveys, data processing and evaluation, remedial action and institutional examination such as evaluating the capacity of the water supply agency to perform its functions. Under the programme, all public water supplies were monitored, and samples were sent to the Department of Chemistry (DOC) for bacteriological and chemical analysis (Reference Pillay, Sinha and Mohd TalhaPillay & Sinha, n.d.). The relevant water authority was required to take immediate action if there were any violations of the standards set by the MoH. A quality assurance programme (QAP) was formulated in 1993 to strengthen the effectiveness of the programme (Reference Suleiman and JegathesanSuleiman & Jegathesan, n.d.). By 2001, the percentage of water samples that met the national standards of bacteriological quality, residual chlorine and turbidity was 98%, 96% and 96%, respectively (Reference Pillay, Sinha and Mohd TalhaPillay & Sinha, n.d.).
Significant co-operation was established between the state governments, water authorities and relevant agencies such as the DOC, the Department of Environment (DOE) and the federal Drainage and Irrigation Department as well as local authorities. The reports generated under this programme were presented at state- and federal-level meetings and critically examined by many agencies. The training of water operators and health inspectorate staff and public health engineers, coupled with inter-departmental co-operation, were key success factors of this programme. Due to the limited capacity of the DOC, the MoH also developed its water testing capabilities (Ministry of Health Malaysia, 1988) by purchasing field test kits and training the health inspectorate staff and public health engineers on their use.
The leadership and promotional role of the MoH was important in the absence of legislation. The Safe Drinking Water Act was drafted in the 1980s but never came into force for numerous reasons. However, since then, the National Water Services Commission (SPAN) has been formed to address some of the constitutional problems, such as division of responsibility and authority between federal and state government, and the Water Services Industry Act 655 was formulated and enforced in 2008 (National Water Services Commission, 2019).
7.2.1.3 Urban Sanitation
The role played by public health engineers at the state level was recognized as crucial, and over time they played a key role in advising state governments of the sad state of urban sanitation. Together with the Economic Planning Unit (EPU) of the Prime Minister’s Department, the MoH engineering unit initiated Master Plan Studies on sewerage and drainage in many towns (Economic Planning Unit, 1981). Such studies identified a grave concern: bucket latrines were widely used in urban centres. Eliminating bucket latrines became a priority, together with studies on suitable sewerage systems for larger towns.
Other than bucket latrines, individual septic tanks were the predominant disposal system. Substantial funds were needed to convert centralized sewerage systems and this would, therefore, take a long time. The MoH adopted an incremental strategy by promoting the use of centralized sewerage systems as opposed to individual septic tanks (Reference Ujang, Ujang and HenzeUjang, 2006). All new development projects were directed to follow the guidelines developed by the MoH and to instal centralized sewerage systems with treatment plants such as oxidation ponds. There was no legislation at that time; this was purely based on the MoH’s insistence and promotion through its expanded numbers of well-trained public health engineers (Reference Ujang, Ujang and HenzeUjang, 2006).
Similar efforts were made in solid waste management. All urban centres had poor waste management systems. Open burning was rampant. Crude landfills were the norm. With support from the WHO, the MoH initiated national forums to develop strategic plans for waste management. Through the environmental health engineering programme, the MoH also provided support to the Prime Minister’s Department and the Ministry of Housing and Local Government (MHLG) in matters related to sewerage, urban waste management, urban drainage and urban environmental management (Reference Ujang, Ujang and HenzeUjang, 2006; Ministry of Housing and Local Government, Malaysia, 2005).
In 1980, a special technical unit with engineers seconded from the MoH was formed to serve as the technical arm of the Local Government Department of the MHLG. This unit provided technical advisory services to all local authorities and state governments. Numerous studies were undertaken, and guidelines were developed. A major achievement was the total elimination of the bucket latrine system. Policies for urban sewerage systems became entrenched in local development plans, and efforts moved towards the formulation of laws on sewerage and waste management (Reference Ujang, Ujang and HenzeUjang, 2006). This then progressed to the privatization of both the national sewerage service and the municipal waste management services. The enactment of these laws and privatization were unprecedented moves by the federal government to take over services traditionally performed by state and local governments. It paid off handsomely, as this led to the systematic development of these two services throughout the country (Japan International Cooperation Agency (JICA), Malaysia Office, 1999).
The privatization of sewerage services was undertaken through the enactment of the Sewerage Services Act, which allowed the federal government to take over the responsibility for sewerage services, which was a traditional function of local authorities. A national sewerage company called Indah Water Konsortium (IWK) was established (Japan Sanitation Consortium, 2011). IWK took over all sewerage assets from local authorities and moved to upgrade and maintain these systems to acceptable standards by ensuring all domestic wastewater was adequately treated before discharging to surface water (Sewerage Services Department, Ministry of Housing and Local Government, 2001). Another significant move was the creation of the Sewerage Services Department (SSD) to regulate sewerage services, and this was staffed with engineers seconded from the MoH (Reference Ujang, Ujang and HenzeUjang, 2006).
7.2.1.4 Clinical Waste Management
Recognizing the hazardous nature of clinical waste generated in healthcare settings, the Engineering Division of the MoH undertook a national survey that highlighted the poor conditions in the handling, storage, transportation and disposal of clinical waste. The division went on to issue guidelines for the management of clinical and related waste in hospitals and healthcare establishments, followed by training for selected hospital personnel (Ministry of Health Malaysia, 1991). The gaps identified in the system were addressed by outsourcing clinical waste management to hospital support services. The rapid progress under this strategy was self-evident and is further outlined in Case Study 7.2 at the end of this chapter.
7.2.1.5 Air Pollution
Air pollution in Malaysia is generally at a low level except for sporadic incidents of haze during certain periods of the year. Maintaining good air quality sustainably throughout the year will drastically reduce the burden on the healthcare system. For this purpose, Malaysia built inter-departmental co-operation, involving agencies such as the DOE, the MoH, the Ministry of Transport, the Ministry of Natural Resources and Environment, the Meteorology Department and the Ministry of Foreign Affairs. The private sector was also mobilized by outsourcing air quality monitoring to a private company, Alam Sekitar Malaysian Sdn Bhd (ASMA), which has fifty-two monitoring stations throughout the country (Reference Sahani, Khan, Mahiyuddin, Latif, Ng, Yussof and ShinSahani et al., 2016).
As mentioned earlier, public health engineers were seconded from the MoH to the DOE, and they contributed to the formulation of the Environmental Quality Act 1974 (EQA) and its subsidiary regulations, which included among others the Clean Air Regulations. The MoH was a member when the Environmental Quality Council was launched in 1973, and its membership was subsequently formalized in the EQA. The council is responsible for advising the Minister of the then Ministry of Science, Technology and the Environment, now known as the Ministry of Natural Resources and Environment, regarding environmental matters, and this includes, among other things, air pollution (The Commissioner of Law Revision Malaysia, 2006).
The MoH also contributed the development of guidelines on indoor air quality (IAQ), which is under the purview of the Department of Occupational Safety and Health (DOSH), and continues to play a critical role in providing health advisory notices via news media, their website and so on. The MoH has also developed several guidelines on IAQ for healthcare settings and is training a pool of engineers to be certified by DOSH as indoor air quality assessors. To kickstart its IAQ programme, the MoH is currently focusing on sampling and monitoring air quality in its premises (Ministry of Health Malaysia, 1992).
7.2.1.6 The National Environmental Health Action Plan (NEHAP)
The NEHAP is a set of strategies jointly developed by relevant agencies and selected non-governmental organizations (NGOs) for improving environmental health in the country by specifying the roles and responsibilities of all parties. The WHO has encouraged all countries to embark on developing and implementing NEHAPs. The Malaysian Cabinet endorsed the NEHAP as a government policy in December 2012, and implementation is underway, with state governments assuming responsibility for formulating and implementing their respective State Environmental Health Action Plans (SEHAPs) (Reference Tuan MatTuan Mat, 2016). Some states, such as Sabah, Pahang, Perak and Melaka, have already started finalizing their SEHAPs, and the momentum is growing among other states (Reference Tuan MatTuan Mat, 2016). States’ adoption of the SEHAPs will be followed by the development of Local Environmental Health Action Plans (LEHAPs).
In order to be effective, NEHAP has to be given priority at all levels, including full participation and commitment from relevant agencies and NGOs, appropriate resource allocation and the enforcement of laws and regulations. The Engineering Services Division of the MoH facilitates and monitors the process by assuming the role of secretariat for the NEHAP, its steering committee, technical committee and the thematic working groups (TWGs). Eleven TWGs address various areas of concern such as vector-borne diseases, urban drainage and air quality as well as emerging issues such as climate change (National Environmental Health Action Plan, n.d.; Reference Tuan MatTuan Mat, 2016). The Division is also working with the Malaysian Space Agency (MYSA), formerly known as the Malaysian Remote Sensing Agency, to develop a geospatial risk map. This will be an invaluable tool for pre-empting adverse environmental health incidents.
Health impact assessments (HIA) have been incorporated as part of the Environmental Impact Assessment (EIA) process. The MoH undertakes the review of the components of EIA related to environmental HIA. Its importance is further emphasized by its inclusion as a TWG under NEHAP.
7.2.2 Factors Contributing to Success
The MoH rightly invested in environmental health programmes early on, which is believed to have significantly contributed to the country’s elevated health status. Other than investment, the hallmarks of the developmental process included leadership from the MoH in initiating and sustaining inter-agency collaboration and co-operation, human resource development and selective organizational strengthening, enactment of legislation and development of guidelines, and strategic involvement of the private sector while the public sector retained responsibility for policy and oversight.
Inter-departmental co-operation/organizational shift of responsibilities:
From the beginning, the MoH recognized that inter-departmental collaboration was vital, given that so many aspects of the human environment and activities have an impact on health. The MoH adopted two distinct modalities. In the case of rural water supply, the MoH took over the role that had traditionally rested with state governments and the PWD. In other cases, the MoH took the lead in spearheading the required changes and subsequently handing over authority to the relevant government departments (see Section 7.2.1.3). Spearheading change involved building technical and managerial capacity in other organizations and providing technical guidance and advice in various forms, including research, guidelines, formulation of legislation and creation of appropriate infrastructural capacity, for example, for chemical testing. However, the MoH maintained its responsibility for health by insisting that health matters be referred to it where relevant, for example, HIA in EIA for development projects. It continues to provide advice via the Environmental Quality Council (The Commissioner of Law Revision Malaysia, 2006).
Building human resource capacity:
Initially the MoH had to build its own capacity for environmental health. This was done by acquiring two engineers seconded from the PWD in the 1970s. They went on to develop a pool of public health engineers, some of whom were subsequently seconded to the DOE, MHLG, SSD, Solid Waste Department (SWD) and so on to spearhead change in those agencies and to help them recognize that their responsibilities encompassed not merely engineering perspectives but needed to expand to include environmental health perspectives. An outstanding outcome of this initiative is the formulation of the EQA and its subsidiary regulations, which provided for licensing and establishing standards for preventing, abating and controlling environmental pollution primarily from industries and shipping. Other outcomes include the enactment of the Sewerage Services Act 1993 and the Solid Waste and Public Cleansing Acts 2007.
Community participation:
In rural areas in particular, EHS succeeded by incorporating community involvement and participation in all programmes. Community participation helped to reduce the cost of projects and resulted in speedy implementation because the community leaders were motivated and wanted results quickly. There was shared ownership, and communities maintained the sanitation and water systems. The leadership structure in villages, such as the village action committee established under the government’s integrated rural development programme, helped with proper project planning and implementation. The series of health education campaigns by the district health offices also helped to mobilize the community. The support of local politicians further boosted effective community participation (Reference Suleiman and JegathesanSuleiman & Jegathesan, n.d.).
Private sector involvement:
The private sector complemented the role of the public sector in several ways. In the early years, the private sector was engaged to develop plastic pour-flush latrines for the RESP and later in developing Malaysian home-grown plastic hand pumps, water tanks and other accessories. The mass production of these essential items brought the cost to affordable ranges. Later, when the national privatization policy was introduced, the private sector played greater roles (Japan International Cooperation Agency (JICA), Malaysia Office, 1999). The public sector outsourced to the private sector the programmes for national sewerage development, including the urban solid waste management programme, clinical waste management and the monitoring of air quality throughout the country. The privatization policy helped to strengthen and further develop EHS in a systematic manner, as it allowed the government to focus on its primary functions of policy and oversight while the private sector delivered services. Under the privatization policy, the required funding mechanisms were also put in place with revenue generation opportunities. Various laws and regulations were enacted to delineate responsibilities among the various agencies and to set standards for service delivery (Japan International Cooperation Agency (JICA), Malaysia Office, 1999).
With outsourcing, the oversight function for ensuring that the private sector achieved good outcomes still rested and continues to rest with the government and its agencies. For example, when the clinical waste management service was privatized, the MoH engaged specialists to monitor the performance of the private concessionaires (Reference Suleiman and JegathesanSuleiman & Jegathesan, n.d.) against standards and guidelines and even introduced a fee deduction mechanism for non-performance or poor performance of the service. Similarly, when sewerage service was privatized, a new Sewerage Services Department was created to enforce the legislation. The government had to create standards, codes of practices and guidelines as well. Privatization does not absolve the government of its responsibilities.
Outsourcing has worked well in Malaysia and has fast-tracked many EHS programmes. Other countries seeking to privatize should carefully consider the selection of the privatization model and take into consideration that once a service is privatized, it is difficult to reverse it.
7.3 Key Messages from Malaysia’s Experience
7.3.1 What Went Well?
Basic rural interventions for water and human waste disposal used
◦ simple technology,
◦ strong community participation, and
◦ allied health staff delivered them effectively using established community structures.
Higher technological interventions requiring appropriate competencies were
◦ possible for concentrated urban populations (water, solid and liquid waste management);
◦ needed for complex issues (clinical waste, radiation);
◦ under the jurisdiction of authorities outside the health sector and needed inter-sectoral co-ordination.
The health sector successfully
◦ acquired and empowered staff with the appropriate competencies;
◦ provided leadership and assisted, then mentored, other agencies to develop the required competencies and exercise their powers through governance, outsourcing and oversight;
◦ mobilized private sector finance through outsourcing; and
◦ gained experience and expertise in outsourcing.
8.1 Introduction
This chapter explores how the Malaysian health workforce evolved over a 60-year period. It analyses the dynamic interactions between various forces in the health system and explores how broader societal elements such as education levels and economic growth; evolving epidemiological, demographic and behavioural patterns; and macroeconomic policies contributed to the dynamic interactions and influenced the subsequent outcomes for the health system.
This chapter does not attempt to provide a detailed profile of the Malaysian health workforce, as such information is available on the websites of the Malaysian Ministry of Health (MoH) (Ministry of Health Malaysia, 2016b) and the World Health Organization (WHO) (World Health Organization, 2014).
8.2 Post-independence: The Early Phase (1960s and 1970s) – Focus on Improving Access
During the years immediately after independence, the Malaysian population was largely rural and had relatively low literacy and high rates of maternal and infant mortality, vaccine-preventable diseases, malaria, tuberculosis, water- and soil-borne disease and malnutrition (see Chapter 3). The economy was doing well, with a steadily increasing gross domestic product (GDP). Guided by strong political considerations, the government implemented policies for rapid integrated rural development, focusing on infrastructure, education and healthcare (see Chapter 3). A nationwide rural health service developed rapidly (see Chapter 4), together with vertical disease control programmes for malaria, tuberculosis, filariasis, yaws and various food-, water- and soil-borne diseases (Chapter 6). Community mobilisation was a key feature of the development process. Table 8.1 summarises key drivers shaping the development of the workforce at this time.
| Population behaviour and demographic profile | Morbidity and mortality profile | Economy and macro policies | |
|---|---|---|---|
| Socio-economic ecosystem |
|
High rates of
|
|
| Health services | Education sector | Governance and financing | |
|---|---|---|---|
| Health and education sectors |
|
|
|
| Production of health workforce | Health workforce: key features | Outcomes | |
|---|---|---|---|
| Health workforce |
|
| Increased access to and use of basic health services in rural communities |
The rapidly expanding rural health programmes needed large numbers of healthcare workers close to rural communities. The interventions they needed to deliver were not too technically complex. The MoH concentrated on rapidly producing large numbers of allied health personnel (mainly nurses of different categories) to populate the rural health services. At this juncture, the government did not attempt to rapidly increase the number of doctors (Table 8.2). Several considerations underpinned this policy. First, entry competence for basic training was lower for allied health personnel than for doctors, so allied health candidates were more readily available, given the literacy levels at that time. Additionally, allied health personnel were more affordable. The challenge was to ensure the production of sufficient numbers of health personnel with the skills and competence to provide safe and effective care. To address this, training institutions for allied health personnel were placed under the control of the MoH rather than in universities under the Ministry of Education (MoE). At that time, the sentiment was that universities were too distant from the front-line of healthcare delivery and would focus on academic measures of excellence rather than the practical skills needed at the front-line. Box 8.1 summarises the critical features of the training programmes. Training institutions were confined to the public sector, enabling the MoH to co-ordinate production with subsequent employment and deployment in the rapidly expanding public sector services. Another feature was that domestic funding, and not foreign aid, supported the training programmes. Foreign assistance was mainly of a technical nature (Box 8.1).
| Category | 1956–1965 | 1966–1975 | 1976–1985 | 1986–1995 |
|---|---|---|---|---|
| Nurse | 2,900 | 3,350 | 5,200 | 9,900 |
| Community nurse | n.a. | n.a. | 1,229 | 1,794 |
| Assistant nurse1 | 2,000 | 2,152 | 3,800 | 1,800 |
| Midwife1 | n.a. | 790 | 1,700 | 180 |
| Medical assistant | No intake yet | 899 | 1,137 | 1,913 |
| Health inspector | No intake yet | 68 | 866 | 791 |
| Public health assistant | 30 | 143 | 355 | 810 |
| Pharmacist assistant | No intake yet | 200 | 746 | 930 |
| Radiographer | 49 | 192 | 224 | 338 |
| Medical laboratory technologist | No intake yet | No intake yet | 853 | 907 |
| Medical laboratory assistant | 110 | 469 | 720 | 80 |
| Physiotherapist | No intake yet | 22 | 129 | 184 |
| Occupational therapist | No intake yet | No intake yet | 41 | 141 |
| All | 5,089 | 8,263 | 17,000 | 19,768 |
1 Phasing out.
n.a. – not available
1. Basic pre-service courses were of 1–3 years’ duration.
a. The WHO and international agencies provided assistance for developing basic curricula, training trainers and establishing standards for qualifying exams, thereby contributing to quality standards.
b. All health programmes delivered through the rural health service had standardised clinical and management protocols and standard packages of equipment and drugs. Frequent in-service training ensured that all staff acquired competence in these protocols.
c. The training incorporated basic concepts of community mobilisation. This subsequently enabled rural health staff to recruit from village development committees in health projects, particularly for sanitation, immunisation and safe motherhood.
2. Some of the more competent and experienced staff received additional training in supervisory techniques and became supervisors who lived and worked close to the front-line staff.
Training programmes expanded rapidly for allied health personnel, namely midwives and health nurses (for MCH and nutrition), public health overseers and health inspectors (for environmental sanitation), and medical assistants and pharmacy assistants (for treating common illnesses) (Table 8.2).
In contrast, during this phase of development, the production of doctors, dentists and pharmacists was limited. For example, during the 20-year period 1955–1975, the number of nurses and assistant nurses/midwives increased at a much faster rate than that of doctors (Table 8.3).
| Category | 19551 | 1974/1975 | 1995 | 2015 |
|---|---|---|---|---|
| Doctor | 736 | 2,374 | 9,608 | 46,491 |
| Pharmacist | n.a. | 52 | 1,537 | 10,511 |
| Medical assistant/assistant medical officer | 1,075 | 1,379 | 4,261 | 14,724 |
| Nurse | 1,065 | 3,9632, 3 | 1,36472 | 99,925 |
| Assistant nurse and midwife | 1,132 | 4,7402, 4 | 5,4952 | 25,175 |
| Sanitary engineer | 0 | 5 | n.a. | n.a. |
| Sanitary inspector/health inspector/assistant environmental health officer | 168 | 3982 | 1,425 | 4,517 |
| Assistant health inspector | n.a. | 5262, 3 | n.a. | n.a. |
| Medical laboratory technologist | n.a. | 4282 | 1,698 | 6,3245 |
| Laboratory technician | 78 | 5422 | 980 | |
| Occupational therapist | n.a. | n.a. | n.a. | 1,054 |
| Physiotherapist | n.a. | n.a. | n.a. | 1,361 |
1 Excludes Sabah and Sarawak.
2 Government only.
3 Excludes Sabah.
4 Data for 1974.
5 Public sector only: data for 2013.
n.a. – not available
Courses that provided the basic qualification for doctors were available only in three local universities, and the number of places was severely limited. No post-graduate training was available, and there was a limited number of scholarships for specialist training in foreign countries (mostly in the UK). During these earlier years, expatriate staff on short-term contracts filled key vacancies in medical officer and specialist positions until local staff became available and replaced them.
As a result of the rapid recruitment and training of nurses and midwives, the number of people per nurse/midwife declined about four-fold from 2,488 in 1964 to 570 in 1980 (see Chapter 3: Supplementary Table 3.L). The number of people per doctor also declined by about half from 7,145 in 1960 to 3,563 in 1980 (see Chapter 3: Supplementary Table 3.K).
Several governance mechanisms controlled the quality of health personnel (World Health Organization, 2014). First, legislation mandated that qualified personnel in core categories such as doctors, dentists, pharmacists, nurses and midwives had to be licensed to practice and were placed on registers. This served to control unqualified, illegal practitioners. Second, as the public sector was by far the largest employer of health personnel, their employment conditions were governed by civil service rules and regulations that also defined their financial and non-financial benefits such as medical care, travel subsidies, highly subsidised housing, employment security and pension benefits. Thus the public sector was able to control the composition and quality of the health workforce.
The health system outcomes relevant for assessing this early phase of development include availability of and access to health staff, utilisation of services, and selected mortality and morbidity indicators closely associated with the performance of the health workforce. Data for nurses/midwives suggests that increased availability was associated with utilisation and health status (Table 8.4) (trend data for other categories were not available).
| Maternal mortality ratio (MMR) | Live births per midwife1 (LB) | Percent births with skilled attendance | Number of people per nursing staff2 | % infants with DPT3 immunisation3 | Incidence of diphtheria | |
|---|---|---|---|---|---|---|
| 1961 | 200 | 320 | 41 | 2488 | n.a. | |
| 1970 | 148 | 149 | 67 | 1879 | 15 | 11.104 |
| 1980 | 63 | 101 | n.a. | 570 | 72 | 0.97 |
| 1990 | 20 | 102 | 89 | 481 | 92 | 0.05 |
Stocks and flows explain inertia in a system; that is, the delay between actions and their outcomes. The importance of this systems thinking concept to health system strengthening is perhaps most clearly seen in human resources due to the length of time required to train medical personnel and the number of personnel that can be trained at any one time (flows). Such considerations contributed to the choice to emphasise the production of allied health personnel over doctors (and task shifting) in the early stages of the Malaysian health system. System inertia is also seen in the pool of existing personnel (stocks). Indeed, medical personnel may be part of a health system for decades, enabling and constraining health strategies and imposing financial obligations on the health system.
8.3 The Second Phase of Development (1980s–1990s)
Several overarching features influenced development during the 1980s and 1990s. Rapidly rising female literacy and rural-to-urban migration contributed to the evolving morbidity and mortality patterns (see Chapter 3). Communicable diseases (CDs) declined, while non-communicable diseases (NCDs) became more common (see Chapter 6). As long-established vertical disease control programmes (malaria, tuberculosis, leprosy) merged with primary care (Chapter 4), their staff were absorbed and, where necessary, re-trained to provide a broader range of services. Larger hospitals that offered treatment facilities were overcrowded while smaller district hospitals were underutilised, catering mainly for normal childbirth and ambulatory care for less complex conditions (Public Health Institute, 1983). The bypassing of clinics and district hospitals by patients in favour of larger or more sophisticated facilities for inpatient and ambulatory care was a significant pattern in health care utilisation at this time (Chapter 5). This phenomenon illustrated the growing demand for higher levels of clinical and technical services that came with rising socio-economic and educational status in the population. Table 8.5 summarises the interactions that influenced the evolution of the health workforce at this time.
| Health services | Education sector | Governance and financing | |
|---|---|---|---|
| Health and education sectors |
|
|
|
| Production of health workforce | Health workforce: key features | Outcomes | |
|---|---|---|---|
| Health workforce |
|
| • Disparities between geographic regions for access to care were reduced |
Staff with higher levels of competence were needed. Several new categories of personnel were recruited. For example, public health engineers were recruited to complement health inspectors (Chapter 7) and pharmacists to complement pharmacy assistants (Chapter 10).
Categories of staff such as nurses, medical assistants and health inspectors attending training programmes in the public sector received living allowances and accommodation during their training period. The health personnel training programmes profile of 1975 provides an insight into the evolutionary process of the workforce. The training of nurses and assistant nurses was at a peak; midwives were being converted into community nurses, health inspector training was upgraded and pharmacist training had just begun (Table 8.6).
| Category1 | Programme duration (years) | Schools (no.) | Expected annual output |
|---|---|---|---|
| Medical doctor | 5 | 2 | 250 |
| Pharmacist | 4 | 1 | Intake of 50. No output yet |
| Nursing professions | |||
| Staff nurse | 3 | 9 | 570 |
| Assistant nurse | 2 | 23 | 583 |
| Midwife | 2 | 16 | 205 |
| Community nurse (basic course) | 2 | 2 | No output yet |
| Community nurse (conversion course)2 | 0.5 | 3 | 108 |
| Other health worker | |||
| Hospital assistant | 3 | 2 | 166 |
| 1 (existing) | 1 | 58 | |
| Health inspector3 | 3 (new) | 1 | No output yet |
| Radiographer | 2 | 1 | 21 |
| Physiotherapist | 3 | 1 | 4 |
1 Universities provided training of medical doctors and pharmacists as a degree programme; training of nursing professionals and other health workers was via an MoH certificate programme.
2 For trained, certified midwives to enable them to perform a wider role.
3 In 1975, two types of training programme for health inspectors co-existed as the training was transitioning from the one-year programme, which was being phased out, to the new three-year programme.
Meanwhile, growing prosperity encouraged the growth of private sector healthcare. This was associated with the continuing challenge of the brain drain of doctors, particularly those who were more experienced and specialist, from the public sector to the private sector (Ministry of Health Malaysia, 2016b). Although the production of doctors increased during the 1980s and 1990s, a sizeable proportion moved from the public to the private sector after the mandatory period of public sector service. Thus the ratio of public-to-private sector doctors remained about 50:50 (Figure 8.1). According to an analysis by Reference Hameed MusafarHameed Musafar (2014), the major contributory factors of this brain drain were the slowing of wage growth in the public sector combined with the rapid increase of private hospitals and beds, where doctors had better remuneration and working conditions.

The shift of doctors from the public to the private sector also created regional disparities. The West Coast states of Peninsular Malaysia experienced much faster socio-economic development than the East Coast states and the states of Sarawak and Sabah1 (see Chapter 3), thus private sector healthcare was concentrated in the West Coast states, where patients could pay for these services (Figure 8.2). Consequently, the health sector faced the dual challenge of addressing brain drain to the private sector and inequitable access to healthcare between the regions.

Several policy responses targeting health sector development emerged to address these challenges. One was the national drive to balance the inequitable development that had seen the West Coast states progress much faster than the other states (Prime Minister’s Department, n.d.b). Faster development of the less-developed states was expected to facilitate the growth of the private sector, including the private healthcare sector. Another policy was to improve managerial skills in the public sector for better efficiency (obtaining more and better outputs for the inputs) (Prime Minister’s Department, n.d.a). Better in-house personnel management was expected to address some of the frustrations of the higher-level categories in the public hospitals. A third approach was to leverage the scarce resources of skilled clinical specialists in the public sector by upgrading the competencies of healthcare workers and encouraging the adoption of a team approach by clinical specialists working together with other categories of healthcare workers. Internal MoH policies on staff placement continually struggled to increase numbers in the less-developed states. These policies resulted in changes in the health workforce profile.
Clinical competencies were upgraded through curricula changes. Some allied health professional categories were upgraded to acquire broader competencies and better remuneration, while others were phased out (Box 8.3). Simultaneously, nursing training was broadened and opened to private sector training institutes. These strategies resulted in a rapid increase in the nursing workforce. As a result, the number of people per nursing personnel was reduced from 1,879 in 1970 to 481 in 1990 (Table 8.7).
| People per staff | ||||
|---|---|---|---|---|
| Year | 1970 | 19801 | 1990 | 2000 |
| Nursing personnel | 1,879 | 570 | 481 | 599 |
| Doctors | 4,263 | 3,800 | 2,553 | 1,490 |
The local production of physiotherapists, occupational therapists and radiographers also increased rapidly (Table 8.2). Improved school enrolment and positive discrimination measures enabled rural students to acquire secondary education and resulted in larger numbers of better-qualified candidates for these courses. To improve managerial efficiency, doctors who occupied managerial positions at district and state levels received specialist post-graduate training in public health, while those with managerial positions in hospitals attended purpose-designed in-service management courses (Box 8.3). The establishment of new medical schools accelerated the production of doctors (Table 8.3); specialist training for doctors and for nurses was enhanced.
Allied Health Personnel
Rural midwives were converted to community nurses.
Junior hospital assistants were replaced by medical assistants.
Medical laboratory assistants were replaced by medical laboratory technologists.
Trained nurses were given in-service training to become health staff nurses.
Curriculum for health inspectors was upgraded and converted from a one-year to a three-year programme that included competency-based practical training.
Nurse training included a strong management component.
Local production of physiotherapists and radiographers was expanded.
Training of health education officers was initiated in the MoH and subsequently transferred to universities.
Doctors and Other Professional Staff
Doctors and relevant teams were given in-service training in hospital management.
This training included team training in conducting local-level research and using such information for decision-making (health systems research) and quality improvement (see Chapter 10).
Post-graduate training in local universities was established for several specialities for doctors.
Post-graduate training in public health for doctors and engineers included strong management components.
Notable: Most courses included strong components of:
Cultural and behavioural determinants of health and health-seeking behaviour.
Practical exercises that enhanced the appreciation of how such determinants applied in the Malaysian context.
Various measures were introduced to redress the geographic imbalance in distribution (e.g. special allowances and housing, access to specialist training) and also to stem the brain drain to the private sector (e.g. compulsory public sector service for specified periods). However, as illustrated in Figure 8.1, the proportion of doctors in the public and private sectors did not change until the end of this period. The flow to the private sector was merely contained and not reversed. Also, although the availability of doctors improved steadily, the gap between the West and the East Coast states of Peninsular Malaysia narrowed only after 1995, while the gap with East Malaysia remains challenging even today (Figure 8.2).
Systemic factors driving individual and collective choices have contributed to the persistence of the gap. Doctors in East Malaysia face more difficulties in accessing facilities such as education for children and entertainment, as well as distance from extended families (Ministry of Health Malaysia, 2016b). Additionally, both public and private hospitals are in places with higher population density for economies of scale; with doctors and medical staff of other higher categories concentrated in hospitals, the pursuit of efficient resource use inadvertently contributes to inequalities. Finally, private hospitals are concentrated in more prosperous regions, where the community has the ability to pay for services. These factors jointly create conditions for the inequitable distribution of human resources, and especially of doctors.
The challenges of regional inequalities notwithstanding, overall access to healthcare has increased, with a significant proportion of this increase resulting from private sector expansion (Table 8.8), and utilisation has increased along with access (Figure 8.3).
| Percent within 3 km of nearest facility | 19861 | 19961 |
|---|---|---|
| Population | Living quarters | |
| Public2 | 24 | 50 |
| Private3 | 18 | 80 |
| Both | 32 | |
| Peninsular Malaysia | 74 | 89 |
| Sarawak | n.a. | 48 |
| Sabah | n.a. | 66 |
| All | 81 |
1 Peninsular Malaysia only in 1986; including states in Borneo in 1996.
2 Staff might have been a community nurse, medical assistant or doctor.
3 Staff was a private medical doctor.
n.a. – not available
Utilisation of outpatient services in Malaysia.

8.4 The Third (Most Recent) Phase of Development (2000s through to 2017)
After the turn of the century, macroeconomic policies focused on achieving ‘developed country status’ by 2020, which included eradicating poverty and redressing imbalances, building a knowledge-based society and strengthening human resource development with higher levels of knowledge, technical and thinking skills (Economic Planning Unit, n.d.). Globalisation and information communication technology increased, as did urbanisation (62% in 2000) (Department of Statistics, 2001). Lifestyles changed, particularly in relation to food and exercise habits (Reference LimLim, 2016; Koh et al., 2015), and migration increased (an estimated 0.23% of the population) (Department of Statistics Malaysia, 2019), with a sizeable proportion of undocumented migrants. All these forces impacted on the health status of the community (see Chapter 3). While the prevalence of NCDs was rising rapidly, some CDs re-surfaced (tuberculosis and dengue) while new threats emerged (HIV/AIDS, severe acute respiratory syndrome (SARS)) (see Chapter 6). Meanwhile, public expectations of health services also increased, influenced not only by rising economic and education levels but also by readily accessible information through electronic connectivity (see Chapter 3).
Medical technology in clinical, imaging and laboratory sciences developed rapidly, bringing with it demands for more varied and higher levels of competencies in the health workforce. These demands on the health services were mirrored by demands from the health workforce for better recognition, higher levels of education and better wage scales. Table 8.9 illustrates how different socio-economic changes at that time influenced the evolution of the health workforce.
| Health services | Education sector | Governance and financing | |
|---|---|---|---|
| Health and education sectors |
|
|
|
| Production of health workforce | Health workforce: Key features | Outcomes | |
|---|---|---|---|
| Health workforce |
|
|
A confluence of pressures from socio-economic forces, population behaviour, technological advances, and demands from health service delivery and the health workforce resulted in changes in three related but distinct developments in human resources for health, namely:
1. Basic (pre-employment) education programmes for health and allied health professionals increased their entry requirements and became more focused on achieving defined exit competencies, replacing the earlier implicit and often vague academic standards. A wide range of education programmes for health personnel that hitherto had been under the purview of the MoH were transferred to universities and colleges under the purview of the MoE so that they could have diploma- or degree-level qualifications that commanded higher remuneration packages.
2. A wider range of categories of health personnel, particularly allied health personnel, was produced and employed. By 2014, there were 31 categories of allied health professionals employed by the MoH (Ministry of Health Malaysia, 2016b). They required relevant governance mechanisms (qualification standards, practice regulations, remuneration packages, career pathways) (World Health Organization, 2014).
3. Demand for specialists increased, bringing with it challenges in ensuring standards of quality, appropriate remuneration, distribution and access. This in turn gave rise to the need for managing standards for quality (specialist registers, accreditation, credentialing and continuing education) and remuneration packages (World Health Organization, 2014).
Dichotomies between the health and education sectors and between the public and private sectors in education and health were major structural challenges that affected all the above three aspects of development, which in turn constrained health service delivery. The education sector produced health personnel, while the health sector utilised them. There was a dichotomy in the vision and motivations of education and health between the public and private sectors. In both education and health, the public sector focused on societal expectations within tightly controlled budgets and the private sector on commercially viable and competitive enterprises. Box 8.4 summarises the Malaysian experience.
Positive
Establishment of the MQA with adequate legislative, administrative and financial authority to regulate quality of tertiary education.
Good co-ordination mechanism between health and education specialists for setting criteria and standards for curricula based on competencies required in the health service and for approving training programmes.
Standardised system for recognition of qualifications linked to remuneration in the public sector.
Negative
The education sector at that time had only one teaching hospital, and all other universities depended on MoH clinical facilities for clinical teaching, resulting in too many students for the available resources.
The strategic planning mechanism for human resources for health in the MoH was dismantled, and there was a lack of clarity regarding responsibility for strategic planning for the health sector as a whole.
As a result:
There was poor information exchange between the education and health sectors.
Intakes to education programmes outstripped the capacity of the health sector to provide clinical and practical training, which were almost entirely in the MoH.
The health sector was unable to absorb the graduates of training programmes in medicine, nursing, dentistry and pharmacy at the pace they were being produced.
Political and commercial factors drove extremely rapid growth of programmes offering diplomas and degrees in health sector disciplines, undermining the quality control measures and resulting in varied quality of graduates.
Basic (pre-employment) training.
The training of almost every category of allied health professional was upgraded to college or university level and therefore transferred out of the MoH to the MoE. Within the MoH, structural re-organisation resulted in the MoH changing its focus from strategic planning for the entire health sector to merely planning for its own workforce. Thus a strategic vision for human resource development for health was forfeited. Existing training institutions were re-vamped to become research institutions under the umbrella of the new National Institutes of Health (NIH).
Meanwhile, in the education sector, the number of training programmes for health personnel expanded at an explosive rate, driven by demand from the public as well as by commercial and political forces (Ministry of Health Malaysia, 2016b). Additionally, there was an increase in graduates returning from foreign training programmes, many of them funded by scholarships from the public and private sectors. The demand for nursing had escalated with the growth of hospitals in the private sector as well as demand from other countries, particularly in the Middle East, while the unmet demand for medical doctors was a long-standing issue. The quality of graduates varied greatly (Reference NoorlizaNoorliza et al., 2012). This was particularly apparent in nursing and medicine. The health sector had inadequate capacity to absorb the rapidly increased number of new graduates, with insufficient public health service posts to provide placements for the requisite pre-registration and supervised training of doctors (house officers (HOs)), dentists and pharmacists. Meanwhile, the private sector health services were unprepared to employ fresh, inexperienced nursing graduates. The illustrative case study in this chapter explores the dynamics and impact of the structural challenge in relation to the production and utilisation of medical doctors.
Two underlying systemic issues contributed to the genesis of the problems. Medical, dental and pharmacy education programmes are relatively long (4–6 years). Hence there is a significant time lag between entry into training programmes and graduates seeking entry into the workforce. There was no institutional mechanism for regular timely exchange of critical information between the education and health sectors that would have facilitated pro-active planning taking into account the numbers of entrants and expected graduates. Additionally, institutional mechanisms for joint strategic planning and decision-making are unstable and personality-dependent (Box 8.4) (Reference BuchananBuchanan, 2015).
For the first time, doctors and nurses in the public sector outnumbered those in the private sector. However, a large majority of those in the public sector were younger and inexperienced, and difficulties arose in providing them sufficient supervision and guidance (Ministry of Health Malaysia, 2016b).
Several strategies were employed to address the situation, including a moratorium on the establishment of new training programmes for doctors, dentists, pharmacists and nurses; rationalising and consolidating existing programmes; and capping the annual intake in each school. Universities were encouraged to offer post-graduate training of doctors in specialist areas instead of focusing solely on basic under-graduate programmes (see Case Study 8.1 and the later sub-section on ‘Issues related to the growing trend of specialisation’). For nurses who had graduated from substandard nursing programmes, special re-training programmes were implemented in both public and private colleges. This facilitated their subsequent employability, particularly in the growing private hospital sector. Pharmacy graduates were allowed to perform their requisite pre-registration training in the private sector.
System inertia complicates decision-making, generating outcomes that under- or overshoot targets. In human resources planning in health systems, this is further complicated by different decision-making loci that shape the flows of human resources, which include education, the public and private health sectors and medical personnel. Several practices can improve the management of system inertia in human resources for health systems, including: (1) closely co-ordinated planning of service delivery strategies with human resource development strategies, (2) using a whole-pipeline approach that cuts across sectors and organisations, and (3) a robust information system that can recognise upcoming trends and needs.
Expansion of categories of staff.
The shift of basic training to the education sector and the establishment of the MQA served well in providing standards for training, recognition of qualifications and establishing remuneration criteria for a large and growing number of allied health professionals. By 2012, the MoH was employing 31 different categories of allied health professionals who had graduated from accredited diploma or degree programmes in colleges and universities. Both public and private sector hospitals began to establish units and programmes that required the skills of these personnel. Practice modalities within health service delivery changed from a heavy focus on the doctor towards a team approach that reflected the growing competence levels of the allied health and other professional groups. In turn, this team approach was integrated into teaching–learning situations in human resources development.
The Malaysian health workforce is known for its capability for rapid implementation of programmes. An outstanding recent example is the achievement of coverage of the human papillomavirus (HPV) vaccination in the eligible population of adolescent girls – within years of the programme being introduced, higher coverage had been attained than that achieved in many ‘first world’ countries (Reference Buang, Jaafar, Pathmanathan and SaintBuang e al., 2018).
Who is responsible for implementing health programmes?
Supervisory categories of nurses manage many front-line services.
Doctors specialising in public health manage state health departments and health districts and several hospitals.
Their training includes significant emphasis on programme management. This probably contributes to the impressive capacity for rapid and effective implementation of health programmes, particularly those largely delivered through the MCH services.
Similarly, other categories of the health workforce, especially those including senior managerial positions, attend mandatory management courses designed for all civil service officers as part of their career development, while other people who occupy managerial positions in any programme in the MoH attend purpose-designed in-service courses on management.
Continuing education.
Participation in continuing education and access to regularly updated practice guidelines is one of the strengths of the Malaysian health workforce. For those in the public sector, the employing agencies (the MoH and other ministries) organise and fund continuing education activities through the various training institutions, hospitals and the NIH. In the private sector, professional bodies take on this role, often in association with pharmaceutical agencies. The MoH also takes the lead in assembling teams of specialists to develop practice guidelines using systematic reviews and other relevant information produced by the health technology unit.
Governance structure and procedures that had served the earlier established medical, dental, nursing, medical assistant and pharmaceutical professions well were replicated to cover several newer categories (Box 8.7).
Nursing and midwifery: since 1950 and 1966, respectively
Pharmacists: since 1951
Medical and dental: since 1952 and 1948, respectively
Assistant medical officers: since 1977
Opticians and optometrists: since 1991
Food analysis: since 2011
Traditional and complementary medicine: since 2013
Allied health professionals: since 2016
Traditional and Complementary Medicine Act: since 2016
The regulatory authority and governance structures described in detail elsewhere (World Health Organization, 2014) have served well in the past to control the practice of these professions by unqualified persons and to set standards of practice for each profession.
However, with the growing number and size of the professions, the evolution of the health system has brought to prominence the need to modernise legislation and governance structures. A recent review by Reference WraightWraight (2015), a WHO consultant, recommended:
Harmonising the regulation of all professional groups for ‘consistency of purpose to achieve consistent, transparent and fair regulation that protects the public’.
Strengthening ‘arrangements for governance and accountability … and the relative autonomy of councils and boards’ (currently, all councils and boards are under the purview of the MoH, although all have elected representation from the respective professions).
Establishing sufficiently resourced standalone secretariats with clear demarcation of the roles between the secretariats and the respective divisions in the MoH.
Alignment of processes to establish standards, procedures, requirements and codes of conduct across all regulated professions to ensure they ‘do not compromise the Regulators’ ability to protect the public’.
This range of recommendations illustrates the challenges of responding to new circumstances.
The critical impediments are: (a) the time taken to amend legislation, with some changes taking more than 15 years, and (b) the capacity and political will required to establish standalone secretariats and clear demarcation between the roles and authority of the regulatory bodies vis-à-vis the MoH.
Specialist competencies.
Healthcare services delivery required increasingly complex skills from its workforce to address the growing numbers of patients with complex and multiple disease presentations. They had to use new medical technologies that became available every year. This resulted in a trend toward specialisation, where a small section of the workforce gained much higher competencies in selected fields of medical care.
Issues related to the growing trend of specialisation.
The number of such specialised fields is growing steadily. Table 8.9 gives examples of the fields of specialisation and the relevant governance mechanisms established to control quality and safety of practice. This growth presents the continuing challenge of producing sufficient trained personnel for each field and distributing them equitably in the health system. Additionally, as the number of specialities increases and the field of each specialisation narrows, particularly for doctors, there are concerns that this could lead to the management of specific manifestations of diseases and health conditions rather than holistic treatment of the patient. Team approaches mostly focus on multi-disciplinary teams of health professionals and allied health professionals but less on teams of senior clinical specialists.
Doctors and dentists undergo specialist training in university-based training programmes. However, as with basic training programmes, specialist training depends on MoH hospitals to provide the very large component of clinical and practical training. Such training requires supervision from specialists in MoH hospitals. As specialists capable of providing supervision are frequently limited in number, there is insufficient capacity to produce specialists at the rate they are needed (the case study illustrates the dynamics of this situation). Consequently, it is difficult to achieve the desired distribution between the geographic regions. Several strategies have been formulated to improve access in the face of the inequitable distribution.
| Category of staff | Fields of speciality training | Governance mechanism |
|---|---|---|
|
|
|
| Doctors |
|
|
This developmental process has also created new tensions. For example, nursing education has progressed from certificate-level training within the MoH to diploma and degree status in universities. However, the majority of nursing positions in the MoH, the major employer of nurses, are for certificate- or diploma-level candidates. The nursing profession continues to struggle to attain professional status commensurate with degree holders. The role of nursing degree holders in the health sector is as yet unclear, illustrated by the fact that speciality training is limited to credentialing existing nurses with experience rather than requiring further training and qualifications as is the case for doctors. Meanwhile, a dilemma arises from the need for personnel who perform the simpler tasks of bedside nursing. These tasks used to be performed by assistant nurses, a category that no longer exists. Interestingly, more ‘developed’ countries are eyeing Malaysia’s expertise in training assistant nurses as a possible solution to nursing needs arising in their own countries. Another issue is whether the health workforce is sufficiently prepared to address the changing epidemiological picture, with high rates of non-communicable disease together with the ability to mobilise communities to empower individuals and families to take responsibility for their health.
8.5 Workforce Performance
The performance of the health workforce is intimately related to its equitable distribution and utilisation, client satisfaction and quality of healthcare. This sub-section provides information on selected indicators of the performance of the workforce.
8.5.1 Equitable Distribution
Specialist doctors are the most expensive category of healthcare worker and the category for which equitable distribution is the most difficult to achieve. The distribution of selected illustrative key specialist doctors in 2013 was, as expected, highest in the West Coast states of Peninsular Malaysia, but there was a much smaller difference between the Peninsular East Coast states and East Malaysia (Figure 8.4).
Distribution of selected specialist doctors in Malaysia, 2013.

8.5.2 Utilisation: Level of Utilisation and Equitable Utilisation
The Malaysian Health Care Demand Analysis in 2013 noted that the per capita outpatient visits to doctors in Malaysia ‘are comparable with the lower end of the range of levels seen in OECD economies, and about average for countries in the Asia Pacific region with available estimates’. It also found that utilisation had increased from one consultation per capita in the 1930s to >4 consultations in the 2000s. This came from increased utilisation of the public sector starting from the 1960s and 1970s and the rapid increase in utilisation of the private sector after 1980 (Health Policy Research Associates et al., 2013) (Figure 8.4). In terms of equitable utilisation, the study found that ‘the poorest 50% of the population used almost two-thirds of … visits to public facilities, whilst the richest 50% of the population account for two-thirds of visits to private providers’. Similar patterns were observed for the utilisation of inpatient services. Unfortunately, the study did not report on differentials in utilisation in the three geographic regions.
8.5.3 Satisfaction
Human resources play a large role in determining client satisfaction with healthcare services. The community perception module of the 2015 National Health and Morbidity Survey obtained user satisfaction scores on several aspects of services in clinics and hospitals in the public and private sectors. In terms of provider behaviour, more than 70% of users of clinics and hospitals recorded satisfaction levels of ‘good’ or ‘excellent’ in terms of ‘ability to give diagnosis and treatment’, ‘give clear explanations’ and ‘courtesy and helpfulness’. There was little difference between the satisfaction levels reported by users of public and private facilities (Figures 8.5 and 8.6). However, among the other aspects of care, the main source of dissatisfaction regarding public sector clinics and hospitals was waiting time, whereas that for the private sector was treatment charges (Figures 8.5 and 8.6).

Reported satisfaction with public and private hospitals, 2015.

8.5.4 Quality of Care
While many factors contribute to quality of care, provider competence and behaviour is a crucial factor therein. During the 1980s, Malaysia was a leader among the developing nations in developing systematic monitoring and improving quality of care in the health sector. The aim has been to encourage the adoption of a mindset for quality and care that ensures good monitoring and improvement practices among healthcare providers. Although there is a wealth of data from the public sector, data from the private sector are limited, thereby limiting the overall estimate of quality of care.
A 2016 study by an international group from the Harvard T. H. Chan School of Public Health and the MoH (Ministry of Health Malaysia & Harvard T. H. Chan School of Public Health, 2016) used data from the National Medical Care Surveys (NMCS 2012 and 2014) (Clinical Research Centre, 2014) to replicate 66 indicators to analyse the quality of primary care. They found that ‘patients received around 57% of recommended care’ and that ‘these estimates are close to the aggregated quality of care estimates found in the United States and Australia, which range from 55 to 57% although the estimates are not strictly comparable due to differences in the set of indicators used and patient case mix’.
Systematic data for hospital care were limited (Ministry of Health Malaysia & Harvard T. H. Chan School of Public Health, 2016). However, based on mortality rates for common acute conditions, they found that
30-day mortality rates for acute myocardial infarction and haemorrhagic and ischaemic stroke (admissions calculated according to actual deaths both in and outside hospitals) were high in 2008 compared to most OECD countries (but comparable to Korea) but have been declining in the past decade with convergence towards rates observed in OECD countries … Hospital case management has been improving and approaches OECD countries for these conditions.
It could be concluded that the quality of clinical care provided by the Malaysian health workforce is generally within acceptable standards.
8.6 Conclusion
In the Malaysian experience, the evolution of the health workforce was determined by the demands of the evolving service delivery system and the capacity of educational institutions, both local and foreign, to produce health workers. As noted in earlier chapters, the evolution of service delivery patterns was influenced by evolving socio-economic status, demographic profile and morbidity and mortality in a community. In parallel, educational status and evolving socio-economic status influenced the evolution of educational institutions. This interaction between demand and supply was moderated by financing and governance measures that evolved over time in recognition of the competing pressures from the larger ecosystem on the demand for and supply of health workers.
Governance and financing mechanisms flexibly shaped the health workforce in response to demands from the health services as they evolved in response to population and health demands.
Legislation required registration and annual licensing for practice key professions, resulting in:
control of unqualified practitioners, and
standards for practice defined by recognised qualifications and sources of qualification.
Education standards for curriculum and quality were enforced during:
the earlier phases – through licences and recognition only of institutions only in the public sector (mainly the MoH), and
the later phases – through a regulatory authority (the MQA).
Financing of students for training has mostly been from the government for study at local public and private institutions and foreign institutions. This largely facilitated the government’s management of the composition, numbers and quality of the health workforce.
Employment: Being the major employer, the public sector can set standards regarding wage structure and benefits packages. However, in the case of specialist doctors, where demand exceeds supply, pressures from the private sector created the necessity for the public sector to upgrade its benefits package.
Foreign inputs have been used strategically to develop and support local resources:
Monetary aid has been negligible.
Technical input is used strategically to design curricula, train trainers and set standards.
Expatriate staff have been very few, mainly for working in rural areas during the earlier years and to provide specialist skills while awaiting the development of local expertise.
The composition of the workforce contributed to the development of an affordable health system.
Nurses were the backbone of the rapidly developing rural health service that responded effectively to conditions of high maternal and infant mortality (Reference Pathmanathan, Liljestrand, Martins, Rajapaksa, Lissner and de SilvaPathmanathan et al., 2003) and remain the dominant category in the health workforce. They far outnumber doctors.
‘Task shifting’, although not acknowledged formally, has been practised throughout all phases of development in accordance with specific service needs. Anecdotal evidence suggests that it was associated with focused on-the job training (e.g. procedures in and anaesthesia by medical assistants, emergency obstetrics by nurse-midwives in hard-to-reach locations, and renal dialysis by nurses).
Education programmes aim to build competence, particularly among nurses and doctors specialising in public health, to manage health programmes and respond to health behaviour that is influenced by the patient’s cultural and personal beliefs.
Alignment of educational curricula with the competencies required in the health sector has been achieved through effective institutional mechanisms. However, the reliance on the public sector to provide almost all facilities for acquiring clinical skills is a major impediment.
The major challenges that persist include:
The structural divide between the public and private sectors, where the health workforce in the public sector is tax-funded and salaried, and in the private sector it is largely fee-for-service self-employed. This has contributed to:
◦ experienced and more highly skilled staff moving from the public sector to the private sector, and
◦ the consequent difficulty in achieving geographic equity in staff distribution.
The gap between the education and health sectors, whereby:
The higher categories of healthcare workers undergo relatively long and expensive training. The time lag between entry to an education programme and entry into the workforce could range from 4 years for courses of shorter duration to as long as 10–12 years for doctors. The health sector is unable to predict and prepare for large changes in the quantity or quality of entrants into the workforce, because institutional mechanisms are weak in terms of:
providing timely information on the numbers and types of graduates the health sector can expect in forthcoming decades, and
joint strategic planning between the two sectors to adjust production to the capacity for utilisation.
The result is an imbalance between production and absorption capacity and between production and health sector requirements. When the health sector had control over both production and utilisation, the two could be managed through relatively simpler governance mechanisms. With the evolution of systems, much more sophisticated and time-sensitive mechanisms are needed to generate information and co-ordinate policies and policy implementation tools.
The outcomes of this interaction between the supply and demand of healthcare workers impacts on the access, quality, satisfaction and safety of healthcare, which in turn impacts on the morbidity and mortality in the community.
8.7. Key Messages from Malaysia’s Experience
8.7.1 What Went Well?
The composition of the workforce was crucial in the development of an affordable healthcare system. Key features were:
◦ The availability and competence of staff to deliver key tasks at the sites where they were required.
◦ Nurses, midwives and medical assistants formed the backbone in the early years.
◦ ‘Task shifting’, although not acknowledged formally, was practised in accordance with specific service needs.
◦ Educational curricula for all categories were closely aligned to explicitly defined competencies required in healthcare services.
The health workforce was shaped flexibly to respond to demands from the health services:
◦ through recognition of opportunities and threats in the larger ecosystem and the appropriate use of:
◦ governance (e.g. registration, annual licensing, defined standards for eligibility to practise, wage and benefits packages), and
◦ financing mechanisms (such as publicly funded training).
Foreign inputs were used strategically to develop and support local resources.
8.7.2 What Did Not Go So Well?
The structural divide between the public and private sectors contributed to:
◦ brain drain from the public sector to the private sector, and
◦ a consequent difficulty in achieving geographic equity in distribution of staff.
There were gaps in co-ordination between production (education) and utilisation (health) due to weak institutional mechanisms.
9.1 Introduction
How a country chooses to finance health care for its people is an important indicator of the value it places on health as a public good. A country that relies predominantly on public funding for health care reveals a strong commitment by the state to ensure its people’s access to care.1 The growth of private funding for health care, particularly when it results in out-of-pocket payments (OOPPs)2 for households, is a real risk for financial impoverishment.
A country’s history plays a major role in shaping its health system (Reference PhuaPhua, 1989). Some former British colonies in Asia, for example, have retained many welfare-oriented features of the British National Health Service. These include minimal user fees or even free services at the point of use. However, history cannot be the sole reason for current systemic failures in health. Health systems do not remain static but evolve in response to challenges to their resilience. The state is beholden to ensure through good governance that such transformations meet the changing health needs of its people.
What, then, is the situation in Malaysia? Reliable historical estimates of national health expenditure are not fully available. However, it is known that although health care in the country has been mainly financed using public funds since 1997, the share of public funding just barely exceeded that of private funds for health (Ministry of Health Malaysia, 2019, p. 26). This is in contrast to the situation in 1983, just slightly more than a decade earlier, when the share of public funding was more than 75% of the country’s health expenditure (Westinghouse Health Systems, 1985, p. 4).
By 1997, not only had private funding of health care reached almost half of the country’s health expenditure, this private funding was also mainly composed of OOPPs (Ministry of Health Malaysia, 2019, p. 40). Coincidentally, the 1980s also marked the start of the period when the private provision of health care in the country began a rapid upward trajectory (Reference Chee, Barraclough, Chee and BarracloughChee & Barraclough, 2007, p. 23). Malaysia’s current hybrid health system is one in which the financing and delivery of health care follow the public–private divide – publicly funded public health care providers exist alongside privately funded private health care providers. Over the past few decades, the private health system has expanded at a faster rate than its public counterpart, with consequences not just on the trends but also on the composition of health financing in the country.
However, the raison d’être of any country’s health financing system is not merely to pay for health care. The system should also ensure that the burden of payment, independent of use, is fairly distributed among the population in a country. In many welfare-oriented countries like Malaysia, this translates to a progressive health payment system where richer households contribute proportionately more from their income than poorer ones (Reference Yu, Whynes and SachYu et al., 2008). In addition, the system should also ensure that health funds, especially public funds, are allocated in a manner that can meet population health needs. Like many other middle-income countries, Malaysia is undergoing an epidemiological transition from communicable to non-communicable diseases (NCDs). To curtail the epidemic of these chronic lifestyle diseases effectively, adequate funding should be allocated to preventive and promotional services, early disease identification, early treatment initiation and, most importantly, sustained delivery of needed care. In the case of NCDs, most of these services can be provided efficiently at the primary care level.
This chapter will tell the story of Malaysia’s changing health financing landscape. It starts with a description of the trends in health financing since the 1980s; not just overall expenditure figures but also an analysis of the different financing sources that comprise public and private health financing. This section will also include a brief review of allocative efficiencies in terms of spending patterns according to the categories of services. As financing sources are intricately linked to how health care providers are paid in Malaysia, the narrative will also outline a discussion on the changes within the health care delivery system, the forces at work behind these transformations and the eventual impact on health care financing in this country. The chapter will end with a review of the challenges facing health care financing and a discussion of the way forward for Malaysia.
9.2 Trends in Health Care Financing in Malaysia
The work involved in estimating national health expenditure is not only data-intensive but also has to be conducted in a systematic manner following internationally accepted accounting frameworks to facilitate comparability across time and countries. Efforts to develop the Malaysia National Health Accounts (MNHA) (Box 9.1) to routinely capture the totality of financing flows within the Malaysian health system only started in 2001, and to date, MNHA has produced a series of national health expenditure estimates spanning 1997 to 2017 (Ministry of Health Malaysia, 2019, p. 24). Despite the lack of such accounting systems in the years prior to this, it is still possible to obtain an understanding of the public–private mix of health financing in the country from government documents and reports.
The Malaysian government disseminates policy directions for national development in a series of reports known as the Malaysia Plans, reviewed and updated every five years. The First Malaysia Plan, covering from 1966 to 1970, focused on national priorities during the early years after the birth of Malaysia, and the country is currently in the Eleventh Malaysia Plan period (2015–2020). These reports detail achievements in various economic or social sectors, including health, in the preceding five years before going on to lay down the government’s policies for the following five years. The reports also detail the financial allocations that the government has committed towards the implementation of the policies. The health chapter contained in the Fifth Malaysia Plan (1986–1990) was pivotal. While the first four reports were essentially a re-telling of government priorities to increase public investment in the public health sector, especially to expand access to rural health services (Malaysia, 1966; 1970; 1976; 1981), the Fifth Malaysia Plan was the first to acknowledge the growing financial burden on the government such that ‘programmes for health services under the Fifth Plan will take into account the limited financial capacity of the public sector as well as the need to expand the health care system’, and it noted the need to seek out new sources of health financing, including increased cost sharing with the community to ensure that ‘those who can afford to pay bear a larger share of the cost burden’ (Malaysia, 1986, p. 514).
The Malaysian government collaborated with the United Nations Development Programme in 2001 to initiate the MNHA Project (Ministry of Health Malaysia, 2006, p. ii). The MNHA Project was eventually institutionalised within the Ministry of Health (MoH) as the MNHA Unit in 2005 (Ministry of Health Malaysia, 2008, p. 1).
The estimation framework adopted by the MNHA was based on the System of National Accounts developed by the Organisation for Economic Co-operation and Development, which allowed for the systematic capture of health expenditure data from multiple sources and the reporting of a rich array of expenditure information along three dimensions, namely financing sources, health providers and health care functions (Ministry of Health Malaysia, 2006). Essentially, the MNHA information system permits the tracking of health funds from the funding source to the health care provider and finally to the purpose for which the health funds have been used.
It was apparent that concerns over the government’s ability to sustain public funding of health care using revenues from general taxation grew in the period of the Fourth Plan. This led the government to initiate the Health Services Financing Study (HSFS)3 in 1983 to review the performance of the overall Malaysian health system and to provide recommendations for alternative financing methods for Malaysia (Westinghouse Health Systems, 1985, pp. 1–10). As part of the work, the HSFS estimated that, in 1983, Malaysia spent $1.8 billion4 or 2.8% of the gross national product (GNP) on health (Westinghouse Health Systems, 1985, p. 165). The HSFS noted that 76.6% of this amount was spent on public health care services delivery and that these funds came mainly from general taxation. Full understanding of the estimated private sector expenditure has been difficult, as a full description of the funding sources was not provided. However, the report noted a ‘direct payments’5 component that may refer to OOPPs in households (Westinghouse Health Systems, 1985, p. 165). The OOPPs for households in 1983 was estimated at 18.8% or nearly a fifth of the entire country’s health expenditure.
In his classic review of the Malaysian health system of 1984, Reference RoemerRoemer (1991, pp. 395–412) also included an estimate of Malaysia’s health expenditure. He had gathered the available information about the country’s health expenditure from various sources and concluded that the country’s health expenditure in 1983 totalled $1.7 billion, or 2.6% of the GNP, of which 74.3% was from public sources and 25.7% was spent on purchases of care from private providers (Reference RoemerRoemer, 1991, p. 408). He was unable to provide an estimate of OOPPs.
Thus, although comprehensive estimates of Malaysia’s national health expenditure in the early years are scarce, both the HSFS’s and Roemer’s accounts appear to concur in that, at least in 1983, about three-quarters of the health funding in Malaysia came from public sources and that possibly nearly a fifth of health funding in the country had come from private household OOPPs.
The MNHA yielded more contemporary estimates. The available information showed that total expenditure on health (TEH) in Malaysia increased more than three-fold in real terms from Malaysian ringgit (RM) 17.1 billion to RM 57.4 billion over the 21 years from 1997 to 20176 (Table 9.1). However, this increase is less apparent after taking into consideration population expansion over this period. The increase in health expenditure per person was just two-fold – from RM 790 in 1997 to RM 1,790 in 2017. During this time, health expenditure as share of gross domestic product (GDP) had fluctuated within a narrow range, from a low of 3.0% in 1997 to a high of 4.3% in 2015.
| Year | TEH1 (billion RM in 2017 prices) | Per capita TEH1 (RM in 2017 prices) | TEH as % GDP |
|---|---|---|---|
| 1997 | 17.10 | 790.09 | 3.03 |
| 1998 | 16.88 | 755.86 | 3.23 |
| 1999 | 18.34 | 799.74 | 3.31 |
| 2000 | 19.88 | 846.41 | 3.30 |
| 2001 | 21.85 | 906.45 | 3.60 |
| 2002 | 22.75 | 920.65 | 3.56 |
| 2003 | 27.78 | 1,096.30 | 4.11 |
| 2004 | 27.72 | 1,070.70 | 3.84 |
| 2005 | 25.50 | 963.95 | 3.35 |
| 2006 | 29.70 | 1,107.35 | 3.70 |
| 2007 | 31.32 | 1,152.02 | 3.67 |
| 2008 | 32.26 | 1,171.44 | 3.61 |
| 2009 | 36.30 | 1,301.74 | 4.12 |
| 2010 | 37.89 | 1,325.34 | 4.00 |
| 2011 | 39.29 | 1,352.41 | 3.94 |
| 2012 | 42.76 | 1,449.43 | 4.07 |
| 2013 | 44.98 | 1,489.05 | 4.09 |
| 2014 | 49.38 | 1,608.21 | 4.23 |
| 2015 | 53.11 | 1,703.04 | 4.33 |
| 2016 | 54.00 | 1,706.76 | 4.23 |
| 2017 | 57.36 | 1,790.00 | 4.24 |
1 Total expenditure on health. TEH and per capita TEH are reported in RM in 2017 prices.
Public funding of health care predominated throughout 1997 to 2017, but public shares did not exceed 61% of TEH (Figure 9.1).

The MNHA categorises sources of health expenditure by the institutions directly incurring expenditure on health care, with the understanding that these institutions can control and finance such expenditure (Ministry of Health Malaysia, 2006, pp. 14–15). Financing sources are then further divided into public and private sources (Box 9.2).
The public sources of health care financing are mainly government agencies at the federal, state or local authority levels, as well as social security agencies in Malaysia. These include:
– The MoH as the main provider of health care in the country.
– The Ministry of Education with its teaching hospitals.
– The Ministry of Defence with its health facilities for providing care mainly to military personnel and their dependents.
– State and local authorities providing services mainly related to sanitation, food quality control and vector control services in larger towns.
– The EPF, a fund providing retirement benefits for its members that also permits withdrawals for members’ health care needs.
– The SOCSO, a workers’ compensation scheme that provides financial benefits when workers suffer disabilities due to work-related injuries and illnesses.
The main private sources of health care financing are:
– Private health insurers that pay health care providers for the care consumed by those insured under their programmes.
– MCOs, which are not risk takers but function mainly to administer the health benefits of those who are enrolled in their health schemes. These companies purchase third-party insurance coverage, which is then bundled into the health schemes they sell to individuals as well as to companies.
– Private corporations that pay for the health care consumed by their employees as part of their employment benefit plans.
– Private household OOPPs for health, which refers to the portion of health care payments not paid for by any third-party payers and which are thus borne directly by households.
Most of the public funding for health comes from government agencies, to which the MoH contributed the largest share – exceeding 80% of the total public funding of health annually (Table 9.2). Among the public sources of health financing, the two main social security organisations in Malaysia, the Employees’ Provident Fund (EPF) and the Social Security Organisation (SOCSO), are minor contributors. Although these organisations do incur health expenditures because they finance some health care for their members, health care is not the primary component of their benefit packages. Consequently, health funds from these organisations do not feature prominently in the estimates of TEH in Malaysia. In 2017, the combined health funding from the EPF and SOCSO amounted to only 0.7% of TEH or 1.3% of financing from public sources (Ministry of Health Malaysia, 2019, p. 30). In 1997 – 2017, on average, the annual social security contributions to TEH accounted for only 1.2% of overall public funding.
| Year | Public sources of financing in billion RM1 (% of TEH) | Private sources of financing in billion RM1 (% of TEH) | |||||
|---|---|---|---|---|---|---|---|
| MoH | Other government agencies2 | Social security3 | Private insurance | OOPPs | Private corporations | Other4 | |
| 1997 |
|
|
|
|
|
|
|
| 1998 |
|
|
|
|
|
|
|
| 1999 |
|
|
|
|
|
|
|
| 2000 |
|
|
|
|
|
|
|
| 2001 |
|
|
|
|
|
|
|
| 2002 |
|
|
|
|
|
|
|
| 2003 |
|
|
|
|
|
|
|
| 2004 |
|
|
|
|
|
|
|
| 2005 |
|
|
|
|
|
|
|
| 2006 |
|
|
|
|
|
|
|
| 2007 |
|
|
|
|
|
|
|
| 2008 |
|
|
|
|
|
|
|
| 2009 |
|
|
|
|
|
|
|
| 2010 |
|
|
|
|
|
|
|
| 2011 |
|
|
|
|
|
|
|
| 2012 |
|
|
|
|
|
|
|
| 2013 |
|
|
|
|
|
|
|
| 2014 |
|
|
|
|
|
|
|
| 2015 |
|
|
|
|
|
|
|
| 2016 |
|
|
|
|
|
|
|
| 2017 |
|
|
|
|
|
|
|
Over the years, funds from private health insurers have gradually increased, reflecting the uptake of private health insurance in Malaysia. In 2005, about 15% of the population had some form of health insurance cover (Central Bank of Malaysia, 2005, p. 58). By 2014, the coverage had increased three-fold to 45% of the population, or about 14.7 million people (Malaysian Productivity Corporation, 2016, p. 112).7 In 1997, private health insurers financed 4.0% of the nation’s TEH, and this share increased to 8.8% in 2017 (Table 9.2). In contrast, the financing component from private corporations dropped from 7.2% of total health financing in 1997 to 2.3% in 2017, perhaps as a result of corporations purchasing third-party health insurance cover for their employees instead of self-insurance or obtaining the services of managed care organisations (MCOs). The predominant private financing source in Malaysia from 1997 to 2017 remained private household OOPPs, which made up on average 74.7% of the annual private health expenditure or 37.6% of the annual TEH in Malaysia. In fact, private household OOPPs is one of the main financing sources for health care in Malaysia, second only to the MoH (Table 9.2).
From the perspective of household welfare, private funding of health care is not desirable. Services provided by government agencies, including the MoH, are mainly funded through general taxation (Reference Rozita and SararaksRozita, 2000). As in most countries, taxation in Malaysia has been structured to ensure that the wealthy are required to pay more in taxes as a proportion of their income than the poor. The progressive nature of taxes in Malaysia is reflected in the funding of health care partially from general taxation (Reference Yu, Whynes and SachYu et al., 2008). Regardless of contribution, entitlement to care remains the same. This makes for a fairer distribution of the burden of health funding. In addition, this form of public funding has several welfare-enhancing features, including fund pooling and pre-payment (Box 9.3), which protects households from financial catastrophe resulting from health payments.
Are these lauded pre-payment and fund pooling features absent in private funding sources? Not quite, as these features are also present, albeit to a limited extent, in some private funding sources, including private health insurance and private corporations. However, the financial risk protection these mechanisms confer is restricted to those who have bought private insurance cover or those with formal employment that provides health benefits. Unfortunately, in the case of Malaysia, funding of health care from these private sources pales in comparison to private household OOPPs for health care, a financing source that has neither pre-payment nor fund pooling features (World Health Organization, 2010, pp. 5–6).
Pre-payment for health care describes a situation in which payment for health care is made in advance of the need for care. As a person’s health, and thus their need for health care, is uncertain (Reference ArrowArrow, 1963), it would be difficult for anyone to have enough savings to cover all health care eventualities. Pre-payment circumvents this problem by ensuring that care is paid for in advance and will be made available when needed.
Fund pooling refers to the pooling of collected health funds before payments are made to providers (World Health Organization, 2010, p. 4). This is intended to distribute the financial risks of ill health among a pool of people. Once a person contributes to the pooled funds, they are entitled to health care paid for from the pool. However, restrictions may apply to such payments and may be related to the types of services to be funded, levels of co-payments and other financial limits.
Private household OOPPs for health care is the one source of health financing with the highest potential to impact household welfare adversely, especially for poorer households (World Health Organization, 2010, p. 5). A multi-country assessment has shown that household financial catastrophe caused by OOPPs for health care can only drop below negligible levels if that country’s OOPPs are below 15–20% of TEH (Reference Xu, Saksena, Jowett, Indikadahena, Kutzin and EvansXu et al., 2010). In 1997 to 2017, during which health expenditure has been reliably estimated, the levels of OOPPs for health in Malaysia have consistently exceeded this threshold (Ministry of Health Malaysia, 2019, p. 24). Despite this, the levels of financial catastrophe arising from health care payments in Malaysia have been surprisingly low. In 1998, when OOPPs for health made up 35.7% of TEH, only 0.8% of households paid OOPPs for health care exceeding 25% of their non-food expenditures (Reference van Doorslaer, O’Donnell, Rannan-Eliya, Somanathan, Adhikari and Gargvan Doorslaer et al., 2007).
These large OOPPs were concentrated in the richer households. In 2009, OOPPs made by only 0.2% of households in the poorest quintile exceeded the 25% of non-food expenditure threshold as compared to 0.55% of households in the richest quintile (Health Policy Research Associates et al., 2013, p. 37). Thus the situation in Malaysia appears to defy the conventional wisdom that high levels of OOPPs for health in a country lead to high levels of household financial catastrophe (Box 9.4).
The observation that high OOPPs in Malaysia have not appeared to create household financial catastrophe or differences in utilisation across income is surprising and points towards the importance of checking intuition with data and disaggregating populations when attempting to model health systems. While this finding is welcome, it should not be assumed that this state of affairs will automatically persist if current arrangements between the public and private sectors remain the same. Indeed, systems often have both zones of stability and tipping points outside of these zones, where change can be swift and dramatic. As such, continued close monitoring of public and private health care spending and the development of causal models that predict impact on household financial security are important.
The explanation may lie in the fact that, for most households in the country, health care remains affordable. In 2009, on average, OOPPs for health made up only 1.1% of the average household expenditures, with the poorest quintile of households committing only 0.7% of household expenditures to pay for health care and the richest households a 1.5% share (Health Policy Research Associates et al., 2013, p. 32). The situation in Malaysia supports the findings from recent international comparative work on financial risk protection for health (Reference Wagstaff, Flores, Hsu, Smitz, Chepynoga and BusmamWagstaff et al., 2018a; Reference Wagstaff, Flores, Hsu, Smitz, Chepynoga and Busmam2018b). These studies suggest that the levels of financial risk protection offered to the population may not depend on health expenditure as share of a country’s GDP but on shares of TEH that are pre-paid, especially through taxes and other mandatory contributions. In 2009, pre-paid sources of financing8 made up 69.7% of TEH, with government agencies funding up to 59.7% of TEH, most of which came from taxation (Ministry of Health Malaysia, 2019, p. 25). It would seem that the high levels of pre-payment inherent in the taxation-funded Malaysian health care system have conferred protection against financial catastrophe for most of the population in the country.
Financial risk protection aside, there are arguments to suggest that health care resources in Malaysia may not have been allocated in a manner that yields maximum health benefits (Ministry of Health Malaysia & Harvard T. H. Chan School of Public Health, 2016, pp. 87–91). Partially due to lifestyle changes in the Malaysian population, NCDs are emerging as a major health issue in the country. In 2015, the prevalence of hypertension and diabetes among the adult population in Malaysia was 30.3% and 17.5%, respectively (Institute for Public Health, 2015, p. 22). More alarmingly, about half of the adults with these conditions were unaware of them and thus did not seek treatment. NCDs such as hypertension and diabetes should be identified and managed in a primary care setting (Reference Varghese, Nongkynrih, Onakpoya, McCall, Barkley and CollinsVarghese et al., 2019). However, the strength of Malaysia’s well-established public primary care delivery system lies mainly in the provision of acute care services related to communicable diseases, minor ailments and maternal care (Reference Mustapha, Omar, Mihat, Noh, Hassan and BakarMustapha et al., 2014). Some re-orientation of thinking would be required for the expansion to the country’s primary care system to manage the increasing burden of chronic NCDs effectively.
Strengthening the primary care system in Malaysia would require substantial financial investment. However, the patterns in TEH show otherwise. It has been estimated that Malaysia spent 49% of TEH on secondary and tertiary care and only 17% on primary care (Ministry of Health Malaysia & Harvard T. H. Chan School of Public Health, 2016, p. 87). The pattern of government spending was even more skewed, with only 11% of the expenditure allocated to primary care as opposed to 65% to secondary and tertiary care services. However, more disconcerting is that shares of health expenditure for primary care services declined from 13% in 2008 to 10% in 2010.
This brief review of the available national expenditure for health appears to indicate the increasing prominence of private funding of health care, particularly the OOPPs component, in Malaysia. Malaysia’s situation is different from that of many other countries, such as South Korea, Taiwan and Japan, where public funds are used to pay private health care providers. In this country, public funding is mainly channelled to the public health system; likewise, private sources fund the private health sector. Thus the rise of private health funding in Malaysia is likely to be mirrored by a similar rise in private provision of health care.
9.3 The Expansion of the Private Health Sector in Malaysia and Its Impact on Health Care Financing
Public and private provision of health care have long co-existed in Malaysia. However, the size of these two sectors, as well as the composition of health care providers, have changed over the years.
In the early days, private health care providers did not feature prominently in the health landscape and consisted mainly of single-doctor clinics in the larger towns. Reference RoemerRoemer (1991, pp. 402–4) noted that in 1984, the public health care system, of which MoH facilities made up the largest component, was the backbone of health care delivery in the country in terms of geographic coverage and health infrastructure. However, rapid development of the private health sector started in the 1980s, and this was more apparent in the hospital sector (Reference CheeChee, 2008). In 1980, there were only 50 private hospitals with 1,171 beds, or 5.8% of all acute hospital beds in the country (Reference CheeChee, 2008). Over the next 5 years, the number of private hospitals more than doubled to 133 with 3,666 beds, or 14.5% of the country’s acute hospital beds. Since then, the capacity of private hospitals has continued to increase at a faster pace than that of public hospitals such that by 2017, the share of private hospital beds had increased to 27.3% of all acute hospital beds in the country (Ministry of Health Malaysia, 2018a). In the same year, approximately 30% of all acute hospital admissions were in private hospitals (Ministry of Health Malaysia, 2018a).
Growth of the private health sector was not just evident from the numbers of hospital beds alone but also from the diversity of health care facilities in the country. The MoH is the main regulator of the private health sector. Prior to 1998, the ministry regulated only three categories of private health facilities: hospitals, maternity homes and nursing homes. Since then, this list has expanded to include psychiatric hospitals, ambulatory care centres, psychiatric nursing homes, blood banks, haemodialysis centres, hospices, community mental health centres and medical and dental clinics. The MoH currently regulates a total of 12 distinct categories of private health care facilities in Malaysia (Table 9.3).
| Facility | 2007 | 2010 | 2017 |
|---|---|---|---|
| Medical clinic | 2,992 | 6,442 | 7,571 |
| Dental clinic | 937 | 1,512 | 2,137 |
| Hospital (beds) | 195 (11,291) | 217 (13,186) | 200 (14,799) |
| Maternity home (beds) | 21 (175) | 22 (97) | 16 (50) |
| Nursing home (beds) | 10 (228) | 12 (263) | 22 (700) |
| Hospice (beds) | 3 (28) | 3 (30) | 2 (17) |
| Ambulatory care centre (beds) | n.a. | 36 (125) | 100 (186) |
| Blood bank | n.a. | 5 | 4 |
| Haemodialysis centre (chairs) | n.a. | 191 (2,195) | 450 (484) |
| Community mental health centre (beds) | n.a. | 1 | 1 |
| Combined ambulatory care centre and haemodialysis centre (beds/chairs) | – | – | 1 (14/21) |
n.a. – not available
The expansion of the private health sector in Malaysia has had a direct impact on the public–private mix in health financing. The provision of public health care is mainly financed by general taxation. Other minor funding sources for public health care are private household OOPPs, employer-sponsored care, private health insurance and EPF and SOCSO. In 2017, 97.6% of funding received by MoH hospitals came from general taxation, 1.9% was from OOPPs, 0.3% was private health insurers and 0.2% was from EPF and SOCSO (Ministry of Health Malaysia, 2019, p. 78). The main reason these sources play a much less significant role in financing public health care is because public funds from taxation have been used to keep user fees9 low for most services provided in public health facilities (Reference RohaizatRohaizat, 2004). The government legislates user fees for MoH facilities (Reference Ng, Barber, Lorenzoni and OngNg, 2019). Although these fees are meant as a tool for cost recovery in public health facilities (Malaysia, 1990, p. 353), they are much lower than the actual cost of delivering the services. It was estimated that the cost of an outpatient visit to a MoH hospital in 2009 ranged from RM 77.46 to RM 129.11 (Institute for Health Systems Research, 2013, p. 6). The comparable legislated fees for the first specialist outpatient visit to a MoH hospital would have been RM 30.00 if the patient had been referred by a private clinic and free if the referral had come from a public clinic (Government of Malaysia, 1982). The fees for subsequent visits were RM 5.00 for each visit. In 2014, medical fees billed to patients amounted to only 1.4% of the ministry’s operating expenditure (Ministry of Health Malaysia, 2015, pp. 32–6). The shortfall was made up using general taxation.
In contrast to the public sector, private health care providers do not receive direct government funding to provide health care services to the public. In consequence, fees in the private sector are set at cost plus profits and are thus higher than those in the public sector. As a measure to ensure that such services remain affordable, the government regulates professional medical fees charged by doctors practising in private facilities (Government of Malaysia, 1998).10 In 2013, a patient would have had to pay RM 80 to RM 235 for the first specialist outpatient visit to a private hospital and RM 40 to RM 105 for subsequent visits (Government of Malaysia, 2013). This excludes fees for drugs, investigations and other administrative charges. In 2012, the average household monthly income per person was RM 1,451 (Department of Statistics Malaysia, 2013, p. 12). Payment of fees for private health care services comes from a variety of sources. As part of their employment benefit packages, employees’ health care may be paid in full or partially by employers. The health care for persons who have purchased private health insurance may be paid in full or partially by their health insurers. Some EPF members may also withdraw funds to pay for health care. Unlike the public health sector, which receives the bulk of its funding from general taxation, the major funding source for private care is private household OOPPs.
Changing consumer preferences could have accounted for the changes in the public–private mix of health care providers. Over time, increasing consumer purchasing power has allowed at least the rich to purchase the more expensive, yet at the same time perceived to be of higher quality, private care (Reference Chee, Barraclough, Chee and BarracloughChee & Barraclough, 2007). However, the expansion of the private health sector in the 1980s could also be partially attributed to enabling government policies that encouraged private sector participation in all sectors of the Malaysian economy, including the health sector. The British welfare philosophy on health care, which emphasised public provision and funding of care for all, had guided the early development of the health sector in this country (Reference BarracloughBarraclough, 1999; Reference Chee, Barraclough, Chee and BarracloughChee & Barraclough, 2007; Reference Rasiah, Wan Abdullah and TuminRasiah et al., 2011). Mirroring developments in the United Kingdom itself, where government commitment to these noble sentiments has also been watered down over time, the Malaysian government has gradually changed its stance on public provision and financing of health care to meet the health needs of the country.
In 1983, the government unveiled its privatisation policy to actively increase private sector participation in the development of the country’s economy (Institut Tadbiran Awam Negara Malaysia, 1994, pp. 62–3). This move was aimed at reducing the presence of the government in the economy and at lowering the level and scope of public spending. In the realm of health care, the government encouraged private provision of care, stating that ‘the private sector, including NGOs, will be encouraged to expand and complement the Government’s effort in providing a comprehensive range of health care services for all income groups’ (Malaysia, 1996, p. 549). To aid the public’s ability to purchase expensive private care, the government re-structured the main social security agency for private sector workers, the EPF, in 1994 to allow for a medical savings account mechanism to enable EPF members to withdraw their savings for the purchase of health care (Reference NgNg, 2005). The government also provided tax deductions for medical expenses and for the purchase of private health insurance (Reference Chee, Barraclough, Chee and BarracloughChee & Barraclough, 2007).
The government has not only promoted the development of the private health sector but has also invested in private care. Many private hospitals are fully or partially owned by government-linked companies (GLCs)11 but operate as commercial for-profit enterprises (Reference ChanChan, 2014). These GLCs include IHH Health Care Berhad, a subsidiary of Khazanah Nasional Berhad, the federal government sovereign wealth fund, and KPJ Healthcare Berhad, a public-listed company belonging to Johor Corporation, the investment arm of the Johor state government. Other state governments, including those of Terengganu and Malacca, are also involved in providing private health care. Sime Darby, another GLC, owns hospitals through Ramsay Sime Darby, a joint venture with Ramsay Health Limited, an Australian company. Currently, the proportion of private hospital beds owned by GLCs exceeds 50% of the total private hospital beds in the country (Reference Ng, Barber, Lorenzoni and OngNg, 2019). The provision of private health care by GLCs indicates the extent of the reversal in the government’s attitude towards the provision of health care. Early post-independence efforts that focused on expanding publicly funded health care to the whole country, especially the underserved rural areas, which is a welfare-motivated ideal, had by the 1990s given way to the view that private provision of health care could be a socially acceptable manner of distributing health care, especially to the rich, as well as an acceptable manner of generating government revenue.
Towards the end of the 20th century, the government embarked on an additional avenue to support the expansion of private care in the country. Health tourism, the business of providing health care to foreigners, was born in the aftermath of the 1997 Asian financial crisis as an answer to financially ailing private hospitals in the country (Reference CheeChee, 2007). During this time, private hospitals had to turn from the diminishing pool of local patients who were no longer able to afford private care to foreign patients, for whom favourable currency exchange made it financially attractive to enter the country for health care. Initial government support included the MoH setting up the National Committee for the Promotion of Medical and Health Tourism in 1998 to develop strategies to attract foreign patients (Reference CheeChee, 2007). The responsibility of promoting health tourism in the country has now been taken up by the Malaysia Healthcare Travel Council, a public–private collaborative agency housed under the Ministry of Finance (MoF) Malaysia.12 Continued government support of private sector expansion has now been linked to the support for health tourism, as has been made clear in the Eighth Malaysia Plan, which stated that ‘further development of the health sector, particularly tertiary medical care in private hospitals, will provide a conducive environment for the promotion of health tourism’(Malaysia, 2001, p. 495).
The HSFS conducted in 1985 had foreseen that the private health sector in Malaysia was ‘on the verge of dramatic and explosive potential expansion’ (Westinghouse Health Systems, 1985, p. 3), and in a sense this prediction has come true. However, as seen in the above narrative, the expansion of private health care has generally been welcomed. Private provision of care is seen to complement public provision of care. The government stated its intention to reduce its role in the provision of health care services and instead to concentrate efforts on regulating the health sector (Malaysia, 1996, p. 544). Fears were raised that this would lead to a two-tier health system, with public services, which are perceived to provide a lower quality of care in return for lower fees, being relegated to the poor while the rich can afford expensive, higher-quality private care (Reference Ng, Mohd Hairi, Ng, Adeeba, Tey, Cheong and RajahNg et al., 2016, p. 187). To date, the pattern of health care utilisation, especially for inpatient care, does not appear to support these sentiments.
In 2011, it was estimated that on average, each person in Malaysia had 4.3 outpatient consultations and that there were 111 inpatient discharges per 1,000 population in the country (Health Policy Research Associates et al., 2013, p. 20). The outpatient consultations were equally distributed between public and private health care providers. However, inpatient admissions were predominantly public. Admissions to public hospitals made up 74% of all admissions. However, it is more interesting to note that there was no income gradient in the utilisation of outpatient and inpatient care services. While outpatient and inpatient utilisation were the same across income quintiles, there was a distinct pro-rich distribution for the use of private health care services and, conversely, a pro-poor distribution for public care (Health Policy Research Associates et al., 2013, pp. 55–6).
To increase the accessibility of private care, the government has repeatedly announced its intention to reform the country’s health care financing system to provide ‘consumers with a wider choice in the purchase of health services from both the public and private sectors’ (Malaysia, 2001, p. 495). The financing mechanism that has garnered the most attention thus far has been that of social health insurance (Reference Tangcharoensathien, Patcharanarumol, Ir, Aljunid, Mukti and AkkhavongTangcharoensathien et al., 2011).
Social health insurance is seen as an appropriate replacement for general taxation-financed health care, as both public funding sources, with their pre-payment and fund pooling features, can provide financial risk protection to the public. This remains an important policy consideration in the welfare-conscious governance of the country. To date, there have been no major reforms to the country’s financing system. However, various agencies, including the MoH, have made preparations for the yet-to-happen change, in the absence of which, some of these changes have been diverted to other uses. Changing the way health care is financed in Malaysia from general taxation to social health insurance is a major endeavour that would require a major change in the mindset of health managers. As shown in Case Study 9.1, resistance to change within the public sector can impede the adoption of newer and more efficient accounting systems.
The separate financing and health care delivery systems in Malaysia do not just shape equity of health and financial outcomes. As described within this chapter and elsewhere in this book, this structure has shaped how the health system functions as a whole. Because of the movement of patients and health workforce between the public and private health systems in Malaysia, decisions on financing policies should take impacts on both into account even though the policy may, on the surface, only target one or the other
9.4 Conclusions
This short review of the trends in health financing in Malaysia outlines the rise in private funding of health care, especially private household OOPPs, since the 1980s. This trend is related to the expansion of the private provision of care. With few minor exceptions, there is a clear division between public funding for public care and private funding for private care. With this dichotomy in place, the government has found it increasingly difficult to commit sufficient public funds to meet the growing health care needs of the population. Cost sharing, which describes the partial transfer of the health financing burden from public funding to private pockets, entered the government policy lexicon in the 1980s. To enable cost sharing, the government has put in place policies to enhance the growth of the private health sector to encourage the consumption of private care by the segments of the population that can afford to pay, while at the same time, public funds have been committed to support public provision of care.
In 2018, the government announced that it would explore a health care scheme that aims to create a national health financing scheme ‘to provide assistance for primary care treatment for the B4013 households to ensure comprehensive health coverage’ (Malaysia, 2018, pp. 11–20). Under this scheme, referred to as PeKa B40, which has since been rolled out in April 2019, public funding from general taxation would be used to pay for private care for the poor.14 This new development may herald the tearing down of the wall dividing public funding from private provision, leading to more efficient use of health care resources for the benefit of all in Malaysia.
9.5 Key Messages from Malaysia’s Experience
9.5.1 What Went Well and Not So Well?
For the first 45 years, with a relatively young population, it was possible to achieve relatively good outcomes with relatively low health care expenditure.
However, the system needs to adapt to new challenges to continue reaping such benefits (relatively affordable health care).
With a hybrid public–private financing and delivery system:
◦ The public sector, which is welfare-oriented, uses pooled tax funds to provide:
access and financial protection to the poor, and
protection from catastrophic health expenditure for households – a safety net for all sectors of the population.
◦ The private sector initially complemented the public sector by catering for those who could afford it, but it now has an increasing share of OOPP expenditure due to:
low private health insurance uptake, and
fee-for-service provider payment mechanisms.
◦ This threatens social efficiency in the provision of health care.
9.5.2 Trends and Challenges
Health expenditure is likely to rise (due to an ageing population, epidemiology and technology).
10.1 Introduction
Earlier chapters discussed how health development in Malaysia has been part of a systematic approach to socio-economic development since independence. This chapter elaborates on how information has supported this process. Like most developing countries, Malaysia faced challenges in generating adequate, accurate and timely information to support health development. This chapter illustrates the strategies Malaysia adopted to address those challenges. The chapter also illustrates how components of the health system such as governance and healthcare services stimulated the incremental development of the health information system.
10.2 Nature of Information and Main Sources
The information Malaysia used in supporting health development included health information collected primarily for the health sector and information collected for more general purposes such as population censuses and vital statistics. In this context, the World Health Organization (WHO) has suggested that health information involves the production, analysis and dissemination of information on three major dimensions of health (World Health Organization, 2007):
Determinants of health
Performance of the health system
Health status
The main sources of information are:
Censuses of the population
Household surveys
Civil registration of vital events
Public health surveillance
Medical records
Data on health services
Data on health systems resources in the nature of human resources, health infrastructure and financing
Additionally, there are data on materials such as vaccines and drugs, as well as findings from health systems research. Over time, although in a generic sense the dimensions of the health system and the methods of collection have remained substantially those mentioned above, the instruments used have advanced with the evolution of information technology (IT) and the evolution of health concerns as the country has experienced socio-economic and epidemiological transitions.
10.3 The Era of Rapid Development (1960s–1970s): Health Information Helped Address Health Concerns
During this phase of development, data collection and compilation were mostly manual, resulting in slow, sometimes incomplete data and limited analysis. Data flowed from health facilities to district health offices, where it was compiled and transmitted to state health departments, which in turn did further compilation before transmitting it to the Ministry of Health (MoH) at national level. Each MoH programme had its own data collection system, occasionally resulting in conflicting information. Systems for checking data comprehensiveness were limited. Additionally, there was no central compilation and analysis of information from other agencies such as local authorities, the Ministry of Defence and the Ministry of Education (MoE), as well as private sector health services. Annual reports, such as those of the MoH and the Department of Statistics (DoS), were the most readily available sources of information.
10.3.1 People and Their Health
During the immediate post-independence years, the MoH used a range of information that was already available to develop health priorities and to monitor the implementation of health interventions. For example, empowered by the relevant legislation, the DoS conducted population censuses through household surveys that provided basic information on the number, location and characteristics of the people in the country. The DoS also collected data on births and deaths; police throughout the country, together with hospitals, were responsible for registering and reporting births and deaths. Thus the 1957 census showed that three-quarters of Malaysian people lived in rural areas (Department of Statistics, 1960), and the DoS provided annual population estimates between censuses using data from the existing system of registering births and deaths. Additionally, registering births and deaths provided annual information on fertility and infant mortality. For example, fertility was about three times the replacement level, and infant mortality was high and the associated life expectancy was relatively low (Reference Fernandez, Hawley and PredazaFernandez et al., 1975).
The MoH also collected and compiled data from hospitals on causes of admission and of death. Deaths registered by the police were not usually medically certified. However, the limited available information indicated that most mortality was related to infectious diseases such as malaria and tuberculosis (Reference RoemerRoemer, 1976). Surveys of education status showed that about three-quarters of the adult population (≥15 years of age) were illiterate (Ministry of Education Malaysia, 1967). Similarly, household budget surveys showed that most people in rural areas lived below the poverty line (Reference RoslanRoslan, 2001). Concerns about toddler mortality rates (1–4 years of age), known to be associated with malnutrition, led to a joint applied nutrition programme by the MoH and other ministries (education, information and agriculture). An evaluation study performed in 1979 showed enhanced child nutrition practices and weight gains (Ministry of Health Malaysia, 1982; Chapter 4).
Legislation required the reporting of dangerous and infectious diseases to the MoH, and such information provided the basis for the disease control measures described in Chapter 6. Once the various disease control programmes had been developed, each established its own information system, including the monitoring of disease and deaths and programme activities (Chapter 6).
Household surveys, such as those for 1957–1958 and 1973–1974 (Reference Young, Bussink and HasanYoung et al., 1980), also yielded an assessment of household use of health services and their distribution among different income groups.
10.3.2 Health Workforce
Legislation required the registration of nurses, midwives, doctors, dentists and pharmacists in both the public and private sectors (Chapter 8; Federation of Malaya, 1957), providing annual estimates of the distribution of health professionals. For example, the number of nurses and doctors per head of population was relatively low. Also, while health-related information showed that the major determinants of health were related to the poor living conditions in rural areas, information from the registration of health professionals indicated that most nurses worked in public hospitals, while more than half of the doctors were in the private sector (Department of Statistics, 1964; Chapter 3; Chapter 8). Such information guided the formulation of policies related to human resources (Chapter 8). Annual registration data enabled monitoring of the progress made to increase low numbers in relation to the growing population. In addition, an annual census of doctors and dentists in the private sector carried out since the 1970s (e.g. Department of Statistics, 1975) enabled assessment of the public–private distribution of the health workforce and guided the mobilisation of scarce health professionals, especially for rural areas.
10.3.3 Health Facilities and Services
The MoH routinely collected information on public sector health facilities and their basic activities, such as number of admissions and ambulatory patient encounters. This information indicated that most hospitals and clinics were located in urban centres and that most hospitals in the private sector were relatively small and most were concerned with maternity services. Such information guided planning for expanding the rural health service and strengthening the public hospital network (Chapters 4 and 5). For example, there were an average of two public sector beds per 1,000 people (excluding special institutions) (Federation of Malaya, 1959). This would be considered a relatively high ratio for a young population, although some beds were reserved for patients with tuberculosis and other infectious diseases. At that time, data collected from hospitals were rudimentary, such as number of admissions and patient encounters. It did not permit the evaluation of functions. About 20 years after independence, a purpose-designed survey of hospitals showed low occupancy rates in small hospitals but very high occupancy in larger hospitals in the greater urban centres (Chapter 5; Institute for Public Health, 1983), triggering several initiatives for improving services in smaller hospitals.
In rural areas in 1960, there was only one main health centre per 600,000 people, one sub-centre per 320,000 people and one midwife clinic per 120,000 people (Reference IsmailIsmail, 1971). Data were also collected on the number of visits to health centres for maternity and child health and on public hospital outpatient services. Such information mainly supported decisions related to staff deployment and the supply of medical products, including vaccines, to public sector facilities. After 17 years of rigorous expansion of the rural health service, the MoH conducted a household survey: a high proportion of villages were ‘underserved’, and this finding triggered the re-vamping of the rural health service (Chapter 4) to rapidly increase access to front-line staff through revised staffing patterns and mobile clinic services. In 1968, an environmental sanitation survey in selected rural areas indicated that only 4% of the population was served with piped water, and the remainder obtained water from either unprotected wells or untreated surface water (Ministry of Health Malaysia, 1982), and this triggered a re-vamped approach to rural sanitation (Chapter 7). Annual data compiled and analysed by the MoH enabled the government to monitor progress in comparison to the targets, as discussed in Chapters 4–8.
10.3.4 Health Financing
During this phase of development, information available on health financing was mostly from the government’s financing of health services and their administration in the public sector. At about the time of independence, public sector expenditure on health amounted to about 1.4% of the gross domestic product (GDP) (Federation of Malaya, 1957; 1959; 1961; Department of Statistics, 1999; Chapter 9). Since the 1970s, the annual census of private doctors, dentists, maternity homes and hospitals also reported revenues of, and expenditures incurred in, related private practice (Department of Statistics, 1975). Central government agencies used this annual census mostly to monitor growth in private health sector employment and economic activity. Household expenditure surveys such as that for 1957–1958 yielded an estimate of households’ health-related expenditures (Reference RoemerRoemer, 1976; Chapter 9).
10.3.5 Information Supported the Assessment of Progress
10.3.5.1 Effectiveness
Household surveys indicated that although still high, poverty, closely associated with health status in Malaysia, had declined by 1980 to 37% of the population (46% in rural areas) (Chapter 3). Registers of communicable diseases indicated that substantial progress had been achieved in the incidence of diseases usually associated with childhood, such as mumps and whooping cough (Chapter 6; Ministry of Health Malaysia, 1982). This progress was reflected in the fall in communicable diseases as a cause of death in mortality statistics compiled by the DoS and in infant and maternal mortality during the period (Department of Statistics Malaysia, 1991; Chapters 3–7).
10.3.5.2 Costliness
Information on the annual expenditure on health service delivery and administration was available only for the public sector. The government used such information as part of the annual review process, and the evaluations were associated with the preparation of the Malaysia Plans and their mid-term reviews. Also, although the DoS collected some limited information on the private practices of doctors, dentists, hospitals and maternity homes, this was not aggregated to obtain an overall picture nor used in planning. Estimates indicate that overall annual expenditure was under 2% of the GDP for the substantial health improvements recorded during the 1960s and 1970s.
10.3.5.3 Equity
Malaysia used a variety of instruments and data sources to produce a useful assessment of equity in the distribution and access to health services, outcomes and financial burden. Disaggregation and analysis of the various types of data for demonstrating trends in differences between urban and rural areas and between population groups provided evidence on progress towards the goal of reducing inequity illustrated in Chapters 3–7. Physical access to healthcare improved in rural areas. Household surveys indicated that spending on public healthcare benefited mostly those living in poverty and with lower household incomes (Reference Young, Bussink and HasanYoung et al., 1980).
10.4 The Era of Transition and Consolidation (1980s–1990s)
In the two decades of the 1980s and 1990s, Malaysia experienced a major socio-economic transition, with most people becoming urban-based, a lower proportion of dependent children and a larger proportion of young adults. The success in the prevention and management of communicable diseases also led to an epidemiological transition. These changes drove the need for better health-related information. International development in IT and the growing capacity and competence in the MoH for managing healthcare services (Chapters 4, 5 and 8) facilitated and supported the further development of health-related information.
10.4.1 People and Their Health
The population censuses, vital statistics, disease registers and surveys of internal migration continued to provide information on population growth and characteristics as well as disease occurrence. The MoH used this information to assess the population covered by services such as immunisation and to assess the progress made in reducing mortality and disease incidence. Household living condition surveys indicated that poverty was substantially reduced during the 1980s and 1990s (Chapter 3). Nevertheless, continuing concerns regarding possible lags in reaching the poor and their health led to health assessments of the very poor to ascertain the appropriate support to be provided (Ministry of Health Malaysia, 1992).
However, changing disease patterns drove the need for better information. For example, non-communicable diseases were not notifiable, and the only available data were those collected from admissions and deaths in public sector hospitals. Similarly, dental health data were limited to the provision of dental service. The need for community-wide information led the MoH to initiate large-scale population-based surveys that were to become a regular feature in the future. An example is the first National Health and Morbidity Survey in 1986–1987, a comprehensive household survey on access and use of health services, health-related behaviour and morbidity from non-communicable diseases such as hypertension and diabetes mellitus (Institute for Public Health, 1988). The survey was repeated in 1996 (Institute for Public Health, 1999) and more frequently in subsequent decades. Other examples include oral health surveys of six-year-old school children (Dental Division, 1972a) and of adults (Dental Division, 1972b), which provided data on oral health and the need for services. Such surveys subsequently formed a regular surveillance system on oral health.
Another aspect of health information was health systems research (HSR). The driver motivating the development of HSR was the thrust to improve management within the MoH to respond better to the national policy of improved effectiveness and efficiency (Chapters 4 and 5). Beginning with a small unit within the Institute for Public Health, which at the time was mainly a training institution, HSR proved its value to the MoH and was soon developed into a major programme with international credentials, subsequently meriting its own institution.
10.4.2 Health Workforce
During this phase of development, new legislation commenced requiring the registration of additional categories of personnel – assistant medical officers, opticians and optometrists – thereby increasing the human resources information database. However, as the numbers of health professionals increased, the system’s capacity for updating the database regularly was limited (World Health Organization, 2014). Therefore, the registers maintained by the respective boards became less valuable as a source of information for planning and policies regarding the health workforce. Mainly, the boards used the information to regulate professionals (Chapter 12). Meanwhile, information required for health workforce planning was deficient, contributing to gaps in planning. For example, the progressive transfer of health personnel education from the MoH to the MoE resulted in information lags between the two ministries, creating a barrier to forward planning by the MoH, the main user of health personnel. Furthermore, the MoE did not obtain data from all sources that produced health personnel, namely private sector institutions and foreign institutions. The time lag and incomplete data later resulted in serious problems of employment, as discussed in Chapter 8 and Case Study 8.1.
Box 10.1 illustrates the initial development of HSR in Malaysia.
Prior to 1980, the general perception was that research was the prerogative of researchers in research institutes who published results in journals, and health system managers had little interest in or access to such information. The Fourth Malaysia Development Plan (1981–1985) adopted health systems research as a tool to provide appropriate focused information to address the problems experienced in implementing programmes (Reference PathmanathanPathmanathan, 1988). Few researchers were available or had the competence to perform such research.
A small group of staff at the Public Health Institute developed short training programmes specifically designed for multi-disciplinary teams of staff who managed health districts, hospitals and state-level health programmes. This training programme eventually gained international recognition and was replicated in several countries (Reference Varkevisser, Pathmanathan and BrownleeVarkevisser et al., 2003). The programme aimed at providing basic research competence to a wide array of health staff and at encouraging the use of information in decision-making at every level in the health system. Examples of the programme’s outputs included measles immunisation coverage in a local area improving from 44% to 66%, reduced instances of non-availability of prescribed medication at dispensing counters through improved local record-keeping of medicine stocks, and reduced waiting times at hospital outpatient clinics by re-deployment of staff and re-scheduling of their work programmes.
Lessons arising from the experience included the need to discourage beginner teams from selecting complex problems. For example, an attempt to compare the cost-effectiveness of the ‘flying doctor’ services versus static clinics for remote population groups resulted in frustrating and inconclusive findings. Conversely, successful projects such as the measles immunisation spurred state-level managers to expand the initiative state-wide and seek means of ensuring that every client contact with the health system, whether in a hospital or a private clinic, would be an opportunity to encourage immunisation.
Thirty years after its initiation, the programme continues to flourish, largely because healthcare managers at every level of the system appreciate its usefulness and have adapted it in various forms to suit their particular needs and constraints.
10.4.3 Health Facilities and Services
Information from the sources described earlier in this chapter continued to provide data that showed, for example, that although the number of total hospital beds increased, the beds-to-population ratio in the public sector declined, partly compensated by the substantial rise in private sector beds (Chapter 5). Data showing the rising prevalence of small private hospitals was a factor in triggering the formulation of new legislation to regulate private hospitals. Similarly, data showing the increased utilisation of health centres in the public sector for ambulatory care contributed to the transfer of outpatient services from hospitals to health centres (Chapter 4). The introduction of the quality assurance programme (QAP) in several MoH programmes contributed to better data quality, such as in the accuracy in International Classification of Diseases (ICD) coding of deaths or discharges from hospitals. It also resulted in better use of information, as the QAP required evidence of remedial measures by institutions, whose performance on selected indicators suggested the need for immediate improvement (Chapter 5).
10.4.4 Health Financing
As described earlier, information on health expenditure was limited to that in the public sector, and there was uncollated and limited information on the private sector. Rising concerns about the sustainability of the healthcare financing system prompted the need for more comprehensive information on health expenditure. The first major assessment of healthcare financing was carried out in the 1980s by external consultants (Westinghouse Health Systems, 1985) in conjunction with the study of the possible introduction of social health insurance in Malaysia (Chapters 3 and 9). The study provided sufficient information for a policy decision not to implement social health insurance. A household health expenditure survey provided information on out-of-pocket expenditure on health for 1996 (University Malaya, 1999). This led to awareness of the need to gain better understanding of the financial implications of the structural changes taking place to households and the financing of public and private health services. The MoH has undertaken recent estimates on health financing of both the public and private sectors for the late 1990s and consequent years (Malaysian National Health Accounts Unit, 2017). These studies indicate that health financing as a proportion of the GDP rose from 1983 to 2000, with an increasing proportion from the private sector (Chapter 9). This information shows that the government policy of placing greater emphasis on the provision of private health services has a price, and there is a need to provide public sector services as part of the social safety net.
10.4.5 Information Technology Development
Struggling with the increasing amount and varied quality of data generated by the different programmes, the MoH took a significant step towards improving the accuracy and comprehensiveness of health information. It established a central information documentation unit responsible for routinely collating information on all programme activities; checking comprehensiveness and accuracy; and analysing and publishing information on health status, human resources and health service delivery, using DoS information as the denominator. These publications became the source of official information, replacing the several different reports published by individual programmes (i.e. Information and Documentation System) (Ministry of Health Malaysia, 2001; Reference SelvarajuSelvaraju, 2006). The rising availability of computerisation supported the implementation and effectiveness of this initiative to centralise and standardise data generated by the MoH. Progress was incremental, dictated by the cost of new technology and the capacity for training staff at district and state levels to acquire computer literacy.
Another important development was the proposal to establish a telehealth programme, beginning with a Telehealth Pilot Project (Ministry of Health Malaysia, 1997; Suleiman, 2001) to increase IT use to promote the integration of the collection of health information from a variety of sources. Three major modes were envisaged:
Lifetime health plans
Teleconsultation
Information and education
The first was to provide a lifelong personal health record linked to an electronic medical record. The second was to consist of a multimedia network for face-to-face consultation of individuals and health professionals or among healthcare providers to enhance clinical support. The third was to establish knowledge databases and interactive training programmes and make health information available to the public and to health professionals. By 2000, several projects had been initiated, such as the Medical Care Information System for collecting patient information in MoH hospitals, the Communicable Disease Control Information System for collecting information for the surveillance and management of communicable diseases, and the Maternal and Child Health System for collecting and analysing information from MoH services (Ministry of Health Malaysia, 2002).
As one of the pioneering efforts in telehealth globally, the Telehealth Pilot Project encountered numerous implementation challenges and was stopped for re-evaluation in 2000. Subsequently, the scope and financing of telehealth implementation was scaled back. The Information Management Division remains responsible for telehealth as a whole; however, in practice, the various projects emerging from the original initiative have been taken over by the relevant MoH divisions, which determine the pace, scope and objectives in their implementation.
As discussed in detail in Case Study 10.1, systems interoperability was a key obstacle to implementing and scaling up the telehealth project. This continues to be a challenge, with no overall interoperability standard defined yet. At present, interoperability issues are being addressed on a case-by-case basis based on the needs of a particular application or system. The Health Informatics Centre (HIC) has been working to develop and promote the adoption of standards and terminology for the healthcare industry in Malaysia and to audit documentation to ensure data quality. While adherence to standards set by the HIC has been good, data quality remains a work in progress.
10.4.6 Assessment of Progress in Health Outcomes
10.4.6.1 Effectiveness
Household surveys indicated that poverty, a major factor associated with health, declined from about 37% in 1980 to 9% in 1999 (Chapter 3). The registration of births and deaths provided evidence that health service interventions were most successful in reducing infant, maternal and adult deaths. When death rates reached low levels, concerns about data accuracy and comprehensiveness began to surface. For example, as less than half of the deaths were medically certified,1 there was insufficient information on the causes of death. The MoH established a system of confidential enquiry into maternal deaths to provide sufficient information to institute preventive measures for the future. These enquiries also led to the recognition that misclassifications of the cause of death were distorting the disease profiles constructed from this data source. Registers of notifiable diseases showed a continuing decline in the incidence and mortality of the major communicable diseases, while hospital statistics suggested increased morbidity and deaths from non-communicable diseases (Chapters 3 and 6). Household health surveys (Institute for Public Health, 1988; 1999) provided evidence of the growing importance of non-communicable diseases and related behaviour and led the MoH to establish Healthy Lifestyle programmes (Chapter 6).
10.4.6.2 Costliness
Concerns about healthcare financing continued during this phase of development. Studies indicated that Malaysia’s total expenditure on health was relatively low compared to its GDP. Recognising the need for more comprehensive information on healthcare expenditure, the MoH developed the National Health Accounts (NHA) programme. The NHA uses standardised international NHA methodology to provide annual information on health expenditure. The data cover public and private sectors, are adjusted for inflation to support trends analysis, and include aggregated and sufficiently disaggregated information on the sources of funds and expenditure to support policy and planning decisions (Malaysian National Health Accounts Unit, 2015). The data provided by the NHA continued to support efforts to re-organise the country’s healthcare financing system.
10.4.6.3 Equity
The information available for both service coverage and health outcomes of the population in different states indicated that access and use of services continued to improve in those states with the greatest need. Differences continued to prevail, but they became smaller (Chapters 3–7). Household surveys also showed that exempting the poor from fees for public health services lessened the financial burden for the poorer people (Chapter 9).
Health information systems are crucial to creating learning feedback loops that enable health system strengthening. However, the actors who collect the data may not recognise its value, resulting in poor data quality. In developing this volume, we came across several accounts in which data collection and entry were low priorities for both hospital administrators and ground-level medical personnel, who were motivated by tasks that had direct impacts on patient outcomes. When data were used to evaluate and improve hospital performance, however, hospital administrators responded by making proper data entry a high priority and communicated that to the hospital workforce (Figure 10.1).
Reinforcing loop showing how compliance with data collection improves the quality of data, enabling positive impacts on health outcomes. When health system personnel are able to observe these impacts, the intrinsic motivation improves the level of compliance in data collection. Conversely, when this connection is not made, data collection can be perceived as a box-ticking exercise, compromising the quality of data collected.

Health information can be used to improve the implementation of health strategies towards existing goals (single-loop learning). Such learning seeks to improve the performance of the health system within existing paradigms and is important for health system strengthening. The role of household health surveys in the establishment of ‘Healthy Lifestyle’ programmes provides a different example in which health information catalysed a paradigm shift. Here, health information was used to determine whether the existing goals of the health system were appropriate and adequate (double-loop learning)
10.5 Health Information in the 2000s
10.5.1 People and Their Health
The decennial census of population and inter-census estimates continued, and they showed that the majority of people lived in urban areas, with the possible exception of Kelantan (Department of Statistics, 2011). The proportion of registered deaths that were medically certified increased from 39% in 2000 to 51% in 2014. However, the quality of data on the cause of death remained inadequate for policy and planning. For example, in 2013, the cause of death classification for 30% of deaths was unacceptable. Among the medically certified deaths, 12.5% were assigned to ‘symptoms, signs and ill-defined conditions’; among the non-medically certified deaths, 60% were assigned to ‘old age’ (Reference Omar, Ganapathy, Annuar, Khoo, Jeenanathan, Awaduddin, Yn and RooOmar et al., 2019). The continued use of household health surveys provided more abundant information on health-related behaviour and the characteristics of the users of services, while some surveys focused on specific health aspects such as adult nutrition (Institute for Public Health, 2014), non-communicable diseases (Institute for Public Health, 2015), maternal and child health (Institute for Public Health, 2016), and adolescent (Institute for Public Health 2018) and elderly health (Institute for Public Health, 2019). This information supported the refinement of health strategies and programmes in specific areas discussed in Chapters 4–6.
10.5.2 Health Workforce
Institutional re-organisation transferred responsibility for the pre-service education of most categories of health personnel to the MoE (Chapter 8). As a result, within the MoH, all aspects of human resource management became the purview of the civil service arm of the MoH. As discussed in Chapter 12, the consequence was policies and management focused on MoH staff but not on the health workforce of the country. Information aspects of the health workforce that were essential for policy and planning were dispersed between various ministries and between departments within the MoH. Examples of such information include entry and output from training programmes, entry and exit from the workforce, geographic- and discipline-specific deployment and ratios between various categories. No single agency is responsible for collating, aggregating and analysing nationwide information. Spurred by a WHO effort to construct the health workforce profiles of member countries, the MoH initiated a major study (World Health Organization, 2014) to compile nationwide information that provided sufficient information for identifying key gaps in policies and impending problems in the workforce, some of which are illustrated in Chapter 8. Efforts are ongoing to institutionalise the routine collation and analysis of such information and to strengthen policy and planning by using it to make estimated projections for workforce requirements and supplies for the future.
10.5.3 Health Facilities and Services
The MoH maintains an inventory of health facilities in the public and private sector that enables it to monitor trends in the number of and the capacity of public and private facilities per head of population. This information supports policies and planning, for example, for expanding hospitals or clinic networks (Chapters 3–5). However, information on services availability in health facilities is limited to the public sector. The MoH conducted facility surveys through its Clinical Research Unit (Clinical Research Centre, 2014) in the private and public sector for a few years, creating a comprehensive picture that enabled the analysis of gaps and utilisation patterns, particularly of specialised services in hospitals and clinics. However, in subsequent years, although the private sector provided much of the information required by new legislation, the MoH did not institutionalise mechanisms for collating and analysing such information. The quality of services provided by health facilities in the public and private sectors became available from the quality accreditation programme (Malaysian Society for Quality in Health, 2018; Chapter 12).
Growing management competence in the MoH and international emphasis on evidence-based decision-making in healthcare produced a thirst for a wide variety of information. For example, several clinical specialist groups established disease registers for their specialities to provide evidence of the effectiveness of clinical interventions. In response to requests from MoH programmes, the National Institutes of Health (NIH) conducted an increasing number of studies to evaluate interventions or analyse problems. Examples include evaluation of the cluster hospital concept (Institute of Health Management, 2016), analysis of healthcare demand (Health Policy Research Associates et al., 2013) and attitudes towards tobacco smoking (Reference Tee, Hairi and HairiTee et al., 2012). Similarly, local universities produced increasing numbers of studies related to the Malaysian health system and its programmes. There is a growing challenge in keeping track of such outputs and providing convenient access to researchers and managers.
10.5.4 Health Financing
The NHA programme started by the MoH in 2001 (Ministry of Health Malaysia, 2018) made a major difference to the information available and the periodic assessment of health financing in both the public and the private sector and their relative evolution since 1997 (e.g. Malaysian National Health Accounts Unit, 2017). NHA data are quoted widely in reports and discussions, demonstrating that it has raised wide awareness of the issues related to health financing. Analysis of health expenditure showed substantial growth in health expenditure as a proportion of the GDP, from 3.3% in 2000 to 4.6% in 2015, and the relative importance of private health expenditure, which amounted to almost half (48.5%) of the total (Chapter 9).
10.5.5 Medical Products
In addition to information related to the regulation of pharmaceutical products in Malaysia and the use of pharmaceutical products and medical devices, the MoH has conducted surveys since 2004 on the use and prices of medicines (e.g. Ministry of Health Malaysia, 2006) and also later on medical devices (e.g. Ministry of Health Malaysia, 2009). Price negotiations for the procurement of medicines for the MoH use some of this information (Chapter 11).
10.5.6 Information Technology Development
The initial proposals for the greater use of IT in MoH information systems (Ministry of Health Malaysia, 1997) were further developed in proposals for a Malaysian Health Data Warehouse (MyHDW) (Ministry of Health Malaysia, 2013). This continues to be under development, with all the constraints usually encountered with IT systems development of a very comprehensive nature. By 2016, progress had been achieved in the collection, storage and processing of information on each hospital inpatient and in the production of related reports (Ministry of Health Malaysia, 2018).
The growing interest in producing and using information from research led the MoH to take the lead in establishing a national process to identify research priorities that guide public sector funding for research in Malaysian academic institutions as well as the NIH under the MoH (Reference Suleiman and MericanSuleiman & Merican, 2000). The rapid escalation in the volume of information from different systems created the need to create and maintain websites providing convenient access. It also required discussion forums to disseminate information. The NIH took the lead in collaborating with local and international academic institutions to provide regular forums for disseminating information and encouraging discussion. While this is evidence of progress, many institutions continue to struggle with issues of systematic cataloguing of research and providing access to research products. Another aspect of access to information is that while the MoH has a wealth of data from various sources, researchers outside the MoH system experience difficulty accessing it. Processes for making the data more accessible without compromising integrity are in the developmental stages.
10.5.7 Health Outcomes
10.5.7.1 Effectiveness
Chapters 3–7 demonstrated the substantial gains in health status but also the more recent plateau in infant and maternal mortality and in diseases such as dengue and tuberculosis, and the rapid increase in ill health due to non-communicable disease. Recent studies also indicate potential lacunae in the health information system. For example, a recent multi-dimensional study on urban child poverty shed light on childhood undernutrition, with high levels of stunting and maternal anaemia in the urban poor, which exists side by side with the problem of obesity among children nationwide (UNICEF, 2018). Another study indicated higher levels of avoidable mortality than in comparator countries of the Organisation for Economic Co-operation and Development (OECD) (Ministry of Health Malaysia & Harvard T. H. Chan School of Public Health, 2016). The output of studies such as these served to stimulate the Malaysian health system into making course corrections (Chapter 12).
10.5.7.2 Costliness
Information from the NHA programme (Malaysian National Health Accounts Unit, 2017) provided significant insights into the cost of health services in the public and private sectors, which increased by 1.3% of the GDP during the 15-year period of 2000–2015. This information also gave an indication of the service specialisation of the private sector in medical services and its costliness and increasing share of health expenditure (about 49% in 2015) (Chapters 3 and 9).
A major feature of the health system is technological change in medical care. While the MoH produces studies assessing new technologies and their cost-effectiveness, the use of such information is limited to MoH facilities and insurance agencies (Chapter 5).
10.5.7.3 Equity
Surveillance of poverty levels in Malaysia has shown a continuing fall in poverty levels in all states. However, although the gap has narrowed, there continues to be a higher proportion of people living below the poverty line in states with a higher proportion of people in rural areas (Chapter 3). Some concerns have been raised about the use of the current poverty line and the assessment of poverty in Malaysia (Reference RavallionRavallion, 2019), and suggestions have been made for alternative assessment methods that would better reflect current conditions. Information on estimated life expectancy at birth reflects the continuing difference among states in most cases (Department of Statistics Malaysia, 2017). As far as equity in access is concerned, household surveys show that health services in the public sector provide a degree of access to people in rural areas for most essential services, but the usual disadvantage of distance and travel remains. Although there is a financial burden associated with high out-of-pocket disbursements by those who use medical services in the private sector (Ministry of Health Malaysia & Harvard T. H. Chan School of Public Health, 2016), services supplied almost free by the public sector tend to diminish the financial burden and improve financial access for those most in need.
10.6 Lessons from the Malaysian Experience
Health information systems developed in incremental stages, spurred by growing demands from policymakers and managers from different levels in the healthcare system. The growing managerial competence and increasing complexity of healthcare services contributed to the growing demand for information. Conversely, information provided by the health information systems contributed substantially to the development of the healthcare system and provided evidence for making corrections in the direction of development. User demand contributed to improving the quality and timeliness of information. Digitalisation contributed immensely to the development of the health information system but also presented serious challenges related to governance and human and financial capacity.
During the development process, several information sub-systems grew in response to specific needs. A continuing challenge for the health information system is to co-ordinate and harmonise information generated by different sub-systems. Another continuing challenge is to provide adequate and timely access to information without jeopardising the integrity of various healthcare services.
10.7 Key Messages from Malaysia’s Experience
10.7.1 What Went Well?
Spurred by demands from increasingly competent managers and clinicians, the health information system, in incremental steps:
The utilisation of data and information spurred improvement in data quality.
Continuing efforts are needed to harmonise and standardise data generated by different information sub-systems that evolve with growing healthcare systems.
10.7.2 What Did Not Go So Well?
Inadequate infrastructure, managerial capacity and demands on financial and human resources hampered ambitious digitalisation plans.
In the interests of safeguarding confidentiality, academicians and researchers outside the MoH have inadequate access to health information.
There is inadequate collated, analysed information on private sector healthcare and on occupational and environmental health.
11.1 Introduction
Medical products and devices make up one of the ‘building blocks’ of the World Health Organization (WHO) framework for analysing health systems. Safe and effective medicines, vaccines and medical devices are fundamental to a functioning health system. However, health systems deal with many challenges in trying to ensure that such products are available, affordable, effective and safe and used appropriately (World Health Organization, 2018). This chapter analyses the role of medical products in the development of the Malaysian healthcare system since independence 60 years ago. Medical products as discussed in this chapter include modern (allopathic) pharmaceuticals (both prescription and non-prescription), vaccines, health supplements and traditional medicines but do not cover medical devices. Medical products confer enormous benefits to health. However, they also have potential harmful effects, either through their inherent properties or through misuse and abuse. Therefore, this chapter addresses concerns about medical products’ access and affordability, alongside the aspects of safety and quality.
11.2 The Scene at Independence
Malaysia inherited a system in which traditional medicines were used side by side with modern (allopathic) medicines. Traditional medicines mostly originated from medicinal plants and had their roots in Malay, Chinese or Indian traditional medicine practices (Reference HarunHarun, 2006; Reference HeggenhougenHeggenhougen, 1980; Reference Tate, Khoo and SelvamanyTate et al., 2005). The largely rural population, who had very limited access to modern medical care, depended heavily on traditional medicines. Almost all allopathic medicines were imported from Britain through the British Crown Agents and delivered to the public either through the public sector health service or private sector doctors (general practitioners) or sold in private pharmacies (Reference HarunHarun, 2017). As described in earlier chapters, these health services were largely urban-based. Although there was legislation to regulate practitioners of allopathic medicine, there was no legislation or system to oversee traditional medical practitioners and traditional medical products. During the years immediately before independence, there was little awareness among the public regarding the safety and efficacy of pharmaceuticals.
Furthermore, opium addiction was a serious problem. Therefore, the government enacted several laws (Box 11.1) that sought to:
ensure that potentially toxic medicines and substances were adequately controlled and handled only by adequately trained healthcare professionals;
protect society from adulterated or unwholesome drugs, drugs deleterious to health and counterfeit drugs; and
prevent the public from being misled, resulting in the wrong use of medicines, ignorance of toxicity or ineffective treatment for life-threatening illnesses.
11.3 The First Phase of Evolution (1960–1970s): Focus on Increasing Access
11.3.1 The Driving Forces
Earlier chapters discussed how the first couple of decades following independence focused on increasing access to healthcare for the rural population through integrated development of the health sector within the broader socio-economic development of the country. A key component of the healthcare system was the supply of medicines free of charge to patients who attended public sector facilities. The budget of the Ministry of Health (MoH) bore the cost of these drugs. The number of health facilities, particularly in rural areas, increased rapidly (Chapters 3 and 4), and national programmes for controlling communicable disease spread throughout the country (see Chapter 6). All of these required a reliable supply of medicines and vaccines. Therefore, the initial focus was on the import, storage, distribution and dispensing of medicines (Pharmaceutical Services Programme, 2013).
11.3.2 Import, Production and Purchase of Medicines
For the first 15 years, most medicines were imported, and the Crown Agents had a near monopoly on the import of medicines and vaccines for public sector facilities (Federation of Malaya, 1962; British Resident Selangor, 1903). Subsequently, local agents took over this role. However, parallel import of a patented product from an alternative source was allowed, and this provided a less costly alternative source for a patented product. A few multinational pharmaceutical companies also imported and distributed medicines to the few private pharmacies and wholesalers, which in turn supplied them to private medical practitioners and public sector facilities.
The public pharmaceutical sector initially focused on developing logistics to ensure supply to the rapidly expanding network of healthcare facilities. The MoH constructed a large central Government Medical Store (GMS) that became responsible for acquiring supplies from agents and in turn supplying medicines to all MoH facilities through a transport network. Hospitals and state stores submitted invoices and obtained most of their medicines from the GMS (Box 11.2).
The GMS operated on a trust account of RM 40 million, with which it bought its initial stock.
State stores and hospitals received funds through their budget and used it to purchase supplies from the GMS.
If the GMS was unable to meet a request for supply, facilities could purchase a limited amount from the private sector.
Meanwhile, the GMS progressively developed the capacity for manufacturing medicines, and by 1970, it manufactured more than 150 types of pharmaceutical products, including tablets, large-volume intravenous fluids, injections in ampoules (including morphine and pethidine) and galenicals.1 A few large hospitals supplemented the GMS production capacity by manufacturing intravenous solutions and galenicals for their own use. There were only a few private pharmaceuticals manufacturers, such as Glaxo and Sterling Drugs, which were foreign companies with manufacturing plants in Malaysia (B. Yeap, recollections of early pharmacy services in Malaysia, personal communication to Thomas Paraidathathu, 2016). Moreover, the Institute of Medical Research (IMR) also produced a range of vaccines for a time (Reference Ramanathan, Cheah and DonderoRamanathan et al., 1976). The first Malaysian private pharmaceutical manufacturing company was the Malayan Pharmaceutical Factory (MPF) in Petaling Jaya. By the 1970s, more pharmaceutical manufacturers were set up in Melaka, Sungai Petani, Port Klang and Bangi (Malaysia Competition Commission, 2017). Thus, while hospitals and the GMS catered to the government hospitals, the private pharmaceutical manufacturers catered mainly to the private hospitals and clinics and sometimes, through tenders, also supplied the MoH.
11.3.3 Quality and Safety
During this phase of development, the system relied on the legislation that was already in place. However, from time to time, the MoH also issued circulars to ban the import and use of certain drugs or chemicals, such as phenformin, or re-classified them in the Poisons List to restrict their use. There was hardly any enforcement capacity; therefore, the MoH gradually built up the capacity for oversight. Box 11.3 shows the key landmarks in this process.
Prior to 1985, Malaysia did not require local registration of a medicine. Unless the MoH banned a product, importers or manufacturers could sell it in the country. Additionally, some manufacturers in the country used premises that were unsuitable for manufacturing and preparing medicines (e.g. garages and shophouses). They had a very poor understanding of the concept of good manufacturing practice (GMP). The quality of medicines and their compliance with pharmacopoeia standards were unknown (S. Selvaraja, experiences as a pharmacy regulator, personal communication to Thomas Paraidathathu, 2018). Furthermore, there were no inspections of manufacturing premises or licensing requirements from the MoH.
Also, as local registration of a product was not required, the Malaysian government suspected that some multinational pharmaceutical companies were ‘dumping’ their products in the country. For example, an analgesic product containing the drug dipyrone, which the US FDA2 had banned, was available in Malaysia.
1969: Government Medical Store (GMS).
1969: Pharmaceutical Chemistry Department in the MoH to cater for rising needs.
1970: National Pharmaceutical Control Laboratory (NPCL) for quality assurance of pharmaceuticals.
1976: Pharmacy Enforcement Unit in MoH to enforce legislation related to pharmacy and pharmaceutical trade.
1978: NPCL converted into National Pharmaceutical Control Bureau (NPC) to perform regulatory functions.
1984: Control of Drugs and Cosmetics Regulations in June 1984 ‘marked the dawn of the regulatory era’.
1985: Drug Control Authority under the chairmanship of the Director General of Health for ‘ensuring quality, safety and efficacy of pharmaceutical products prior to marketing’. The NPCB became its secretariat.
However, this period also witnessed the first baby steps for improving the quality of medicines dispensed at public sector facilities. Patients used to bring their own containers to public sector hospitals and clinics for oral solutions, lotions and eye drops.3 Such containers had inconsistent levels of cleanliness and sizes. Therefore, in 1979, the MoH decided to supply medicines in plastic containers, enabling standardised and hygienic packing. Moreover, pre-packing speeded up the dispensing process. In the private sector, quality and safety depended on the professional integrity of the medical profession and private pharmacies and their adherence to professional and legal requirements to prevent wrongful use of prescription medication. In 1983, inspired by the WHO initiative on essential drug lists, the MoH produced its own Blue Book, listing essential drugs for MoH facilities. This formed the basis for standardising the availability of medicines at each level of the facility in MoH services.
11.3.4 Prescription, Dispensing and Human Resources
During the first decade after independence, the very few Malaysian pharmacists trained mainly in Singapore, Australia or the United Kingdom. At the start of the second decade after independence, a local university established a training programme, but its output was limited. As population growth was relatively rapid, the ratio of pharmacists to population remained low. Dispensing medication was the responsibility of medical assistants4 in the public sector facilities and of clinic assistants under the supervision of doctors in private sector clinics. To address the need for personnel, particularly for hospital pharmacies, an allied health profession of dispensers was introduced, with one year’s training in a newly established Dispensers Training School followed by on-the-job training at hospitals. Gradually, the dispensers replaced medical assistants for dispensing in the public sector facilities (Pharmacy and Supplies Programme, 1996; G. Singh, experiences as a dispenser in the early years, personal communication to Thomas Paraidathathu, 2012).
11.3.5 Outcomes
Although there is no direct information on the availability of and access to medicines and vaccines, the success in reducing vaccine-preventable deaths (see Chapter 4) and malaria (see Chapter 6) and the rapid increase in the utilisation of hospitals and clinics (see Chapters 4 and 5) suggest adequate access to and use of basic medicines and vaccines. As discussed in Chapters 4–6, the availability and use of effective vaccines and medicines contributed to the changing profile of hospital bed utilisation.
11.4 The Second Phase (the 1980s–1990s): Strengthening Quality and Safety
11.4.1 The Driving Forces
During the next two decades after independence, Malaysia experienced stable politics, continued economic growth with a few downturns, rapid urbanisation due to rural-to-urban migration, and a demographic and epidemiologic transition (see Chapter 3). The incidence of communicable diseases declined while the prevalence of non-communicable diseases increased. (see Chapters 3–6). Meanwhile, the advent of newer pharmaceutical products and international research on effectiveness and risks changed medical care practices. One example is the management of eclampsia of pregnancy, where the use of magnesium sulfate enabled nurses in more remote settings to initiate effective management without awaiting the availability of a doctor.
11.4.1.1 International Influences
The generic drug industry flourished around the world, and in response, multinationals differentiated their products as better quality and supported by strong research. At the same time, the issue of the increasing presence of counterfeit medicines on the market, especially in some African countries, highlighted the need for stricter regulatory controls and enforcement. While countries like the US, the United Kingdom, Germany and Australia had well-established drug regulatory agencies such as the United States FDA and the Australian Therapeutic Goods Administration (TGA), many developing countries did not have good regulatory control of medicines. The WHO encouraged developing countries to establish regulatory systems for medicines and to participate in international collaboration for sharing of information of reports of adverse drug reactions (ADR) and adulterated and counterfeit medicines (Reference Raranawijitrasin and WondermagegnehuRaranawijitrasin & Wondermagegnehu, 2002).
11.4.2 Import, Production and Sale: Quality and Safety
11.4.2.1 Strengthened Governance Capacity: Legislation and Regulatory Requirements
Concerns about drug efficacy, quality and safety made it imperative that the government take steps to strengthen the governance process. This included the enactment of legislation (Box 11.1), building laboratory capacity and human resource competence for pharmaceutical analysis and for educating manufacturers, monitoring compliance with regulations, and enforcement of regulations. The Control of Drugs and Cosmetics Regulations (CDCR) 1984 under the Sale of Drugs Act established the Drug Control Authority (DCA) and gave it powers. The legislation included two key requirements for pharmaceutical products prior to sale in Malaysia: first, the registration of pharmaceutical products, and second, the licensing of manufacturers and wholesalers and of products for clinical trials. The CDCR established criteria for manufacturing facility location and required suitably qualified personnel, such as pharmacists, chemists and biochemists, and proper quality control procedures, both during manufacturing and for the finished product.
Empowered by the CDCR 1984, the DCA assumed responsibility for ensuring that medicines were safe, efficacious and of suitable quality prior to sale in Malaysia. The DCA implemented three initiatives: first, prior to registration and subsequent sale, the DCA instituted a process that included laboratory testing according to established pharmacopoeias or other standards and the evaluation of a dossier submitted by the manufacturer or applicant (on behalf of the manufacturer). Applications for the registration of imported medicines had to be accompanied by a Certificate of Free Sale (CFS), Certificate of Pharmaceutical Product (CPP) or an equivalent certificate from a competent authority in the country of manufacture, thus addressing the issue of the dumping of products not sold in the country of manufacture. All registered medicines were identified by a unique registration number intended to increase consumer confidence in the product’s safety and efficacy.
11.4.2.2 Stronger Monitoring Complemented by Education and Information
Second, the DCA inspected manufacturers to ensure compliance with GMP guidelines published by the WHO (World Health Organization, 2011). In conjunction, the MoH provided education regarding GMP and established a system to provide reliable information to the public and healthcare providers regarding medical products.
Third, the DCA initiated a pharmacovigilance system through a voluntary reporting system, whereby healthcare professionals and members of the public were encouraged to report suspected ADR. Initially, the number of reports to the Malaysian Adverse Drug Reactions Advisory Committee (MADRAC) was not encouraging. Subsequently, the National Pharmaceutical Control Bureau introduced a number of initiatives such as letters of appreciation to encourage people, especially healthcare personnel, to submit suspected reports. Malaysia has been a participant of the WHO Adverse Drug Reactions Monitoring Programme since 1987 (Reference Raranawijitrasin and WondermagegnehuRaranawijitrasin & Wondermagegnehu, 2002), and reports of ADR are sent to the WHO Collaborating Centre for International Drug Monitoring in Uppsala, Sweden.
The introduction and enforcement of the CDCR is believed to have increased consumer confidence regarding the quality, safety and efficacy of medicines in Malaysia. A number of popular combination products that were available prior to 1985 are no longer available in Malaysia. They included products for which there was no good scientific rationale, such as Franol, which was a combination product for asthma that contained theophylline, ephedrine and phenobarbitone.5 Products without proven efficacy or with unacceptable risk-to-benefit considerations and low-quality, cheap generics became almost non-existent in the Malaysian market.
11.4.2.3 Production Evolved
As a result of the regulatory changes, in the 1990s, government hospitals ceased the bulk manufacturing of pharmaceutical products such as intravenous fluids, eye drops, mixtures and creams because of difficulty complying with GMP requirements.
Simultaneously, the national policy to privatise selected public sector activities reached the pharmaceutical sector. During the 1980s, the GMS had continued to manufacture and supply medicines to government institutions, and the annual turnover increased from RM 100 million in 1984 to RM 150 million by 1994 (R. Kumarasingham, recollections of early pharmacy services in Malaysia, personal communication to Thomas Paraidathathu, 2016). In 1994, the GMS was privatised, and soon, under the name of Pharmaniaga,6 it acquired other manufacturing plants, became a large, fully integrated healthcare company and took on manufacturing, logistics, distribution, sales, marketing and supply of equipment. Pharmaniaga received an initial 15-year concession (up to 2009) for supplying to MoH institutions 700 items on the Approved Products Purchase List (APPL) and set up an integrated information system for the MoH institutions to order and monitor their supply of medicines. Initially, there were complaints of steep increases in prices, but these issues appear to have diminished over time. Stock-outs or low stocks of medicines at public healthcare facilities occurred occasionally, and patients received smaller amounts of medicines and had to refill more frequently.
Meanwhile, the local pharmaceutical industry grew. By the 1990s, the number of pharmaceutical manufacturers increased to more than 50, and all complied with international GMP standards. They also began exporting to other countries. In 1990, Malaysia exported a total of about RM 70 million worth of medicinal and pharmaceutical products (SITC7 541) and medicaments (including veterinary medicaments) (SITC 542), which was equivalent to about 5% of the total chemicals export of the year (Pharmaceutical Society, 2002).
11.4.3 Purchase: Effectiveness and Cost of Medicines
In the face of the growing choice of available medicines, the need for rational choice became a priority, particularly considering the national policy of providing highly subsidised medicines almost free to clients in public sector healthcare facilities. In 1983, the MoH established a system for selecting medicine eligible for purchase by the MoH through the Ministry of Health Medicines Formulary (MOHMF). An MoH review panel comprising representatives from different clinical disciplines uses criteria such as efficacy, safety, budget impact and ethical considerations for selecting items from the MOHMF. Other methods of selection include multi-criteria decision analysis (MCDA). The review panel aims to ensure that selection is transparent, predictable and considers the value to the community of patients and the cost of a drug. For example, if the cost of a drug were so prohibitive that only a fraction of the patients who need it would receive it, it would not qualify for inclusion in the MOHMF. The MOHMF is updated regularly, and in 2017, there were 1,676 drugs in the list. Other healthcare providers in the public sector, such as teaching hospitals and the Ministry of Defence, have their own formularies.
11.4.4 Prescription, Dispensing and Human Resources
For the first 25 years of independence, there was only one pharmacy school in Malaysia, with a small output that was augmented by a trickle of pharmacists trained abroad. In 1990, there were only 1,239 registered pharmacists (less than 1 per 10,000 population) (Ministry of Health Malaysia, 2000). The rapid expansion of the pharmaceutical sector was accompanied by the concentration of the available pharmacists in the private sector. In 1996, 77% of pharmacists were in the private sector (Ministry of Health Malaysia, 2000).
Due to the limited availability of pharmacists, their traditional role in the MoH during the 1950s to 1980s was in functions related to improving medicine quality and safety, enforcing standards for medicines and in the procurement and supply of medicines for patients. In the public sector, dispensing remained in the hands of assistant pharmacists, and in the private sector, largely in the hands of clinic assistants and their supervisory doctors. With the gradually increasing availability of human resources, pharmacists in MoH hospitals began to advise on individualised drug therapy, re-constituting cytotoxic drugs, providing medication counselling and developed drug information systems in hospitals (Ministry of Health Malaysia, 2002). By 1995, three other pharmacy programmes had begun in Malaysia, thereby boosting production output. The first graduates from these programmes began coming into the market by the end of the 1990s.
11.5 The Third Phase (2000s–2010s): Growing Concerns about Affordability
11.5.1 Import, Production and Sale: A Stable Regimen for Quality and Safety
The National Pharmaceutical Regulatory Agency (NPRA)8 succeeded in constructing a good regulatory framework for pharmaceuticals, and it gained international recognition. Co-ordination with customs authorities was strengthened to monitor consignments of products such as saccharin, beta-agonists, precursor and essential chemicals liable to be misused, for example in illegal traffic in narcotic drugs (Ministry of Health Malaysia, 2002). Additionally, the scope of monitoring extended to traditional products adulterated with poisons such as fenfluramine. In 2002, the NPRA became a member of the Pharmaceutical Inspection Co-operation Scheme (PIC/S), an international non-binding, informal co-operative arrangement between regulatory authorities in the field of GMP of medicinal products. This indicated that the NPRA adhered to internationally acceptable GMP inspection standards. Indirectly, it also validated the standard of the local pharmaceutical industry. The NPRA is also an active member of the ASEAN (Association of Southeast Asian Nations) harmonisation initiatives for the regulatory control of pharmaceuticals. In addition, Malaysia was accepted in 2013 into the Organisation of Economic Co-operation and Development (OECD) system for Mutual Acceptance of Data (MAD) in the assessment of pharmaceuticals. New medicines that are needed in Malaysia but that require more evidence of safety and efficacy are sometimes given conditional registration. Recently, a vaccine for dengue was given a two-year conditional registration. Phase IV clinical trials are still to be conducted, and therefore it has not been given full marketing authorisation.
After an initial slow start during the 1990s, the reporting of ADR to MADRAC improved, accompanied by appropriate regulatory action by the DCA. Figure 11.1 shows the rise in the number of received reports from 2010 (7,079) to 2017 (15,936). The MoH conducted post-marketing surveillance of pharmaceutical products to ensure that registered products continued to adhere to stipulated standards of quality and conditions of use.
Number of received reports of ADR.
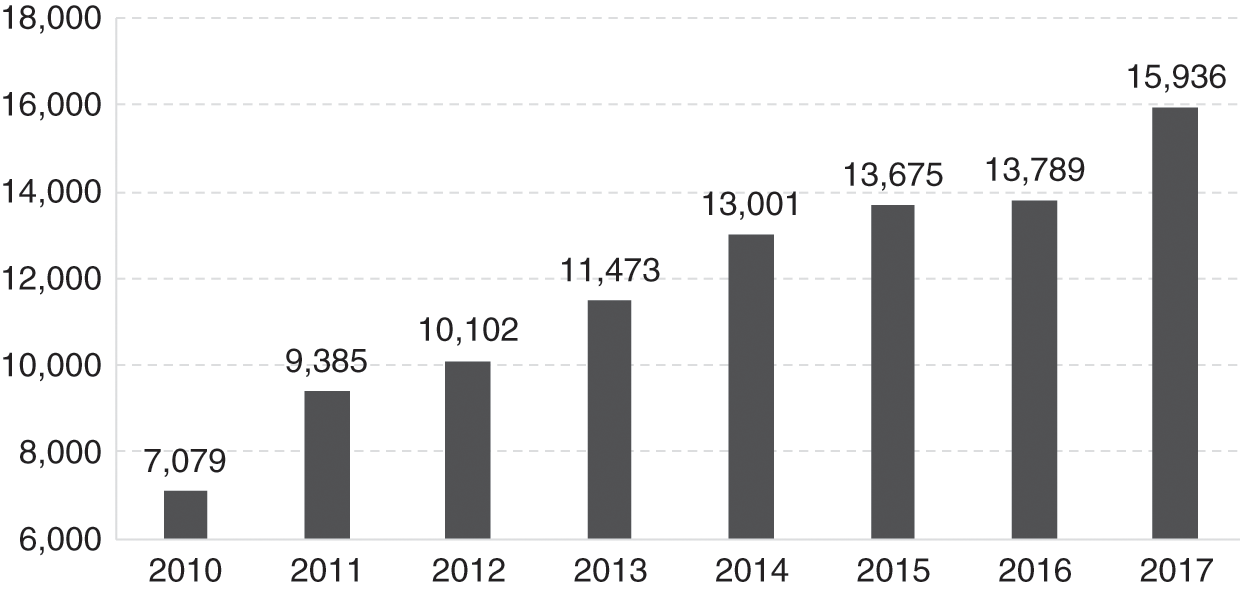
Counterfeit medicines amounted to less than 5% of all marketed pharmaceutical products. A significant contributor to this healthy scenario is the access to good-quality medicines at low or no cost at government healthcare facilities. The instances where counterfeit medicines were discovered involved medicines with high consumer demand such as Panadol and Viagra. Since 2005, a product-specific hologram was introduced as an additional safety feature for all registered drugs.
Advertisements.
In the 2000s, Malaysia adopted a national policy of promoting medical tourism. In response, the Medicine Advertisements Board (MAB) relaxed the conditions related to advertisements for medicines, provided improved guidelines and simplified the approval process for over-the-counter (OTC) drugs, functional medicines and health supplements. However, the industry is pushing for similar relaxations to the direct-to-consumer advertisement of controlled medicines, but this is not allowed. Simultaneously, the MoH strengthened efforts to provide reliable information to the public and healthcare providers through its centralised information centre and programmes such as Know your Medicines and Ask your Pharmacist. Meanwhile, the private sector took the initiative to produce the MIMS (Monthly Index of Medical Specialities), a reference publication for Malaysian medical professionals providing updated prescribing information and drug availability.
11.5.2 Supply Logistics, Prescription, Dispensing: Availability of Medicines
In the MoH system, logistics improved with the increased use of information technology that facilitated modernised inventory management and enhanced storage facilities. The volume of prescriptions in MoH facilities increased rapidly. For example, there was a 12% increase in one year during 2016–2017 (Ministry of Health Malaysia, 2017). Approximately 30–40% of these are repeat prescriptions for patients with chronic illnesses such as diabetes and hypertension who had prescriptions for 3–6 months’ duration. However, dispensing was monthly to monitor for any side/adverse effects, efficiently manage resources, avoid extensive stock holding and reduce medicine wastage resulting from improper storage or expiration. This dispensing practice caused inconvenience and travel costs to patients, congestion, and longer waiting times at pharmacy counters, particularly in the larger healthcare facilities. Several initiatives addressed this challenge. A digitalised Integrated Drug Dispensing System (Sistem Pendispensan Ubat Bersepadu, or SPUB) has enabled patients to obtain their prescriptions at any MoH facility and to do so through an appointment system that enables prior preparation of the prescription, thus drastically reducing waiting times. Other innovations have increased access and convenience. The drive-through pharmacy is a concept borrowed from the fast food and banking industries. The Medicines by Post scheme sends medicines to the patient’s home by a courier company for a fee of RM 6. The Locker4u scheme provides designated lockers, secured by a key/personal identification number (PIN), where patients can collect their medicines from hospitals at their own convenience. Patients who use these initiatives are very satisfied (98% satisfaction) with these services (Pharmaceutical Services Programme, MoH Malaysia, 2016).
As the availability of pharmacists increased, the scope of their service expanded, with more MoH hospitals providing pharmaceutical services such as parenteral nutrition, therapeutic drug monitoring, cytotoxic drug reconstitution, clinical and ward pharmacy services, and medication therapy adherence clinics and promoting quality use of medicine.
11.5.2.1 Human Resources
The production of pharmacists increased rapidly. The number of local pharmacy degree programmes increased rapidly to 22. The expansion was largely due to 17 institutions in the private sector; Chapter 8 discusses this phenomenon. The number of pharmacists per 10,000 population increased 4-fold within 14 years, namely from 1.02 in 2000 to 4.08 in 2014. The profile of the pharmacy workforce evolved rapidly (Figure 11.2). Two factors contributed to a rapid increase in the public sector workforce of pharmacists. First, in 2004, the government introduced a two-year period of compulsory service in the public sector for new graduates. Initially, there were concerns that this move would result in a shortage in the private sector, but it was expected that such a shortage would be short-lived, as market forces would continue to entice them to the private sector.
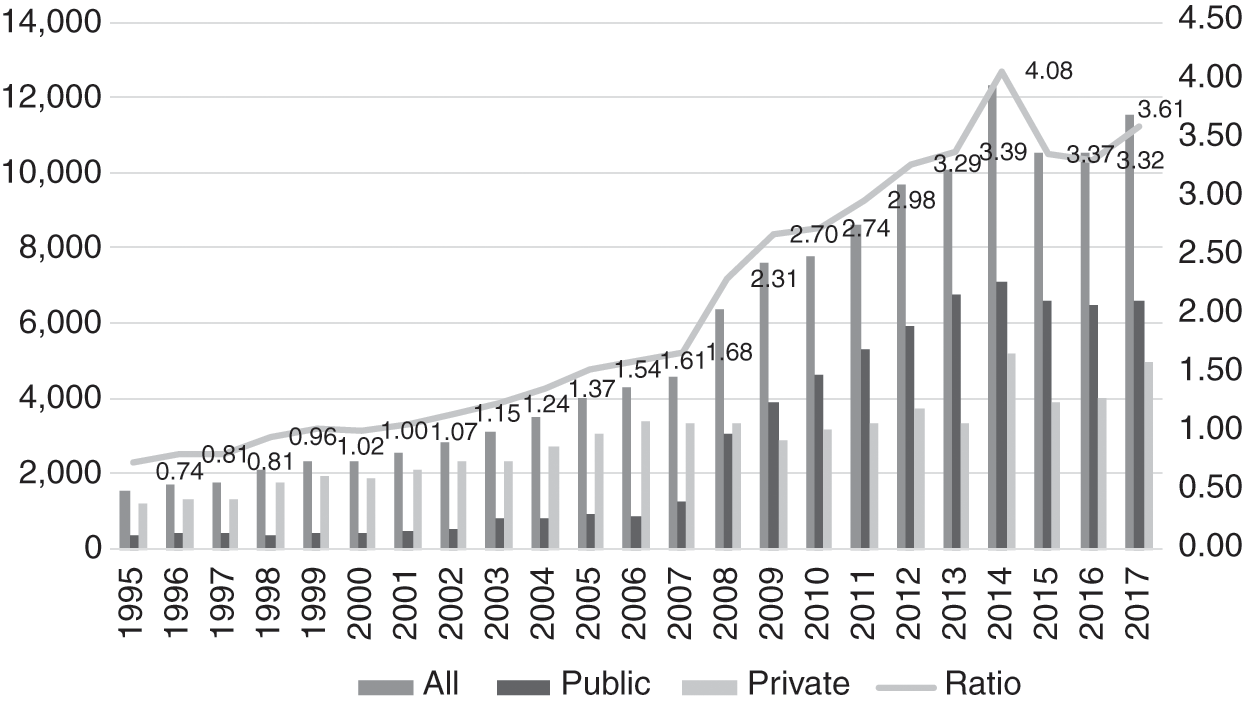
However, a second factor intervened. The government amended its civil service conditions, resulting in pharmacists receiving higher starting salaries and better opportunities for career advancement. As a result, more pharmacists chose to remain in the public sector, and by 2009, the numbers in the public sector overtook those in the private sector. The sudden influx of new graduates was similar to that experienced in the medical workforce, discussed in Chapter 8. Its consequences for the public sector were similar – several administrative adjustments were required to accommodate the new graduates, who required supervision and monitoring during the first years of their service prior to full registration.
Meanwhile, the number of pharmacy assistants continued to increase, rising from 1.01 per 10,000 population in 2002 to 1.87 in 2017 (Figure 11.3). Until 2012, they were almost exclusively in the public sector, when the numbers in the private sector began to increase gradually. By 2005, the number of pharmacists had overtaken that of assistant pharmacists.

The increased availability of pharmacists produced other changes. First, their role in the public sector started to expand gradually to cover direct services to clients. Second, the simultaneous influx of large numbers of new graduates, both medical and pharmacy, stretched the capacity of the public sector to absorb them to the limit. This resulted in a push from the public sector into the private sector, in contrast to earlier years, when the attraction of the private sector had caused movement of both professions out of the public sector. Some indication of the stress to the private sector is the ongoing controversy between the pharmacy and medical professions regarding the separation of prescription and dispensing functions in the private sector. Pharmacists argue that this would be in the best interests of patients in order for them to obtain cost-effective medicines and avoid unnecessary use of medications and their side effects. The counter-arguments from the medical profession include: (a) that the relative scarcity of private pharmacies in rural areas would limit access to medicines, and (b) that ‘patients go to pharmacies to buy medicines after consulting the doctor once, and then continue buying prescription-only medicines without a prescription’. General practitioners (GPs) further acknowledge that in the face of multiple challenges, including a fee schedule that has been unrevised for 27 years, ‘most GPs survive because the sale of medicines provides a small margin of profit’ (Reference PhilipPhilip, 2019). The economic factors underlying the controversy are evident.
The parallel development of dispensing practices in public healthcare facilities and private clinics provides a good illustration of path dependency in health systems. The lack of pharmacists in the early years of the health system (Section 11.3.4) resulted in other health personnel taking on the dispensing role. In public healthcare facilities, economies of scale kept the dispensing role specialised such that assistant pharmacists (Section 11.4.4) and then pharmacists were later able to take on this role. In private clinics, however, prescription and dispensing remained closely linked in the absence of policy or systemic incentives to separate these functions.
11.5.3 Affordability and Pharmaceutical Pricing
In October 2006, in line with WHO recommendations, the Malaysian National Medicine Policy (NMP) (Dasar Ubat Nasional, or DUNas) came into force. It covers all aspects of medicines. The objectives of DUNas are to improve the health outcomes of Malaysians through:
1. Promoting equitable access to essential medicines.
2. Ensuring the availability of safe, effective and affordable medicines of good quality.
3. Promoting quality use of medicines by healthcare providers and consumers.
Affordability is an important component of DUNas to ensure that cost does not become a barrier to equitable healthcare. To this end, DUNas encourages ‘Efforts … to promote healthy competition towards fair, transparent and sustainable cost-effective treatments’ (Ministry of Health Malaysia, 2012b).
Rising healthcare cost is a global phenomenon, albeit the rates grow differently by country. Malaysia’s medical inflation rates for 2019 were forecast to be about 5.7 times higher than that of general inflation (Aon, 2019). While there are many contributing factors to rising healthcare costs, higher drug costs is a significant factor. Drug affordability is a legitimate concern for patients with critical illnesses and those who require chronic therapy. Estimated conservatively, the health expenditure on medical goods in 2017 was 8%, or RM 4.55 billion of the national total health expenditure (Ministry of Health Malaysia, 2019b).
11.5.3.1 Public Sector
The public sector provides care for the majority of patients in Malaysia. For example, 70% of hospital admissions in 2017 were in public healthcare facilities. Hence the government budget allocation for medicine procurement is a concern. The total amount allocated for medicine procurement has remained about the same since 2014 (Figure 11.4) despite a yearly increase in public demand for drug treatment (Figure 11.5). In 2017, the allocation for medicine procurement for the MoH was about 10% (RM 2.38 billion) of the MoH operating expenditure.
MoH medicine expenditure, 2008–2017.

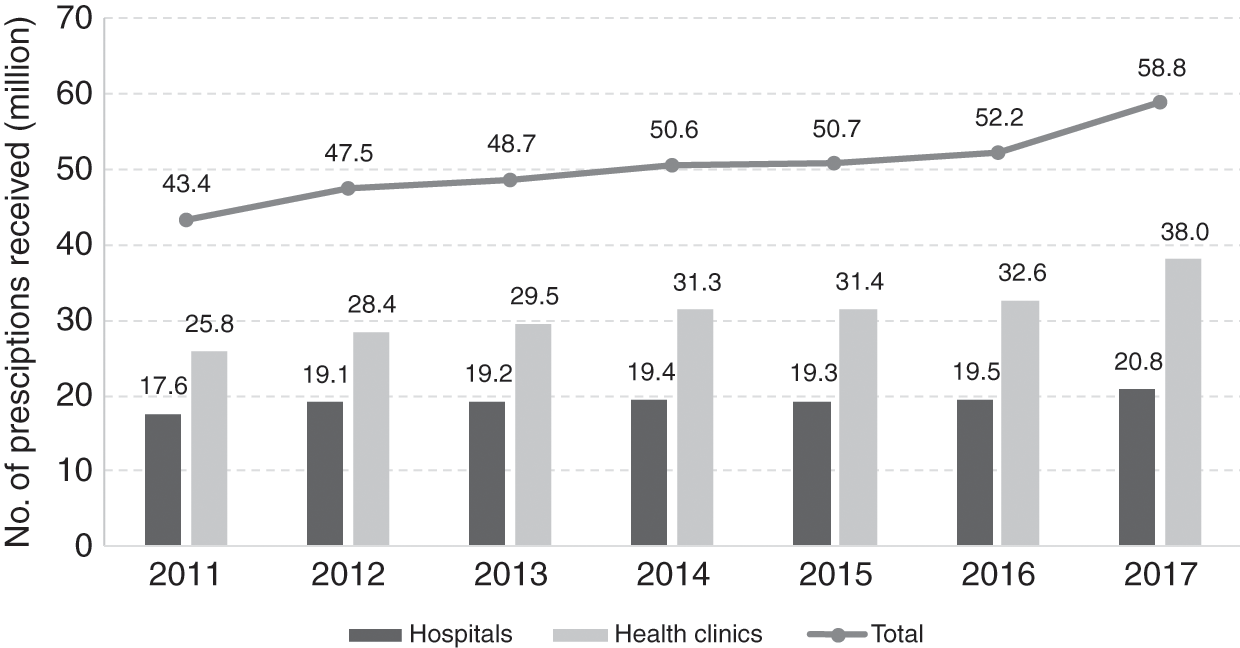
The government has to balance budget limitations against factors such as drug accessibility, value and (opportunity) cost and the rising demand for effective, quality and safe drug treatment. It does this through careful planning and procurement strategies.
The MoH practices an open tender policy for pharmaceutical products listed in the APPL (about 700 items determined by the MoH, which includes many items from the National Essential Medicines List) and the MoH National Tender (about 300 items). The MoH uses international best practices, for example, the WHO procurement process and workflows, for medicine procurement. Thus the process uses the indicative drug price based on market survey when calling for the open tender. This ensures that government central purchase obtains products that offer the best value. The MoH Procurement Board selects successful bidders after bids pass through the Technical and Financial Evaluation Committees. Only local purchase orders with a total value of less than RM 500,000 are exempted from open tender. Generally, generic medicines provide value while meeting budget constraints and public demand. Thus, in 2017, about 60% of drugs procured and dispensed were generics (30% local manufacture, 70% imported) (Pharmaceutical Services Programme, Ministry of Health Malaysia, 2018).
In its attempts to meet the increased demand for drug treatment, the government seems to have tried to keep the price it pays for drugs low to curb the escalation of its expenditure on drugs. However, the price the government pays for generic and originator drugs, although substantially lower than that charged in the private sector, has remained above the international reference median price (Table 11.1). Figure 11.5 shows that, from 2014 to 2017, despite no significant increase in its budget for medicine procurement, the MoH managed to provide an additional 8.2 million outpatient prescriptions. MoH management of budget disbursement in three-month staggered periods instead of annual disbursement to individual hospitals and clinics promotes prudent planning and more accurate forecast of local demand, thereby reducing the risk of drug shortage or wastage.
| Generics | Originators | |||
|---|---|---|---|---|
| Public sector | Private sector | Public sector | Private sector | |
| Median price compared to international reference price (MPR) | 1.2 | 2.5 | 1.6 | 8.6 |
| Generics | Originators | |||
| Hospitals | Pharmacies | Hospitals | Pharmacies | |
| Mark-up in the private sector | 51% | 22.4% | 167% | 94.7% |
As described, in the development since the 1990s, Pharmaniaga, although a private entity and concessionaire, continues to play an important role in logistics and storage service provision to MoH health facilities nationwide, even if the request is made by a health facility in a remote area. In addition, it handles the open tender processes on behalf of the MoH and the Ministry of Finance (MoF). As a local generic drugs manufacturer, Pharmaniaga may also bid for government procurement tenders. As Pharmaniaga is responsible for handling the bids, the issue of potential disadvantage to other competitors has been considered. The response to this was that bids by Pharmaniaga must be submitted at least two weeks before the close of tenders.
11.5.3.2 Private Sector
Much expenditure on medical products is in the private sector. For example, the private sector spent RM 3.55 billion or 77% of the total medical goods expenditure9 in 2016, and there is a wide range of prices for medical products. Higher procurement prices due to the lack of economies of scale and high mark-ups by service providers or retailers10 are the principal contributory factors (Table 11.1).
As about 30% of inpatients use private hospitals, they pay a substantial price for medicines. The mark-up in private hospital prices is not transparent for patients or their insurance companies, and this asymmetry of information is a contributor to market failure. For certain life-saving and critical-care prescription drugs that are under patent protection, the implications are significant. For example, gefitinib, a cancer drug, cost 190.8 days of minimum wage per treatment in 2017, while trastuzumab, a breast cancer drug, cost 551.7 days of minimum wage, that is, more than 1 year of minimum wage (Pharmaceutical Services Programme, Ministry of Health Malaysia, 2018).
The cost of patented drugs is a barrier to access, and their generic competitors allow more patients to afford the drugs, hence resulting in increased sales. The government policy of favouring the lowest-priced generic drug procurement and the timely entry of generic drugs into the market has had strong effects in terms of drug affordability for patients. An illustrative example in Malaysia is that the originator pharmaceutical company was willing to reduce the price of trastuzumab11 by about 52% to win an MoH tender to compete with a local drug company that had also bid to supply a biosimilar drug.
In view of the potentially significant positive impact of generics on public expenditure on medicine, the Malaysian intellectual property patent law (Patents Act 1983) could be reviewed to expedite generic entry, for example, by reviewing patent criteria and the mechanism for allowing pre-grant and post-grant opposition. Furthermore, the introduction of Bolar-type12 provisions in regulatory approval would protect local manufacturers from harassment through threats of legal action. Under the government drug procurement public tender process, local generic drug manufacturers have a slight preference of a 10–15% higher price margin advantage, given the experience that local producers can provide a more consistent and reliable drug supply.
Although Malaysia has price controls on a number of food items and petrol, it has thus far not imposed price controls on medicines. By and large, medicines are affordable, especially since the government provides high-quality, safe and effective medicines primarily through the MoH at almost no cost to the patient. The presence of a competitive local generic manufacturing industry certainly helps in ensuring that generic products remain affordable. However, the challenge is in ensuring that imported patented innovator products are also affordable. If costs become prohibitive for the government to purchase patented drugs for a large number of patients, it can use provisions under the agreement on Trade-Related Aspects of Intellectual Property Rights (TRIPS) to make such medicines available at a cheaper price for public non-commercial use.
In addition, Malaysia is one of the initial six co-sponsoring nations that proposed a resolution at the 72nd World Health Assembly that makes the pricing of medical products more transparent, and the resolution was adopted on 28 May 2019. The price information inputs are the cornerstone for the effectiveness of any future policies on drug price monitoring and control.
11.5.4 The Case of Right to Government Use
In early 2000, the costs of certain antiretroviral (ARV) drugs that were imported and under patent were so high that it limited the country’s ability to provide treatment to HIV-infected patients requiring it. In spite of negotiations, a suitable price could not be agreed upon. In 2003, the Malaysian government exerted rarely used powers to acquire the drugs through a tender to a local pharmaceutical company to import and supply selected generic versions of patented ARV drugs manufactured by the Indian company Cipla. This was possible by using a provision provided under the TRIPS agreement in line with the Doha Declaration 2001 by members of the World Trade Organization (WTO) and the provision of the Rights of Government under the Patents Act 1983 (World Trade Organization, 2001). The medication would be solely for the use of patients managed by MoH facilities. On completion of the ‘government use’ licensing period, the MoH was able to negotiate with the multinational companies for better prices and therefore no longer required the use of special provisions. A similar situation arose in 2017 for medication for hepatitis C; it is the subject of Case Study 12.1 in Chapter 12.
The government has indicated that it will not hesitate to use this mechanism in public health emergency situations where a large number of patients do not have access to affordable treatment. Malaysia is the first and one of only a few countries in the world to exercise this right to provide access to a patented product as part of its public health policy.
The cost of medication and other medical technologies is a limiting factor in the advancement of universal healthcare (UHC). Managing the tension between public goods and private incentives to develop and produce medical technologies is an ongoing challenge that transcends national boundaries, as seen here and in Case Study 12.1. There are significant provisions for low-income countries under international law, though obstacles to exercising these provisions exist and need to be addressed. An equitable framework for cost sharing between middle-income and high-income countries remains absent. The current approach of case-by-case resolution is opaque, drains resources and favours countries with political or economic leverage, thus creating inequitable outcomes.
11.5.5 Pharmaceutical Trade Sector in Malaysia
Pharmaceutical products are important trade items for Malaysia. In 2017, their trade amounted to RM 6.45 billion or 0.36% of total trade. However, the import of pharmaceutical products was about six times larger than the total export value (Figure 11.6). This created a trade deficit of RM 4.6 billion in 2017. In accordance with the government’s Economic Transformation Programme, a project was implemented in 2010 to provide incentives for the local production of generics for export. Subsequently, the sales of generic and patented medicines as a percentage of prescription drugs have seen a reversal, with generics overtaking patented drugs in 2013 (Malaysia Competition Commission, 2017). The local pharmaceutical manufacturing sector started to pick up and saw a 63.7% increase in the export value from 2013 to 2017 compared to a 31.3% increase in the value of imported medicines (Figure 11.6). The increased export value for formulated products (medical products) for human use (Table 11.2) contributed 81.0% of all pharmaceutical products export in 2017.
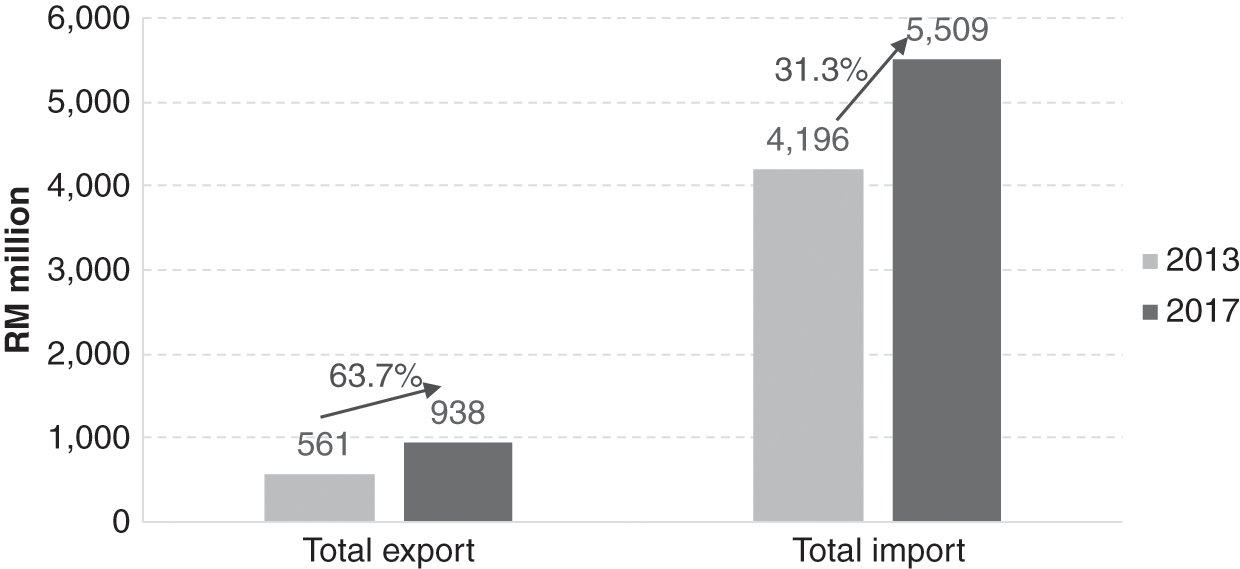
| No. | Product category | 2013 | 2017 | ||||||
|---|---|---|---|---|---|---|---|---|---|
| Export | Import | Export | Import | ||||||
| Value (RM million) | % | Value (RM million) | % | Value (RM million) | % | Value (RM million) | % | ||
| 1 | A1: Formulated products for human use | 453.1 | 80.8 | 3,548.9 | 84.6 | 760.5 | 81.0 | 4,551.1 | 82.6 |
| 2 | A2: Formulated products for veterinary use | 6.1 | 1.1 | 80.0 | 1.9 | 25.2 | 2.7 | 66.1 | 1.2 |
| 3 | A3: Vaccine products for human and veterinary use | 6.1 | 1.1 | 231.8 | 5.5 | 11.6 | 1.2 | 415.3 | 7.5 |
| 4 | B1: Vitamins | 34.0 | 6.1 | 162.7 | 3.9 | 86.3 | 9.2 | 262.7 | 4.8 |
| 5 | B2: Antibiotics | 61.8 | 11.0 | 173.0 | 4.1 | 54.9 | 5.8 | 214.1 | 3.9 |
| Total | 561.0 | 100.0 | 4,196.4 | 100.0 | 938.5 | 100.0 | 5,509.2 | 100.0 | |
11.6 Key Messages from Malaysia’s Experience
11.6.1 What Went Well?
The medical products subsystem at various times in development:
◦ Responded to demands from rapidly expanding health services and more variety and higher costs of internationally available medical products.
◦ Dealt with hazards and stresses such as trade in illicit and dangerous drugs, dumping of poor-quality and unsafe medicines, misuse and abuse of allopathic and traditional medical products, internationally rising costs of pharmaceuticals, and patent protection.
◦ Served its purpose despite facing constraints, including human resources and budgetary limitations.
The health system successfully improved access, safety and quality of imported and local products, quality of local production, and cost control through incremental steps in strengthening:
◦ logistics and production capacity,
◦ legislation, monitoring and enforcement,
◦ education and negotiation.
11.6.2 What Did Not Go So Well?
The inability to moderate the high and increasing cost of medical products in the private sector.
11.6.3 Trends and Challenges
Challenges in traditional medicines and health supplements:
◦ Adulteration
◦ Inappropriate marketing and use
◦ Sale as health foods to bypass regulation of medical products
Pressure from the pharmaceutical industry for patent protection.
Implementation of price control tools.
National formulary for all public sector health facilities to enable them to have economies of scale in purchasing and to have uniform policies such as antibiotic policies.
12.1 Introduction
This chapter explores the influence of leadership and governance on the development of the health system in Malaysia during the 60 years since independence. Governance refers to ‘a wide range of steering and rule-making related functions carried out by governments/decisions makers as they seek to achieve national health policy objectives’ (World Health Organization, 2019). It includes the policies and systems structures that facilitate the regular operation of a health system. Leadership has been defined as ‘the art of motivating a group of people to act towards achieving a common goal’ and includes elements of inspiring and directing (Reference WardWard, 2019). This concept has been extended to apply to institutions as leaders (Reference Washington, Boal, Davis, Greenwood, Oliver, Suddaby and SahlinWashington et al., 2008). Leadership occurs at many levels of the system, and its characteristics, development and impact on the health system have been analysed variously (Reference HartleyHartley, 2008; Reference West, Armit, Loewenthal, Eckert, West and LeeWest et al., 2015).
Leadership and governance are strategic elements in a health system (Reference West, Armit, Loewenthal, Eckert, West and LeeWest et al., 2015). Their performance has an impact on:
the direction and priorities of the system,
the development and bonding of the various inputs into a coherent set of activities and services, and
collaboration with relevant public entities and the formation of coalitions with other organisations and civil society in the pursuit of public interest and social welfare.
Leadership and governance are key to planning and implementing activities, evaluating outcomes, and the shifts and corrections needed. By their very nature, they operate in a political and socio-economic context, and outcomes depend on political and social acceptance of objectives and their operational forms. This, in turn, enhances the mobilisation of resources and their application to achieve set goals. They are of greater importance in multi-ethnic societies, such as Malaysia, to minimise tensions arising from differences in perspectives and actual conditions, as well as to create a political framework that can manage the development process in spite of constraints. The development process could either address one set of constraints at a time or follow a more holistic path by addressing a number of related ones simultaneously and benefiting from the synergy of complementary thrusts that enhance outcomes across the system (Reference Pourbohloul and KienyPourbohloul & Kieny, 2011).
12.2 The Ministry of Health: Context and Structure
12.2.1 National Governance Context
The Malaysian Constitution provides a federal type of government, with division of powers between the federal and state governments. At the federal level, the legislature consists of a lower House of Representatives, elected through nationwide elections, and a partially appointed Senate. Each state has its own State Assembly elected by statewide elections. The parliamentary type of government has an executive (Cabinet), headed by a prime minister who is a member of the lower house and a number of ministers. The hereditary Malay heads (Sultans) of some states elect from among themselves a monarch (Supreme Ruler) who serves for a fixed term. The monarch has limited powers and follows the advice of the prime minister of the day. The rulers, on the advice of their governments, appoint the members of the independent judiciary, both at federal and state level. While some powers are exclusive to either the federal or the state governments, there are some overlapping areas where powers are conjoint. The federal government has powers concerned with health and the provision of health services and others relevant to health such as the environment, labour and education (Commissioner of Law Revision, 2014), whereas states have powers over land.
Malaysia adopts a holistic approach wherein health policies are formulated and developed within the context of wider major national development policies set by the Prime Minister’s Department (PMD) and Cabinet and articulated in various Malaysia Plans. Health professionals in the Ministry of Health (MoH) have the primary responsibility of advising the government on health priorities and formulating health programmes and interventions according to these priorities. Achieving balanced development with greater equity and poverty alleviation has been a national aim, with the reduction of differences between groups of people and regional areas a key priority. Another aspect of priority-setting has been the need to balance health service development with human resources availability and fiscal constraints (Economic Planning Unit, 1991; 2015; Chapters 3–9). National priorities and health needs have evolved as economic and social development took hold with growing urbanisation (Chapter 3). For example, the Eleventh Malaysia Plan (2016–2020) moved priorities from eradicating poverty to improving the living conditions of the 40% of all households that have the lowest income (Economic Planning Unit, 2015). The MoH policies responded accordingly.
12.2.2 MoH Organisational Structure
At federal level, the MoH, headed by a Cabinet-level minister, has two arms. The administrative arm, headed by the Secretary General and staffed by civil servants from the country’s general public civil service, is responsible for public service personnel administration, finance and procurement. The health professional arm, headed by the Director General (DG) and staffed by healthcare professionals, focuses on planning, implementing and evaluating service delivery and the wider concerns that affect the health of the community. It appears that areas under the DG’s responsibility tend to be concerned with the whole system beyond the health services provided by the MoH, while those under the more direct administration of the Secretary General tend to relate to the provision of services by the MoH and public service administration.
The organisational structure of the MoH follows the conventional separation of public health and community-based services from medical and hospital services, with separate areas of responsibility for research and technical support, including planning, engineering services, the National Institutes of Health, dental care, and pharmaceutical goods and supplies. Each state has a state-level health department responsible for administration and delivering services, and its organisation reflects the conventional separation of public health and community-based services from medical and hospital services (Ministry of Health Malaysia, 1975; 2018). There are smaller administrative entities at district and hospital levels. As described in Chapters 4, 5, 6 and 8, the evolution over the past 60-year period has seen growing professional and managerial competence, beginning at the federal level and gradually trickling down to the district and hospital levels.
12.3 The MoH as an Intersectoral Leader
The MoH is expected to exercise institutional leadership and governance for health. It sets the health agenda and ensures its place in the broader national agenda, sets policies that shape how public and private health sectors operate and interact, creates regulations for health and safety and collaborates internationally for health.
12.3.1 Inter-ministerial Leadership
The MoH is the major source of technical expertise for health. It formulates and administrates health-related legislation and regulations, provides training for nursing and other allied health professional personnel and is the major provider of health services in Malaysia. However, health is dependent not merely on health services but also on what people do and their work and living conditions. Consequently, the MoH often lacks both the direct authority and supervision of substantial areas of relevance to health risks management and their impact on health that fall under the responsibility of other ministries or agencies such as environment, transport or food services. This diversity of authority and responsibilities requires the MoH to provide, at times, leadership and technical support in collaborative approaches with other federal and state agencies and civil society in the pursuit of policies and practices that enhance the health status of Malaysians.
Historically, several other ministries have played influential roles in health development. The PMD plays a major role in developing national policy that guides health policies and translating it into five-year plans with mid-term reviews and longer-term outline perspective plans. This process enables performance evaluation and corrections. The Ministry of Finance addresses fiscal needs from development and operational demands. As MoH revenue amounts to only a small fraction (3% in 2016) of its operational expenditure, it is dependent on the fiscal resources of the federal government through the Ministry of Finance (Ministry of Health Malaysia, 2018; Chapter 9). The role of the Ministry of Education (MoE) has expanded from training medical students to include the training other health professionals. The MoE also administrates a number of university teaching hospitals and has partnered with the MoH in providing health-enhancing services and promoting healthy practices in school-age children. Finally, co-ordination across different levels of government has also been important, with federal, state and local governments sharing responsibilities in areas such as the promotion and maintenance of healthy conditions at a local level, such as the preparation and sale of food in urban areas.
New and emerging challenges to public health have triggered changes in the roles and inter-relationships between ministries. For example, as health concerns related to environmental, occupational or lifestyle issues rise in importance, the corresponding ministries have an increasing responsibility for health. However, there are examples where professional specialisation in the relevant ministries has created gaps in their ability to respond. The MoH has stepped in to address these gaps or ensure proper ownership by other ministries. For example, the professional strength of the agencies concerned with the environment (e.g. the Department of Chemistry) led to a focus on chemistry rather than on bacteriology. In the case of labour, safety concerns focused on risks from mechanical devices and not on exposure to and contamination by biological agents. The MoH supported the relevant ministries in developing the needed expertise.
Although the MoH is the acknowledged leader for issues related to health, in practice, leadership has taken on different forms and has been manifested by different institutions. For example, Chapter 7 provides an example where the MoH provided leadership by facilitating other agencies that had the primary responsibility of providing safe water and sanitation to develop the professional competence required to perform their function adequately. Similar examples are evident in the management of other environmental and occupational health risks (Chapters 4, 6 and 7). As other ministries and agencies acquired greater capacity to address the changing environmental, labour and social scene, the role of the MoH evolved and became a supportive one.
Sometimes leadership is a shared role. For example, universities under the MoE are responsible for the academic training of medical practitioners. However, the MoH, as the leading provider of healthcare, takes the lead in defining the competencies required in the medical workforce, while the universities take the lead in designing and implementing the curriculum. However, the MoH provides much of the practical training and internship of doctors in its public hospitals and is therefore the final authority to decide whether the new doctor is competent to practice without supervision (Chapter 8). Civil society has also demonstrated leadership in health. Chapter 6 provides examples of situations where non-governmental organisations (NGOs) provided leadership for successful advocacy for national policies and programmes to tackle tuberculosis and HIV/AIDS.
12.3.2 Leading and Governing Service Delivery in the Public and Private Sectors
The private sector has a significant role in the delivery of healthcare in Malaysia. An important governance question is whether the provision of health services is a public or a private matter and the role of government in its provision and financing. The nature of health services does not make market mechanisms effective to ensure efficiency and social, or even private, satisfaction in meeting health needs. Much of healthcare has the characteristics of what have been termed public goods,1 which makes market competition an inadequate means of achieving efficiency or ensuring equity in their distribution in view of income inequalities and poverty. Further, health services, like education, have attributes that can give them social merit that society needs to determine independently of preferences determined by price and consequently the living standards of more than one generation. Further, the health service ‘market’ is characterised by commonly designated ‘market failures’ that preclude assumptions regarding the maximising of consumer utility (or welfare) and efficiency in the allocation of resources and their use. Among other attributes, the health ‘market’ is characterised by few providers, especially in the case of hospitals, with restrictions to entry due to licensing and other constraints; prices that are sometimes determined by providers or insurers; asymmetry of information between consumers and providers, as the consumer is dependent on the supplier to determine services received; and, as previously mentioned, considerable externalities, especially in the case of infectious diseases. These characteristics of the health services ‘market’, especially in the case of services provided by the private sector, do not allow the efficient performance of social objectives of consumer sovereignty and efficiency (Reference Martins, Courtney and BriggsMartins, 2004).
Thus governance of the health system in Malaysia has to address the balance between public and private provision of services, their relative costs and equity in their distribution. First, the relative scarcity of medical personnel and their concentration in urban centres led to the provision of public sector primary healthcare in rural areas, where most people lived, by allied health personnel. This was a low-cost but effective delivery of basic healthcare. Complemented by environmental services, it contributed to improved equity in access to health services (Chapters 3, 4 and 8).
As medical personnel became more abundant and people more urbanised, with easier geographical access to both public and private health services, the provision of lower-cost public services still played the important function of benchmarking the price of private services, keeping private fees in check. However, to retain medical personnel, the governance of public services had to keep the remuneration of medical personnel in the public sector at an acceptable level (Chapters 8 and 9). These balancing efforts have kept total health expenditure in Malaysia at the middle level of 4.0% of the gross domestic product (GDP) in 2014, compared with its neighbouring countries – 6.5% in Thailand, 4.9% in Singapore and 2.8% in Indonesia (Ministry of Health Malaysia, 2017) – and added about 15 years to the life expectancy of Malaysians (Chapters 3 and 9).
The governance of health services raises some potential conflicts of interest for the MoH. An obvious one is that the MoH is both a regulator and a provider of services. This governance issue is only partly addressed by the establishment of state administrations of public sector health services that are accountable and subjected to oversight by the central administration of the MoH. However, the MoH is, in turn, subjected to oversight by agencies in the PMD and the Ministry of Finance.
In addition, a number of governance issues arise from the government-stated interest in the promotion of the private sector in general and private health services in particular. The government has nominated health as one of the National Key Economic Areas. Although a number of economic activities are included, such as the production of pharmaceutical and medical devices, with some emphasis on their economic and export value, an area more directly related to health services is medical tourism (Prime Minister’s Department, 2017). The Malaysian government has promoted medical tourism since the late 1990s (Reference Ormond, Wong and ChanOrmond et al., 2014; Reference Chandran, Mohamed, Zainuddin, Puteh and AzmiChandran et al., 2017). It is fostered by the Malaysia Healthcare Travel Council (MHTC), an initiative of the Ministry of Finance. The council’s membership also includes the ministries of relevance to tourism, the MoH, and other agencies such as the Association of Private Hospitals of Malaysia (Malaysia Healthcare Travel Council, 2020). There is no obvious evidence of the direct relevance of medical tourism to the health of Malaysians, as its objective is an economic one. This is reflected in the absence of any apparent reference to medical tourism in the annual reports of the MoH (e.g. Ministry of Health Malaysia, 2018). There is not much specific information on the value of medical tourism and its contribution to economic activity. An estimate by the MHTC for 2017 of the value of medical tourism was that it represented the equivalent of about 0.1% of the value of Malaysia’s exports in that year (Malaysia Healthcare Travel Council, 2017; Malaysia External Trade Development Corporation, 2018).
However, this economic interest has led to pressure on the MoH to reduce the regulatory burden on private health services in its administration of the Private Healthcare Facilities and Services Act. In this context, a study mandated under the Tenth Malaysia Plan to modernise business regulations conducted a regulatory review with the aim of reducing unnecessary regulatory burdens on private hospitals (Malaysia Productivity Corporation, 2014a). The review focused on the private hospital sector, as this is deemed a high-value-added, high-knowledge-based and growing sector. It found that regulations covering private hospitals were excessively prescriptive and made several recommendations for reducing the regulatory burden. It is noteworthy that the annual report of the same agency – related to the Ministry of International Trade and Industry – for 2013–2014 mentions rising costs and innovation as the major issues to be addressed by private hospitals and makes no mention of the burden of regulations (Malaysia Productivity Corporation, 2014b).
The regulation of medical personnel has been an important point of consistency across the public and private health sectors. Health services are dependent on the competence of medical, nursing and other professional personnel. Malaysia uses the mechanism of licensing via statutory bodies to manage these standards of practice, and this process has evolved and became more comprehensive over time (Chapter 8). For example, the Nurses Act 1950 provided for a Nursing Board to supervise the training and registration of nurses and oversight of their practice (Reference Chong, Sellick, Francis and AbdullahChong et al., 2011). The Medical Act 1973 gave the Malaysian Medical Council the authority to evaluate the qualifications of medical practitioners and their registration (Malaysian Medical Council, 2018). This was important because of the past shortages and recruitment from countries with varied training and degrees of competence. The licensing and/or registration of other health professions has continued over the years to ensure appropriate and safe professional practice (e.g. Allied Health Professions Act 2016) (Reference LimLim, 2016).
12.3.3 Regulations for Health and Safety
In the health sector, Malaysia uses regulation and licensing for two major purposes. The first is to manage threats to community health arising from the spread of disease or deleterious elements in the environment in which people live. The second is to protect the community from fraudulent or potentially harmful practices by healthcare providers or through the sale of medical and food products. The regulations give legal authority to various agencies for their enforcement, with sanctions for their infringement.
Initial regulatory activity by the MoH addressed infectious disease (Chapter 6), medical personnel (Section 12.3.2) and medical products (Chapter 12). In later years, however, as urbanisation and industrialisation increased the health risks of water supply contamination, changes to the Constitution allowed the federal government and the MoH to play a greater role in water supplies and sewerage and their regulation (Water Services Industry Act 2006) (Reference WahabWahab, 2011; Reference Pidgeon, Pidgeon, McDonald, Hoedeman and KishimotoPidgeon, 2012). The MoH plays an active role in the National Drinking Water Quality Surveillance Programme (Ministry of Health Malaysia, 1998). The growth in the commercialisation of food supplies, including international trade, has added to health risks in food supply and consumption, leading to the strengthening of the Food Act 1983 and its regulations.
Most Malaysians are of working age and are employed in a wide range of activities with varied degrees of health risk and disability risk. Consequently, occupational safety is a major factor in the maintenance of health. The Occupational Safety and Health Act 1994 aims at maintaining safe working conditions and applies sanctions for adverse practices. Although the administration of related regulations and surveillance lies with the Ministry of Labour, the MoH remains concerned about the surveillance of occupational diseases in order to identify the causes and sources that can direct remedial action, in addition to the promotion of the health of the large labour force in health services (Ministry of Health Malaysia, 2018).
Malaysia has used health legislation and regulation sparingly, perhaps in part due to limitations in institutional bandwidth and capacity. The lead time for enacting and enforcing new legislation is lengthy, taking five or more years for food legislation, for example. This indicates the complexity of the processes, which include stakeholder engagement, legal expertise and availability to draft the legislation, and developing the enforcement capacity and mechanisms for implementation. Such capacity might require financial resources, digital monitoring, laboratory services, the establishment of procedures and guidelines, and the training of enforcement and prosecution staff. In addition, the nature of the imperatives for legislation influenced political will and support, which in turn influenced the priority of enacting and implementing legislation effectively and the system capacity to do so.
Table 12.1 illustrates this through contrasting examples of the development of legislation to safeguard against hazards in food, where strong foreign trade imperatives proved much stronger than domestic imperatives that involved balancing health concerns against the growth of local food services.
| Characteristics of the imperatives for legislation | Lead time for formulation of legislation and preparatory activities | |
|---|---|---|
Example No. 1: Legislation to safeguard the public against health hazards and fraud and to ensure hygiene and sanitary practices in the preparation and sale of food
|
|
|
Example No. 2:Legislation to ensure that the quality of fish and fishery products exported to the European Union (EU) meet EU requirements and certifications
|
| Lead time: 2 years
|
While it is important to allow sufficient time to garner stakeholder support and build system capacity, long lead times in developing legislation and regulation can be detrimental. A problem may develop in the intervening period, resulting in the need for repeated re-drafting of legislation. It weakens governance capacity and engenders frustration among groups experiencing negative impact and among enforcement authorities. An example from Case Study 5.1 in Chapter 5 is the long delay in enacting legislation to govern the behaviour of third-party agencies that serve as intermediaries between employers and healthcare providers for their employees.
12.3.4 International Collaboration
As with most developing countries, the development of Malaysia’s health system has had some external support, specifically from the multilaterals. The World Health Organization (WHO) has been a source of technical advice on the management and prevention of both communicable and non-communicable diseases as well as health personnel training and the organisation of community- and hospital-based services. Malaysia has also collaborated with international financial institutions such as the Asian Development Bank and the World Bank. International support for the Malaysian health system has been predominantly technical in nature, with limited financial support, to cover some infrastructure development rather than for the delivery of programmes. As discussed in Chapter 6, the limited reliance on international financial support contributed to the ability of the MoH to design programmes based on national priorities and directions, integrating new initiatives into existing ones rather than developing parallel initiatives according to external priorities.
The activities of the Institute for Medical Research (Chapter 6) include early examples of Malaysia’s international collaboration on research into tropical disease control and professional training for countries in the region (Ministry of Health Malaysia, 1980). A more recent example is the establishment of the ASEAN Risk Assessment Centre for Food Safety (ARAC) to foster collaboration among Association of Southeast Asian Nations (ASEAN) members to improve food safety (Ministry of Health Malaysia, 2018).
The wide range of Malaysia’s engagement in international collaboration comprises the continuing contributions of the WHO Collaborating Regional Centre for Research and Training in Tropical Diseases and Nutrition, and the Collaborating Centre for Ecology, Taxonomy and Control of Vectors of Malaria, Filariasis and Dengue, as well as collaboration in health systems research, among others (World Health Organization, 2002; Reference Barraclough and PhuaBarraclough & Phua, 2007; Ministry of Health Malaysia, 2018). Other areas of international collaboration involve co-operation with and support of ASEAN countries on a range of health concerns (Reference Barraclough and PhuaBarraclough & Phua, 2007). In addition to food safety, these activities include the control of infectious diseases and oral health, as well as other ASEAN clusters of co-operation on issues such as healthcare coverage and access, human resources and health technology assessment (Ministry of Health Malaysia, 2018).
12.4 Leadership in the Public Health Sector
In addition to exercising intersectoral leadership, the MoH has also needed to provide leadership and governance in the public health system. This includes establishing visions and programmes, evaluating performance, ensuring accountability, addressing systemic issues and developing leadership.
12.4.1 Vision and Programme Setting
The national priorities set by the PMD and the Cabinet and articulated in various Malaysia Plans guide health priorities. For example, a major national aim was to achieve balanced development with greater equity, particularly between urban and rural areas, and poverty alleviation (Chapter 3). Top leadership in the MoH contributed to the ability of the health sector to translate national goals into a health sector vision and inculcate basic values that characterised the delivery of health services in both the public and private sectors. An example of the contribution of personal leadership is, for example, the leadership of the Health DG in the 1970s, who translated the Alma Ata vision for primary healthcare into the Malaysian context, as described in Chapter 4. In later eras, successive DGs translated the national emphasis on improving quality of service into a systematic nationwide programme and culture in the public sector health services, as illustrated in Chapter 5. Leaders demonstrated their commitment to collaborating with peers across organisational boundaries and recognising leadership qualities in their subordinate staff and supporting them. Box 12.1 illustrates how persons occupying top positions in the MoH at various times viewed their own contributions to leadership.
Leadership also emerged at various levels of the MoH organisation in response to specific challenges, as illustrated in the example of the introduction of the human papillomavirus (HPV) vaccination programme (Table 12.2). Leadership has also emerged from the private sector health service. For example, it was a general practitioner (GP) from the private sector who spearheaded the development of family medicine as a speciality (Reference RajakumarRajakumar, 1984).
| Context | Organisational leadership by MoH | Personal leadership examples |
|---|---|---|
| Rapid increase in HPV vaccination in adolescent girls, 2011–2016 |
|
|
Most health system programming has been concerned with the organisation of services in the public sector in accordance with national priorities, as detailed in the previous chapters. The health requirements programming in Malaysia follows a top-down and bottom-up approach with a reiterative consultative process that involves a wide variety of officers at national, state, district and hospital levels. MoH programme directors in the various divisions and institutions raise and discuss issues, while similar processes occur at state level. This process involves reviewing and assessing health conditions and trends in Malaysia and identifying the driving factors in order to formulate responses. Current programmes are evaluated, with changes planned to meet evolving circumstances (e.g. Ministry of Health Malaysia, 2012; 2018). Proposed programmes and projects are also evaluated, and those involving large expenditures undergo further assessment for compatibility with development budget estimates. They are submitted for review and approval to the Economic Planning Unit in the PMD for financing and implementation during the period of the proposed Malaysia Plan (Reference Suleiman and JegathesanSuleiman & Jegathesan, 2000; Ministry of Health Malaysia, 2018).
Issues and priorities identified at the national level are cascaded down to state and district level, which in turn identify local issues and merge them into the national framework and cascade them up to national level for review by a committee of senior managers, with the Division of Planning as the secretariat. This has the advantage of considering perceived major national issues in conjunction with the benefit of emerging local conditions and constraints. In addition, it is a mechanism for developing leadership and governance skills at various levels of the MoH system. However, this process may lead to delays between the identification of health risks and the implementation of responses, such as in the case of dengue and diabetes control (Institute for Public Health, 2015).
‘Many factors that influence health are outside the purview of the MoH. Leaders in the Ministry of Health must be able to interact with leaders in other sectors to advocate on health issues.’
‘They have to be informative, persuasive and proactive. Leaders should monitor performance of the organisation and insist on evaluating interventions.’
‘We have excellent leaders at various levels. For example, I remember a director in Hospital Kota Tinggi who was a quiet, humble person but inspired great teamwork. I respect him.’
‘Resisting political pressure is an essential characteristic of leaders. For example, one MB overruled construction of a septic tank by refusing to approve land. Another diverted funds to his own interest group for building a private hospital.’
‘The Minister of Health should advocate rather than be an administrator. I am very proud of my success in advocating and convincing the PM against approving “kiddie packs” of cigarettes.’
‘Politicians know that providing healthcare is an easy credit point with their electorate. Hence they will always push for items for which they can claim credit.’
‘A leader needs to be knowledgeable. I am a lawyer who had to make myself knowledgeable about health issues.’
‘I was fortunate to have a highly competent DG in Tan Sri Abu Bakar. We had an excellent partnership.’
‘My proudest achievement is that I managed to influence the culture in the MoH. During my tenure, we began the tradition of inviting stakeholder views and having regular consultations. This increased the prestige of the MoH. My ministry was recognised as the leader on health topics.’
‘Leadership should be both a top-down and a bottom-up process: leaders need to listen, anticipate and innovate.’
‘Leaders in the MoH need to manage the perceptions of the public.’
‘We need to embrace technology and use it innovatively to improve healthcare.’
‘Communication strategy is important. For example, we now focus on the non-smoker rather than the smoker!’
12.4.2 Data and Evaluation
Governance is first and foremost about achieving results. Monitoring is crucial for identifying constraints encountered in the short term and the attainment of outcomes in the longer term. Reliable and relevant health information is essential in the performance of this governance function (Chapter 10), and relevant follow-up action is a critical partner to monitoring and evaluation. Monitoring and evaluation could be considered necessary but are not sufficient conditions of progress. For example, there has been a lag between monitoring and action in the incidence of dengue. Infectious diseases monitoring has shown a substantial rise in the incidence of dengue since 2000. Although case fatality rates declined due to medical treatment, preventive action lagged and incidence rates were 10 times higher in 2016 than in 2000 (Ministry of Health Malaysia, 2018). Malaysia’s systematic planning and evaluation of health development uses information from regular population censuses and comprehensive registration of vital statistics that identifies the population groups most at risk and what degree of progress, or otherwise, has been made over time. Another strength has been the wider people-centred development approach that focused on poverty and human capital, including health, with the collection of data on living conditions (e.g. Department of Statistics, 1959) that identified the population groups most at risk. These were complemented by the registration of health professionals, inventories of health facilities and health service activity information, especially in the public sector, which provided most services. However, it was their analysis in relation to the population that provided the basis for evaluating the results and relative progress. The National Institutes of Health provide research and programme evaluation studies that contribute to the information database. Requests for many of the National Institutes of Health studies come from the MoH, and therefore have a direct link to decision-making.
The evaluation of data and the use of the findings for management purposes demonstrated the importance of health information and research, creating a feedback loop that has led to further investments and improvements in data quality and relevance. In early times, data collection and processing was often carried out by manual methods, before the wider use of computers and what became known as IT (information technology). The substantial investment in the use of IT in managing health services has improved the storage of, access to and analysis of a wide range of health information for monitoring and evaluating progress (Ministry of Health Malaysia, 2005; 2018; Chapter 10). However, it is important to note that improved data collection alone does not guarantee health improvements. The substantial IT thrust has coincided with an increase in the incidence of some non-communicable diseases (e.g. diabetes) during the 2000s and 2010s, stagnation of infant and maternal mortality rates and slower improvements in life expectancy (Chapter 3). Effective ways of understanding and using data to meet these new health challenges need to be developed.
The governance of the health system entails assessment of the current and emerging technologies and practices to evaluate effectiveness, relevance to local conditions and efficient provision. In earlier years, Malaysia depended largely on expertise from international agencies such as the WHO to inform the selection and use of technologies. Examples are the very early adoption of a list of essential drugs and the selection of vaccines to be included in universal childhood immunisation programmes. However, as the complexity of health technology increased and new hospitals were built based on external expertise, technology assessment and use in the Malaysian context became more imperative (Reference SivalalSivalal, 2009; Reference Roza, Junainah, Izzuna and NurhamiRoza et al., 2019). The MoH established a section for assessing new technologies and reviewing current ones (Malaysian Health Technology Assessment Section, or MaHTAS), and its process relies on systematic reviews of intelligence gathered from other reliable sources and its own evaluation (Ministry of Health Malaysia, 2018). The outputs inform the development of clinical practice guidelines and the purchase of costly technology or medical products by the MoH (Chapter 5). Other examples of the evaluation and use of findings include the assessment of the cost-effectiveness of some of its services, such as neonatal intensive care and diagnostic imaging services, and the effectiveness and improvement of clinical services such as renal dialysis and cataract surgery (Ministry of Health Malaysia, 2002; 2005; Chapter 5). Another example is the evaluation of services that have been outsourced, such as hospital laundry and cleaning services, where the performance of contractual services is a regular feature and has shown increased levels of contractual compliance (Chapter 7).
12.4.3 Accountability
Accountability is an essential feature of governance, although the concept is difficult to define. Accountability involves reporting the actions taken to another who is in a position to assess their appropriateness (Reference MulganMulgan, 2000). Accountability processes are learning opportunities for corrective action or appropriate shifts. In the Malaysian health system, accountability takes place at different levels and several forms. For example, compliance with rules and regulations, or spending within set budgets, is a form of accountability. Another example is the accountability of professional and other standards of healthcare practice exercised by professionals to their respective statutory registration boards, as described previously. On a different level, accountability is concerned with enhancing the performance and responsiveness of a health service to health conditions and the expectations of the public. This happens on a personal level, through complaints either via official pipelines or the mass media. Alternatively, accountability to the public can occur through political channels.
Several institutional mechanisms support accountability in the health sector. Performance reviews of the various programmes and services take place within the MoH system in a quasi-hierarchical manner, from single service units to state and national level. Accountability of performance and responsiveness to health needs also takes place during the preparation for each five-year Malaysia Plan and their mid-term reviews (Ministry of Health Malaysia, 2012; 2018), reviewed by the PMD and Cabinet. In turn, the Cabinet is accountable to parliament and it to the electorate. At micro and intermediate level, accountability to the public occurs through the mass media, whereby the MoH monitors and reviews every complaint appearing in news media. MoH procedures require a response to the complaint or appropriate remedial action.
Non-regulatory mechanisms can also promote accountability, as seen in the surveillance of practice and follow-up remedial action, particularly in the public sector (Chapters 4, 5 and 7). Examples include the Quality Assurance Programme (QAP) established in the MoH in 1985 that provided leadership to foster service quality (Ministry of Health Malaysia, 1998; 2018); the adoption of the International Organisation of Standardisation (ISO) (9001 version) Quality Management System (QMP) in accordance with government policy (Reference Hashim and IbrahimHashim & Ibrahim, 2016; Ministry of Health Malaysia, 2018); and the establishment of the Malaysian Society for Quality in Health (MSQH), which provides voluntary accreditation for public and private hospitals using national standards to assess the level of performance through external review and encourages continuous improvement of practice (Malaysian Society for Quality in Health, 2019). Most MoH hospitals have been accredited (Ministry of Health Malaysia, 2018), as have many in the private sector (Reference Aziz and AzizanAziz & Azizan, 2013). The evolution from regulatory to non-regulatory mechanisms reflects the tacit acknowledgement that regulation is suited only to weed out extreme cases of poor quality (the ‘bad apples’). Continuing improvement of the systems-wide quality of healthcare requires systems-wide incentives, including monitoring and feedback, professional and managerial human resources competencies and the development of an organisational culture that values quality.
A systemic challenge to accountability in the public health system is that the MoH is simultaneously the regulator and the provider of public health services in Malaysia. One illustrative example of potential conflict is that all the regulatory boards that govern health professionals have the DG of the MoH as chairperson and the respective programme director as secretary. However, the DG and the respective directors are also the heads of the respective services provided by the MoH, thereby posing a challenge to preserving the principles of accountability.
12.4.4 Structural Challenges and Governance Responses
The divisions of expertise and responsibility necessary for a functional health system also tend to foster the development of silos. The MoH employs task forces and committees that cut across divisions to mitigate this problem. The task forces deal with issues that require time-limited activities, while the joint or national committees deal with issues that require continuing collaboration. Changing demands on the health system have dictated different responses. For example, when maternal and child health were the focus, obstetricians and paediatricians from hospitals joined public health professionals in committees for the investigation of maternal deaths. As the focus moved to non-communicable diseases and emerging infectious diseases, a plethora of other committees and task forces combined the talents of clinicians, epidemiologists, laboratory specialties and healthcare managers to develop national strategies or action plans, as illustrated in Chapters 5 and 6.
Anecdotal evidence suggests that task forces that had to produce tangible products within short timeframes were very successful, as evidenced in the examples in the chapter on disease control (Chapter 6). Committees that had continuing responsibilities over time, such as the MoH/MoE joint committee for school health, tended to become lethargic or dormant until energised periodically by having to respond to new leadership or focus on a new challenge, as seen in the example of introducing the HPV vaccine for schoolgirls. Nonetheless, these committees appear to foster institutional memory that can facilitate rapid and effective collaboration across divisions (Reference Buang, Ja’afar, Pathmanathan and SaintBuang et al., 2018).
Another challenge is that human resources in the MoH are part of the larger civil service of Malaysia and are governed by the large and rather unwieldy bureaucracy. As such, the MoH has limited flexibility in adjusting employment conditions to the needs of healthcare services. For example, posts and promotion criteria adhere to general civil service rules (Institute of Health Management, 2006). Another example is the prolonged negotiations required to provide special incentives for selected categories to address brain drain to the private sector. This was partly due to concerns that other categories of professionals in the same grade would demand similar incentives, although there was no reason to provide them.
The observations of short-term task forces and long-term committees formed to foster cross-division co-operation within the MoH demonstrate the difficulty of sustaining lateral engagement. In the absence of tangible and high-priority goals, the regular system structure and work priorities dominate. It also shows the importance of informal systems (e.g. institutional memory and personal relationships) that are not reflected in an organisational chart. Health systems need both formal and informal linkages to facilitate communication and counteract the tendency toward silos.
12.4.5 Leadership Development
Although there is no empirical evidence, it is possible to postulate that several factors have contributed to the development of leadership at various levels in the health system. First, the civil service system of career progression requires, as a precondition to promotion, participation in management training programmes that raise awareness of leadership and its functions and the opportunity to bond with fellow officers from other ministries, thereby facilitating future networking. Second, career progression provides officers with the opportunity to occupy leadership positions at successively higher levels in the system (namely district, state and then national levels), thereby providing invaluable experience in communicating and collaborating with other agencies at progressively more complex levels. Third, within the MoH itself, the system requires clinical specialists, who previously focused only on their own patients, to take leadership for their clinical speciality across the state or the whole country. Participating in cross-disciplinary task forces, they acquire leadership competencies. However, to some extent, clinicians are disadvantaged compared to their colleagues in public health, as the latter acquire managerial experience throughout their career, starting from managing district-level entities and progressing to larger entities. In contrast, clinicians acquire exposure to managerial functions relatively later in their career. Fourth, the devolution of decision-making functions in programme formulation, as described above, provides the opportunity for nurturing leadership within the system.
It is often easier to describe the role that leadership plays in a health system than it is to identify how a health system produces good leadership. Indeed, the process of grooming and selecting leaders in a health system, especially top leadership, is often not open to documentation and outside scrutiny.
While leadership is indeed critical to the development of a health system, it too is shaped and constrained by health system structures and policies. Health system culture, needs and rules will strongly influence where in the health system leadership can be exercised and what form that leadership takes (e.g. technical, transformational, etc.). In particular, the appropriate devolution of decision-making is important for enabling leadership at all levels and the continuous development of new leaders.
12.5 Conclusions
Health development in Malaysia offers helpful examples of successes and challenges in governance and leadership.
Some of the lessons from successful practice are:
The formulation and pursuit of national development policies that prioritised social and human advancement and set health development in that wider synergistic context.
Sage leadership that stimulated the involvement of local leaders, and associated community participation, in socio-economic development, including health improvements.
The identification of the people most at risk in the population and the organisation of health services to reach out to them in a manner compatible with the limited human and financial resources available.
Health development policies and priorities that took guidance from macroeconomic policies and that in turn provided feedback that moulded government policies in relation to wellbeing and human development.
The MoH provided leadership and technical support in areas of significant importance in health improvement that were the more immediate responsibility of other government agencies.
Periodic review and evaluation of health outcomes and resource gaps led to related resource enhancement and corrections and shifts in direction in response to feedback from information collected and from stakeholders, including the community.
The use of a comprehensive but incremental approach to health development in response to community demands and political goals. At no stage was there a radical overhaul of the system.
However, there are also some lessons from the persisting challenges, such as:
How to garner community participation and involvement in health enhancement practices in a changed urban, industrialised and more affluent society.
The burden of non-communicable diseases prevalent before old age.
Responses to the ever-rising expectations of the public for more accessible and improved health services in the face of public funding constraints and the high cost of private health services.
Reconciliation of the political aim of increasing reliance on the private sector with its higher price with the related higher social cost and rising total health expenditure.
A number of questions could be raised in this context:
Are there applicable lessons from the past, such as how to address health threats arising from activities in other areas?
Is there a need for a paradigm shift in the provision of health services? What are the critical elements of such a shift and how can stakeholder support for them be garnered?
In line with Malaysia’s incremental and consensual approach, these challenges take time to resolve and achieve further enhancements of health. Significant change in the last decade has remained an unrealised goal.
12.6 Key Messages from Malaysia’s Experience
12.6.1 What Went Well?
Despite the highly centralised structure of the healthcare system, it
◦ contains both top-down and bottom-up systems for planning, evaluation and implementation,
◦ has good internal feedback loops, and
◦ has adaptive capacity at implementation level.
The system promoted and supported leadership development.
The centralised nature of the system addressed concerns of equity across administrative state boundaries.
12.6.2 What Did Not Go So Well?
Limited capacity to deal with determinants of health that are under the purview of other sectors.
Governance structure and inadequate information limited the ability to respond to some social and environmental issues arising from rapid urbanisation, such as:
◦ health in pockets of urban poverty,
◦ the health of marginalised groups, and
◦ loss of trust in authority and establishments, giving rise to anti-vaccination movements, etc.
The combination of the roles of provision and governance of healthcare in the public sector creates the appearance of conflicts of interest, such as:
◦ regulation of professional bodies, and
◦ governance of private sector healthcare.


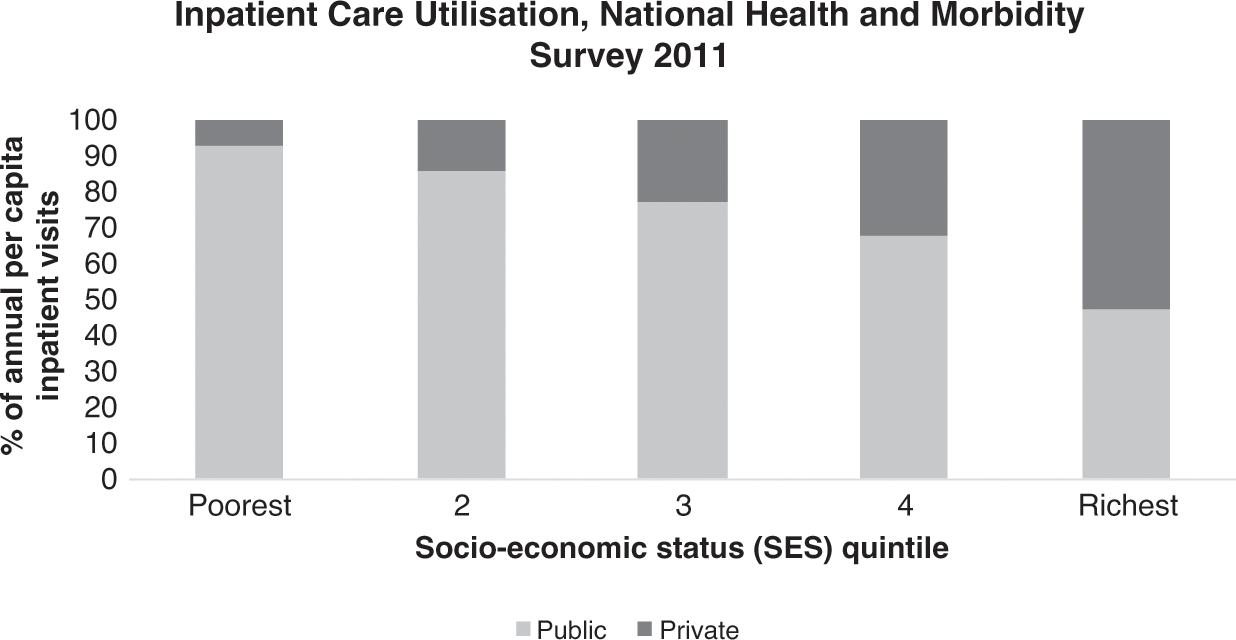


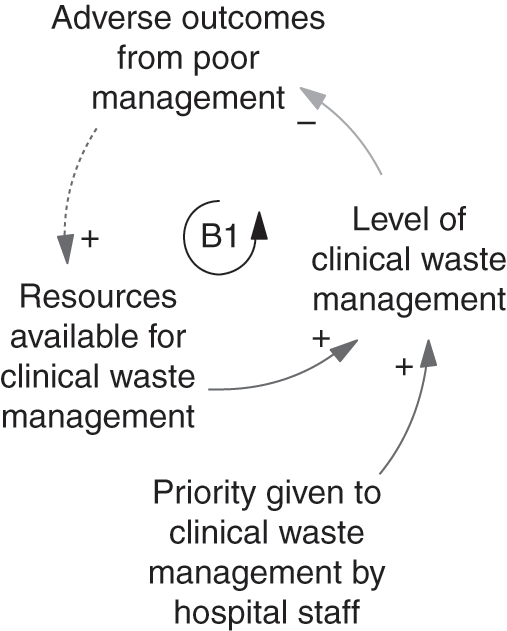


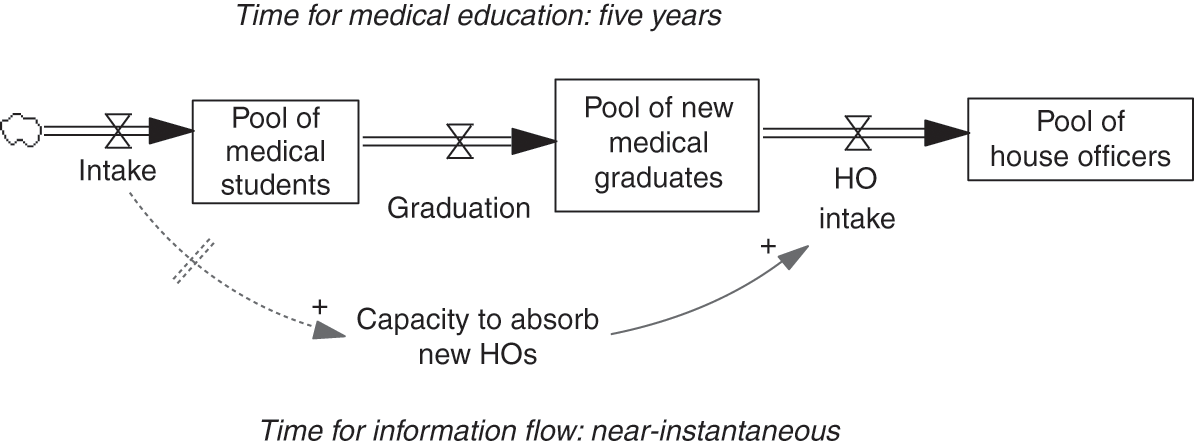


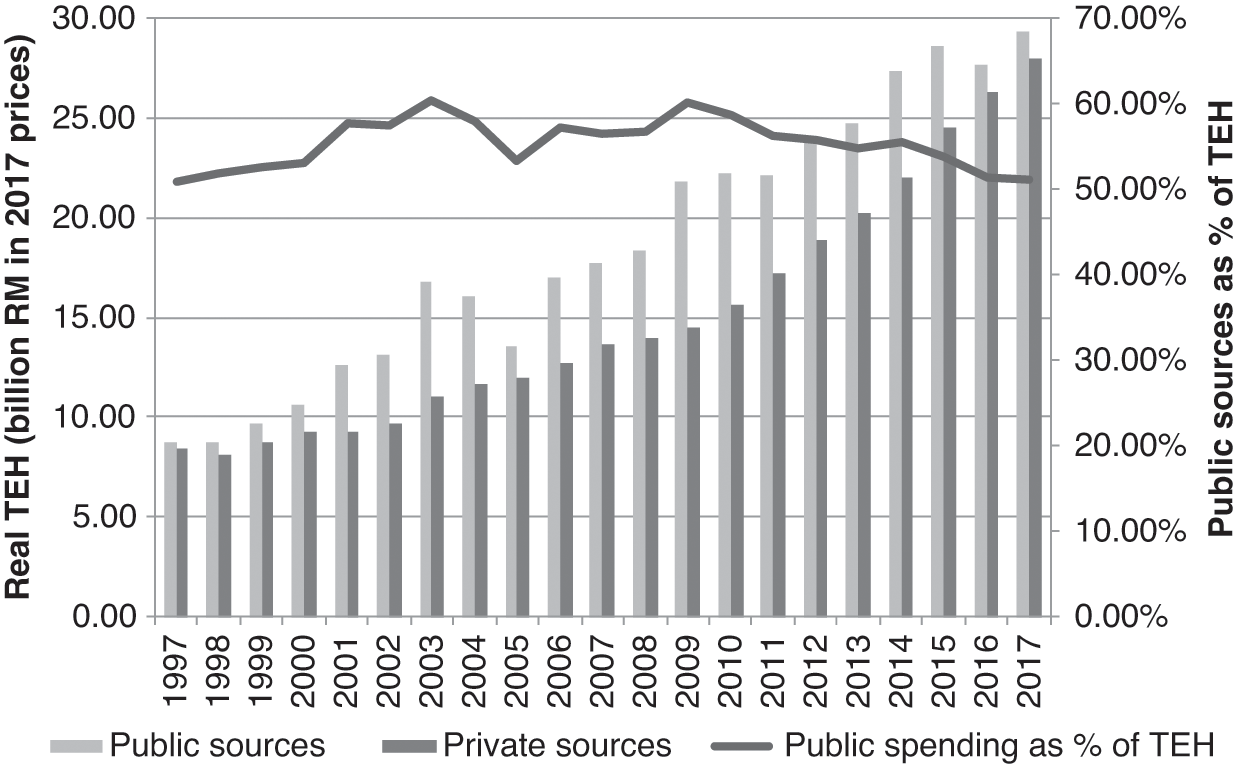


 Open access