INTRODUCTION
Because carbon is fundamental to life, 14CO2 has been given special attention among the radioactive tracers. Bomb radiocarbon (14C) is used in many applications, including studies of the carbon cycle and its dynamics, transport and reservoir exchange of CO2 between the atmosphere, the oceans, and the biosphere (e.g. Nydal Reference Nydal1968; Oeschger et al. Reference Oeschger, Siegenthaler, Schotterer and Gugelmann1975; Broecker et al. Reference Broecker, Peng and Engh1980; Druffel and Suess Reference Druffel and Suess1983; Randerson et al. Reference Randerson, Enting, Schuur, Caldeira and Fung2002; Hua and Barbetti Reference Hua and Barbetti2007; Naegler and Levin Reference Naegler and Levin2009; Levin et al. Reference Levin, Naegler, Kromer, Diehl, Francey, Gomez-Pelaez, Steele, Wagenbach, Weller and Worthy2010), dating of young material, and estimating regional fossil fuel CO2 levels (e.g. Rakowski et al. Reference Rakowski, Kuc, Nakamura and Pazdur2004; Levin et al. Reference Levin, Hammer, Eichelmann and Vogel2011). This research relies on precise observations of atmospheric 14CO2 that serve as a reference for the input into the carbon reservoirs.
The first regular measurements of the 14C concentration of tropospheric CO2 in the Northern Hemisphere revealed a clear seasonal cycle, superimposed on the general rise caused by the atmospheric nuclear weapons tests in the 1950s and 1960s (Nydal and Løvseth Reference Nydal and Løvseth1965; Nydal Reference Nydal1966; Levin et al. Reference Levin, Kromer, Schoch-Fischer, Bruns, Münnich, Berdau, Vogel and Münnich1985; Levin and Kromer Reference Levin and Kromer2004). Prior to the Partial Test Ban Treaty in 1963, most bombs were detonated on the land surface or in the troposphere and the fireball was lifted into the stratosphere by thermal buoyancy, which then acted as a 14C reservoir (Feely 1966; Bergkvist and Ferm Reference Bergkvist and Ferm2000). 14CO2 transferred down into the troposphere through the Northern Hemisphere spring exchange of air masses and consequently, the concentrations in the troposphere increased in spring and summer and decreased in autumn and winter (Nydal and Løvseth Reference Nydal and Løvseth1965; Nydal Reference Nydal1966).
However, these direct measurements of the 14C concentration of atmospheric CO2 started on a regular basis in 1959 in the Northern Hemisphere (Levin et al. Reference Levin, Kromer, Schoch-Fischer, Bruns, Münnich, Berdau, Vogel and Münnich1985; Levin and Kromer Reference Levin and Kromer2004) and in December 1954 in the Southern Hemisphere (Manning et al. Reference Manning, Lowe, Melhuish, Sparks, Wallace, Brenninkmeijer and McGill1990), only after the first series of nuclear weapons tests had already raised tropospheric 14C levels (Rafter and Fergusson Reference Rafter and Fergusson1957; Broecker and Walton Reference Broecker and Walton1959; Tauber Reference Tauber1960). Thus, the early part of the bomb calibration curve is based largely on single-year tree rings as a proxy for atmospheric 14C (Hua et al. Reference Hua, Barbetti and Rakowski2013). But due to the seasonality in tree growth, 14C concentrations in the cellulose of a full ring represent growth-weighted averages and will not capture the variability in atmospheric radiocarbon within a single year, especially when there are large and rapid changes in 14C concentrations.
The stratosphere-troposphere mixing period coincides roughly with the growth period of trees at mid-latitude. Sub-annual sampling of single tree rings over the 1963 bomb peak have shown that the 14C concentration of wood cellulose closely follows atmospheric 14C concentrations (Grootes et al. Reference Grootes, Farwell, Schmidt, Leach and Stuiver1989; Olsson and Possnert Reference Olsson and Possnert1992; Cain et al. Reference Cain, Griffin, Druffel-Rodriguez and Druffel2018). We present sub-annual 14C measurements for the years 1953–1965, eight samples per year, obtained from a Scots pine tree (Pinus sylvestris L.) growing in central Norway. The results show the increase in bomb 14C prior to the record of direct atmospheric measurements at biweekly to monthly resolution.
MATERIAL AND METHODS
Sample Description
A Scots pine tree growing in Trøndelag, central Norway (63°16’27”N, 10°27’23”E, 134 m a.s.l.) was sampled from two directions with a 10 mm increment corer at breast height at the end of August 2017. At these latitudes, Scots pine has a clear annual ring structure and dark latewood that makes the ring boundaries visible. In this part of the stem, the tree has 86 annual rings, which were dated by ring counting. Ring widths for the period 1953–1965, all from the heartwood, range from 1.98 to 6.14 mm. One core was taken from the east side of the trunk, from which we sampled the rings from 1953 to 1965 and due to a narrow ring in 1957, two cores were taken from the west side, from which we sampled the rings from 1953 to 1956 and 1957 to 1965, respectively. The tree grows approximately 17 km south of the closest larger city (Trondheim) and is presumably not influenced by local fossil fuel effects. The surrounding forest was planted in the 1980s, and the canopy was open in the 1950s and 1960s. Mean annual temperature in this area was 2.7°C between 1953 and 1965 and the mean annual precipitation sum in the same period was 958 mm (Norwegian Meteorological Institute, station code: 68860, 127 m a.s.l.).
Sample Preparation and AMS 14C Analysis
The cores were incrementally sliced with a hand-held scalpel for the years 1953–1965, where the increment width was chosen to achieve eight slices per year resulting in a total of 208 samples. To remove oils, resin, and waxes, each sample was treated separately with petroleum ether for one hour. Then, the samples were pre-treated for 14C analysis by extracting cellulose using an adaptation of the BABAB (base-acid-base-acid-bleach) protocol (Němec et al. Reference Němec, Wacker, Hajdas and Gäggeler2010). First, the samples were treated with 4% NaOH, followed by short steps of 4% HCl, 4% NaOH, and then 4% HCl again at 75°C. A bleaching step with a mixture of 5% NaClO2 and 4% HCl at 75°C (pH ≤ 4), with an ultrasonic bath at room temperature, follows at the end (Seiler et al. Reference Seiler, Grootes, Haarsaker, Lélu, Rzadecka-Juga, Stene, Svarva, Thun, Værnes and Nadeau2019). The resulting holocellulose was combusted in an elemental analyzer, and the CO2 was reduced to graphite with H2 gas over a Fe catalyst in an automated reduction system (Ohneiser Reference Ohneiser2006). Seiler et al. (Reference Seiler, Grootes, Haarsaker, Lélu, Rzadecka-Juga, Stene, Svarva, Thun, Værnes and Nadeau2019) describe the pre-treatment and graphitization procedures in more detail.
The 14C/12C ratio and the 13C/12C ratio in the graphite were measured in the 1MV AMS system at the National Laboratory for Age Determination in Trondheim (Nadeau et al. Reference Nadeau, Værnes, Svarva, Larsen, Gulliksen, Klein and Mous2015). Radiocarbon results are reported as Δ14C (Δ of Stuiver and Polach Reference Stuiver and Polach1977), which is calculated after correction for accelerator and preparation background, isotopic fractionation using δ13C measurements from AMS, and the radioactive decay of sample and standards. The measurement uncertainties were calculated according to Nadeau and Grootes (Reference Nadeau and Grootes2013) although the contributions from the fractionation correction and the normalization to the standards were omitted as they are very small compared to the other uncertainties. The measurements were normalized to the Oxalic Acid II primary standards (NIST SRM-4990C, Mann Reference Mann1983). The samples were measured in 15 different wheels together with other unknown samples as space permitted. Each wheel usually contains 10 (minimum eight) primary standards, five secondary standards, five process and machine blanks and 30 unknown samples. The blank correction was made assuming a modern contamination scaling inversely with the mass of the sample combusted (Seiler et al. Reference Seiler, Grootes, Haarsaker, Lélu, Rzadecka-Juga, Stene, Svarva, Thun, Værnes and Nadeau2019). The process blank curve was derived from measurements of coal samples of different weights measured over a few years as described by Seiler et al. (Reference Seiler, Grootes, Haarsaker, Lélu, Rzadecka-Juga, Stene, Svarva, Thun, Værnes and Nadeau2019).
Seventy-six targets (76) made from five different secondary standard materials were measured together with the samples in the various wheels: FIRI samples D, H, and J (Scott Reference Scott2003), Oxalic Acid I (NIST SRM 4990 B), and IAEA-C7 (Le Clercq et al. Reference Le Clercq, van der Plicht and Gröning1997). These have a 14C concentration ranging from 15 to 110 pMC. To compensate for the different radiocarbon concentrations and measurement uncertainties, the difference between measured and canonical values was normalized to the compounded uncertainty of the measurement and the canonical values (normalized deviation). The average of these should be centred around zero and the width of the distribution should be about 1 as it is in unit of σ. The average of the normalized deviations (n = 76) is 0.075 ± 0.11 σ indicating that there is no systematic offset. The standard deviation of the distribution is 1.07 σ indicating that the quoted uncertainties are representative of the true uncertainties of the measurements.
In addition, we measured the 13C/12C ratio of the cellulose in a Thermo Flash 2000 elemental analyzer connected to a Thermo Delta V Advantage isotope-ratio mass spectrometer (IRMS). The results are reported relative to the VPDB standard. Due to unexpected results, samples from 1953 (increments 4, 8), 1954 (2), 1955 (1–8), 1956 (7, 8), 1962 (1–8), 1963 (1, 2), 1965 (1) of the west core were reduced and measured again. The weighted averages of these repeat measurements are presented, where the weights are the inversed square of the measurement uncertainty.
Timing of Tree Growth
Cumulative wood formation usually follows a sigmoid shape, with slow increment during spring and early summer, fast increment in midsummer, and decreasing activity towards the end of the vegetation period (e.g. Ford et al. Reference Ford, Robards and Piney1978; Schmitt et al. Reference Schmitt, Jalkanen and Eckstein2004). In European and North American conifers of cold environments, the onset of cambial activity can vary from the beginning of May to early June, depending on intra-annual weather-, snow-depth-, and soil conditions (Vaganov et al. Reference Vaganov, Hughes, Kirdyanov, Schweingruber and Silkin1999; Deslauriers et al. Reference Deslauriers, Morin, Urbinati and Carrer2003; Rossi et al. Reference Rossi, Deslauriers, Anfodillo and Carraro2007; Hettonen et al. Reference Hettonen, Mäkinen and Nöjd2009). Despite these variations, maximum growth rate seems to be limited to a short period, which in most European and North American conifer species is about the time of maximum day length (Rossi et al. Reference Rossi, Deslauriers, Anfodillo, Morin, Saracino, Motta and Borghetti2006). Cessation of growth in Scots pine in Finland and Sweden usually takes place in August, depending on intra-annual conditions. In southern and northern Finland, wood formation ceased in mid-August (Mäkinen et al. Reference Mäkinen, Seo, Nöjd, Schmitt and Jalkanen2008), and in Sweden, radial growth was found to cease in early- to mid-August (Andersson Reference Andersson1953). We combine measurements of the progress of the radial increment of Scots pine from the middle boreal and southern boreal zones in Finland over 15 and 18 years, respectively, between 1978 and 2007 from Hettonen et al. (Reference Hettonen, Mäkinen and Nöjd2009). On average, 10% of the growth was completed by Julian date 162 ± 7, while 25%, 50%, 75%, and 90% were completed by Julian dates 173 ± 6, 185 ± 5, 200 ± 6, and 215 ± 9, respectively. Due to the increase in density associated with latewood formation in Scots pine, we do not adjust the timing of the sub-annual increments according to their mass as described by Cain et al. (Reference Cain, Griffin, Druffel-Rodriguez and Druffel2018). Assuming an onset of growth in mid-May and cessation of growth in mid-August, we thus interpolate a quadratic polynomial function from the data of Hettonen et al. (Reference Hettonen, Mäkinen and Nöjd2009), and assign the eight sub-annual wood increments to midpoints at 29th May, 16th June, 21st June, 29th June, 7th July, 17th July, 27th July, and 9th August. Taking into account that there are differences between geographical regions in addition to the intra-annual variation, we estimate an uncertainty in assigning the sub-annual samples to a date of approximately two weeks, with a somewhat higher uncertainty for the first and last increments.
RESULTS AND DISCUSSION
Results of Measurements and Comparison to Direct Atmospheric 14C Measurements
Cellulose extraction yields were on average 68% of the original sample mass with a range from 33 to 83%, and cellulose carbon contents were on average 44%, with an a range from 34 to 52%. We find no seasonal cycle in cellulose extraction yields or carbon content for the measured samples, however, cellulose extraction yields are on average 7% lower for the east core than for the west cores, with minimum values on the east core in 1959. The lowered cellulose yields are not associated with reduced carbon content or very narrow rings. The variation in extraction yields might thus be a result of variations in wood composition, in addition to weighing imprecision and/or humidity. This might also explain the variation in carbon content, although these are smaller than for the cellulose yields.
Due to the uncertainty associated with the assignment of a certain growing period to each sub-annual increment, attempts were made to fit the IRMS δ13C results to the record of atmospheric δ13C measurements in the Northern Hemisphere. This record features two main trends. Firstly, a seasonal cycle occurs with an increase in the 13C/12C ratio during summer when the selective assimilation of the light isotope during plant photosynthesis exceeds the remineralization of older plant material, and a decrease in winter with reduced or halted photosynthesis and increased fossil fuel combustion (e.g. Mook et al. Reference Mook, Koopmans, Carter and Keeling1983). Secondly, a long-term decrease with time occurs with the increase in combustion of fossil fuels (Keeling Reference Keeling1979). We compared our IRMS δ13C results to the seasonal cycle in atmospheric δ13C measurements from Point Barrow, Alaska between 1983 and 2008 (Keeling et al. Reference Keeling, Piper, Bollenbacher and Walker2010), corrected for the inter-annual trend associated with fossil fuel combustion by assuming a linear decrease in monthly averages. However, the IRMS δ13C values of our tree show an irregular, larger seasonal amplitude than the Point Barrow atmospheric measurements. We interpret this as the δ13C signal in the tree being not only dependent on the atmospheric ratio, but also on other environmental factors, making our δ13C IRMS measurements unsuited for adjusting the timing of the growing season.
We repeated 24 samples of the west core to check reproducibility and some apparently aberrant results. The average difference between original Δ14C measurement and repeat should ideally equate zero. Instead, we get an average offset from zero of 8.4‰ with a standard deviation of 16.1‰, much larger than the 3.4‰ expected from our measurement uncertainty. When disregarding deviating measurements between the two cores in the first and last increments, which might be influenced by wood from the previous or following year, the average offset is 2.8‰ with a standard deviation of 9.8‰ over 16 samples with repeats. This is not significantly different from zero and the standard deviation is closer to the combined 1-sigma measurement uncertainty for the differences, which range from 2.3 to 4.8‰ for the 16-sample set. Further exclusion of increments from years when the increase in atmospheric 14C was steep (1962, 63) yields an average offset of 0.8‰ and a standard deviation of 5.8‰ over 11 samples with repeats. This indicates that poor reproduction of repeats stems mostly from inhomogeneities in the cellulose, connected to the difficulty of exactly finding the boundaries for each annual ring in the manual sectioning of the wood core and to rapidly increasing atmospheric 14C levels during the growing season.
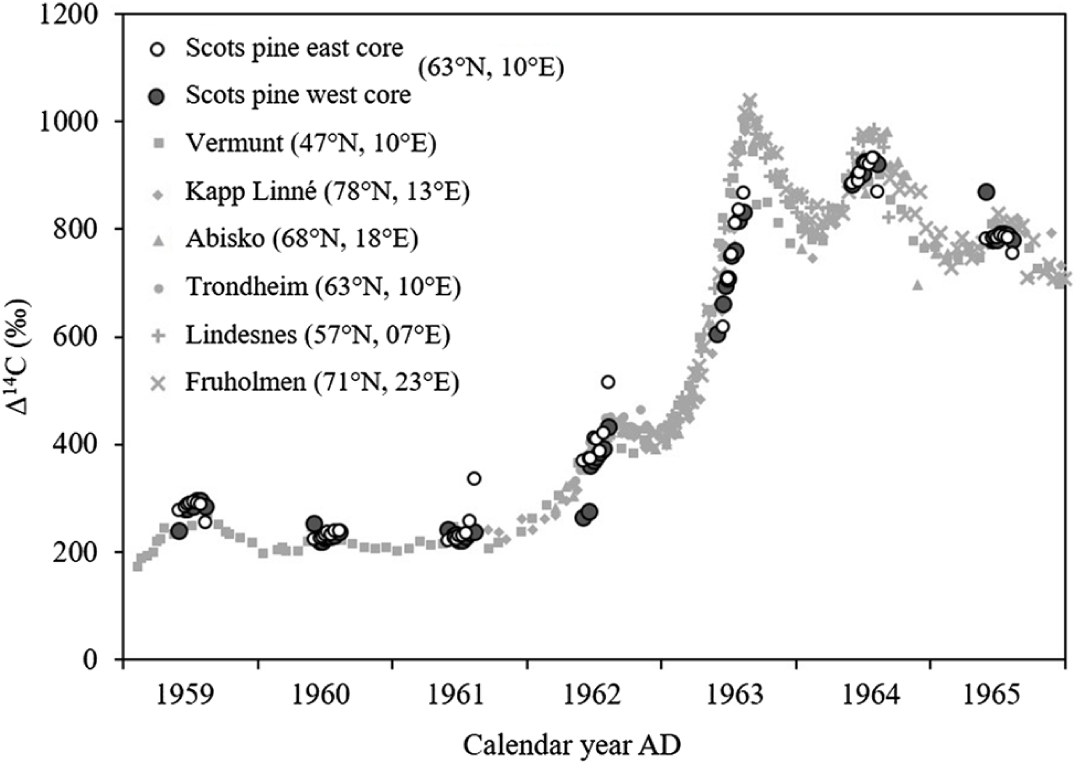
The east and west cores show the same general trend, but with some discrepancies between the cores, which mainly occur in the first and last increments of a year (Supplementary Figure S1 and Table S1). Such deviating measurements, visually identified, occur in the west cores in 1958 (increment 8), 1959 (1), 1960 (1), 1962 (1, 2), and in 1965 (1) and in the east core in 1956 (1, 8), 1957 (1), 1958 (7,8), 1959 (8), 1961 (8), 1962 (8), 1964 (8), and 1965 (8). These could be explained by having some wood of the previous or next year in the sample due to inaccuracies in the manual sectioning. All the deviating measurements are retained in Figures 1 and 2 and in the supplementary material because, in years with rapidly increasing or decreasing 14C content, such deviations could reflect real atmospheric changes. There are also discrepancies between the east and west cores in 1962 (4, 5), which might be caused by cellulose 14C inhomogeneity due to rapidly increasing atmospheric levels (Supplementary Figure S1).
Sub-annual cellulose Δ14C values in two wood cores from a Scots pine from central Norway for the years 1959–1965, compared to direct measurements of atmospheric Δ14C from Vermunt in Austria (Levin et al. Reference Levin, Kromer, Schoch-Fischer, Bruns, Münnich, Berdau, Vogel and Münnich1985; Levin and Kromer Reference Levin and Kromer2004), Kapp Linné on Spitsbergen (Olsson and Karlén Reference Olsson and Karlén1965; Stenberg and Olsson Reference Stenberg and Olsson1967; Olsson and Klasson Reference Olsson and Klasson1970; Nydal and Løvseth Reference Nydal and Løvseth1983), Abisko in northern Sweden (Olsson and Karlén Reference Olsson and Karlén1965; Stenberg and Olsson Reference Stenberg and Olsson1967; Olsson and Klasson Reference Olsson and Klasson1970), Trondheim in central Norway (Nydal and Løvseth Reference Nydal and Løvseth1983), Lindesnes in southern Norway (Nydal and Løvseth Reference Nydal and Løvseth1983), and Fruholmen in northern Norway (Nydal and Løvseth Reference Nydal and Løvseth1983). Error bars are too small to show in the figure.

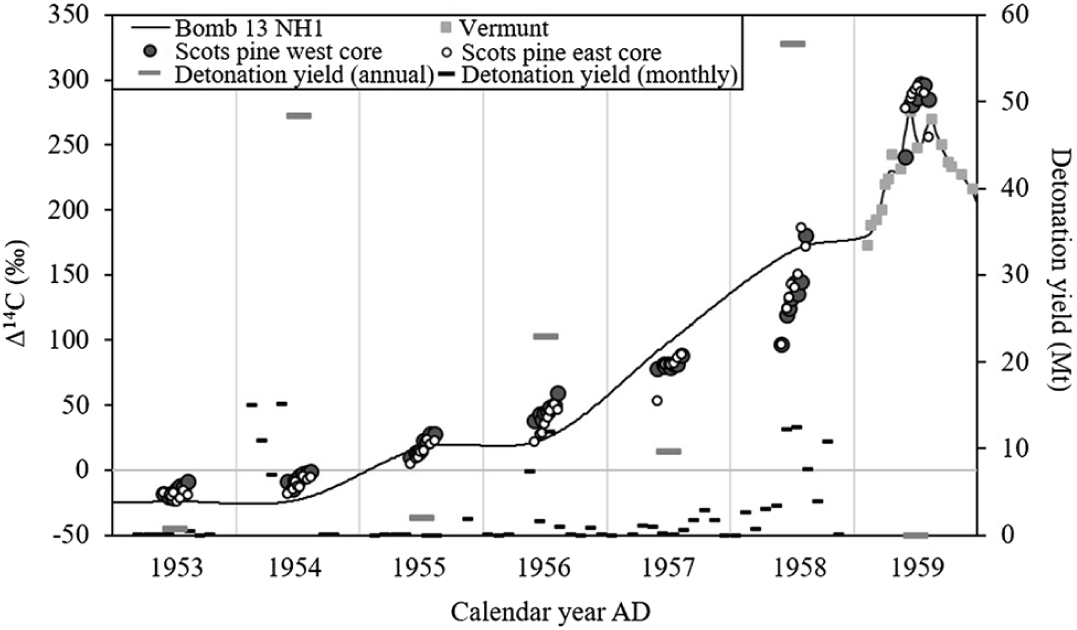
Sub-annual cellulose Δ14C values in a Scots pine from central Norway (63°N, 10°E) for the years 1953–1959, compared to direct measurements of atmospheric Δ14C from Vermunt (47°N, 10°E) in Austria (1959 only; Levin et al. Reference Levin, Kromer, Schoch-Fischer, Bruns, Münnich, Berdau, Vogel and Münnich1985; Levin and Kromer Reference Levin and Kromer2004), the Bomb 13 NH1 calibration curve (Hua et al. Reference Hua, Barbetti and Rakowski2013), and to monthly and annual detonation yields (Mt) from aboveground nuclear weapons tests (Bergkvist and Ferm Reference Bergkvist and Ferm2000). Error bars are too small to show in the figure.

The sub-annual cellulose 14C measurements of both cores in the period 1959–1965 are compared to direct atmospheric Δ14C measurement values from stations in Vermunt, Austria (Levin et al. Reference Levin, Kromer, Schoch-Fischer, Bruns, Münnich, Berdau, Vogel and Münnich1985; Levin and Kromer Reference Levin and Kromer2004), Abisko, Sweden (Olsson and Karlén Reference Olsson and Karlén1965; Stenberg and Olsson Reference Stenberg and Olsson1967; Olsson and Klasson Reference Olsson and Klasson1970), Kapp Linné on Spitsbergen (Olsson and Karlén Reference Olsson and Karlén1965; Stenberg and Olsson Reference Stenberg and Olsson1967; Olsson and Klasson Reference Olsson and Klasson1970; Nydal and Løvseth Reference Nydal and Løvseth1983), and in Norway (Nydal and Løvseth Reference Nydal and Løvseth1983) in Figure 1. The highest cellulose Δ14C value (933.7 ± 3.3‰) was measured for increment number seven of the east core in 1964, which was assigned to the 27th July midpoint. Tropospheric Δ14C levels were higher in 1963, however, the 1963 peak was not reached until late August (Nydal and Løvseth Reference Nydal and Løvseth1983) or in September (Olsson and Karlén Reference Olsson and Karlén1965), after the cessation of growth.
Our Scots pine Δ14C values, disregarding the measurements that deviates between the cores, mimic the direct atmospheric measurements from Vermunt for the years 1959 through 1965, except for 1963, where they are lower. In 1963, we observe an apparent parallel shift of about a month in our Scots pine compared to atmospheric measurements (Supplementary Figure S2). A similar shift was observed by Grootes et al. (Reference Grootes, Farwell, Schmidt, Leach and Stuiver1989) and Cain et al. (Reference Cain, Griffin, Druffel-Rodriguez and Druffel2018) and was attributed to a contribution of 13% to 28% of soil CO2 from decomposing plant material of previous years and to atmospheric circulation patterns, respectively. When comparing the atmospheric 14C records of different latitudes in the Northern Hemisphere, we note that Abisko in northern Sweden and Kapp Linné on Spitsbergen increases later in 1963 than records from Vermunt and Lindesnes. This could be because of increasing distance from the area of stratospheric injection into the troposphere although the results from Fruholmen, at a latitude that of between Kapp Linné and Abisko, do not show this delay. Values for Trondheim in May, June and July of 1963 are missing and more research is needed to investigate whether the apparent delay in cellulose Δ14C values compared to the atmosphere is due to the tree’s use of stored photosynthates, growth period changes, soil CO2,or some other mechanism that results in an apparent reservoir effect.
Cellulose Δ14C Values between 1953 and 1958
Our measurements in 1954, 1956, 1957, and 1958 (Figure 2) clearly deviate from the Bomb 13 NH1 calibration curve (Hua et al. Reference Hua, Barbetti and Rakowski2013). The bomb curve interpolates an even increase in Δ14C values between 1956 and 1959 based on full ring values, while our Scots pine 14C measurements show a clear seasonal signal in this period, analogous to that observed in the years 1959–1965. This is especially pronounced from 1955, following the heavy bomb tests in the summer of 1954. The growing season in Trondheim starts later and ends earlier than at mid-latitude. This may explain some of the differences between our measurements and the calibration curve. This is clearly seen in 1963, when the Trondheim tree does not reach the atmospheric peak. In 1958, the Trondheim tree suggests an increase of 78.6‰ in Δ14C values based on a weighted average of the two cores from May to August, which is just as steep as the increase in 1959. This is probably caused by nuclear tests amounting to 6.4 Mt (megaton TNT equivalent) being detonated in the autumn of 1957, together with a larger proportion of nuclear tests being carried out at high latitudes early in the growing season of 1958 compared to previous years. The yield of detonations between January and March of 1958 on test sites in East Kazakhstan (50°N, 78°E) and on Novaya Zemlya (74°N, 56°E) amounted to a total of 3.38 Mt (Bergkvist and Ferm Reference Bergkvist and Ferm2000). These explosions may have contributed to raising tropospheric 14C levels in central Norway in the growing season in the same year. This might also explain why our cellulose Δ14C levels are higher than Vermunt atmosphere in 1959. In 1954, when annual detonation yield was over 48 Mt, we only observe a 7.9‰ increase in the cellulose Δ14C values. Although the largest bombs were detonated between January and May of 1954, these tests were carried out on the Bikini (11°N, 165°E) and Enewetak (11°N, 162°E) atolls in the tropical Pacific Ocean. 14C created from these explosions does not seem to have reached central Norway until the atmospheric mixing in the spring of 1955.
Sub-Annual Tree-Ring Measurements as a Tracer for Atmospheric 14C
Because most atmospheric nuclear weapons tests were carried out in the Northern Hemisphere, large 14C gradients were observed in the troposphere in the 1960s (Nydal Reference Nydal1966). Intra- and interhemispheric differences in 14C concentrations have also been shown to be modified by atmospheric circulation and ocean uptake in this period (e.g. Randerson et al. Reference Randerson, Enting, Schuur, Caldeira and Fung2002; Hua and Barbetti Reference Hua and Barbetti2007). Therefore, to quantify the immediate atmospheric 14C response to nuclear tests carried out in the 1950s and complete the record of atmospheric radiocarbon for the period 1950–2010 (Hua et al. Reference Hua, Barbetti and Rakowski2013), our measurements of the 14C concentrations in the Trondheim pine should be repeated by sub-annual sampling of tree rings at different latitudes and longitudes.
Recent research has emphasized the significance of rapid excursions in atmospheric 14C concentration (Miyake et al. Reference Miyake, Nagaya, Masuda and Nakamura2012; Reference Miyake, Masuda and Nakamura2013) and the limitations of decadally averaged calibration data (Bayliss et al. Reference Bayliss, Marshall, Tyers, Bronk Ramsey, Cook, Freeman and Griffiths2017), which again has prompted researchers around the world to create and apply more detailed datasets (e.g. Wacker et al. Reference Wacker, Güttler, Goll, Hurni, Synal and Walti2014; Sigl et al. Reference Sigl, Winstrup, McConnell, Welten, Plunkett, Ludlow, Büntgen, Caffee, Chellman, Dahl-Jensen, Fischer, Kipfstuhl, Kostick, Maselli, Mekhaldi, Mulvaney, Muscheler, Pasteris, Pilcher, Salzer, Schüpbach, Steffensen, Vinther and Woodruff2015; Dee and Pope Reference Dee and Pope2016; Pearson et al. Reference Pearson, Brewer, Brown, Heaton, Hodgins, Jull, Lange and Salzer2018). However, comparisons of the 14C concentration in the earlywood contra latewood of certain deciduous tree species have revealed that efforts to produce single-year calibration curves need to take into account the intra-seasonal variability in tree rings and the differences in the deposition of stored carbon in different species of trees (McDonald et al. Reference McDonald, Chivall, Miles and Bronk Ramsey2018). We here confirm the findings of Grootes et al. (Reference Grootes, Farwell, Schmidt, Leach and Stuiver1989) that coniferous trees grown in open conditions can be excellent proxies for atmospheric 14CO2, even on a sub-annual basis. Our results show that in periods of rapid changes in atmospheric 14C concentrations, measuring only the earlywood and latewood is insufficient to utilize the potential for obtaining the full details on atmospheric change that is available in tree rings.
CONCLUSIONS
Sub-annual sampling of Scots pine tree rings in central Norway over the 1959–1965 bomb peak confirms earlier findings that tree cellulose can trace the changes in atmospheric 14C content at a biweekly to monthly resolution. A new dataset for the period 1953–1958, reveals a seasonal signal in atmospheric 14C before the onset of direct atmospheric measurements in 1959 and a detailed response of the atmospheric 14C concentration in central Norway to the aboveground nuclear weapons tests in this period. Accurate knowledge of the timing of the tree’s radial growth and of its potential use of stored photosynthate or sub-canopy air is needed to fully utilize the sub-annual information in tree rings.
ACKNOWLEDGMENTS
We thank the Norwegian University of Science and Technology and especially its University Museum for their support. Thank you also to two reviewers whose comments helped improve the manuscript.
SUPPLEMENTARY MATERIAL
To view supplementary material for this article, please visit https://doi.org/10.1017/RDC.2019.98