
I. INTRODUCTION
Shape memory alloys (SMAs) are functional materials with the ability to recover large deformations via reversible, diffusionless, and martensitic phase transformations. These phase transformations can be induced either thermally or mechanically, creating a strong temperature dependence on the mechanical stress–strain response of the material. Thermally activating the phase transformations from below the phase transformation temperature enables the shape memory effect, or the recovery of a previous structural shape after seemingly permanent deformation. Mechanically activating the phase transformation at temperatures just above the phase transformation temperature gives rise to superelasticity, or the ability to recover unusually large strains of about 5–8% for NiTi SMAs.
Repeated thermomechanical cycling of phase transformations in SMAs can cause two types of fatigue, functional fatigue and structural fatigue, both of which are relevant in SMA applications. Functional fatigue (or shakedown) is the progressive decay in the phase transformation response during early-life cycling, including the evolution of transformation temperatures, residual strain, latent heat, enthalpy, and hysteresis. Structural fatigue involves material failure with crack initiation, fatigue crack growth (FCG), and eventual fracture. In SMAs, fatigue cracking involves complex thermal and mechanical interactions among plasticity, phase transformation, and other deformation mechanisms such as martensite detwinning.
The focus of this work is to characterize the structural fatigue of polycrystalline NiTi SMAs of various grain sizes. A damage-tolerant approach to structural fatigue measurements is taken, where incremental crack growth rates are measured as a function of stress intensity, as opposed to a total-life fatigue approach. As noted in Ref. Reference Robertson, Pelton and Ritchie1, the majority of structural fatigue studies to date on NiTi have taken total-life fatigue approaches. This is primarily because the biomedical devices that comprise the largest share of NiTi applications have small dimensions and critical crack lengths, such that the time between crack initiation and failure is very short. Reference Robertson, Pelton and Ritchie1 Total-life fatigue approaches are most applicable to a specific product or device form, while a damage-tolerant approach distinguishes fatigue crack thresholds and FCG rates for the material in a more general sense. Reference Robertson and Ritchie2
Damage-tolerant approaches cyclically load a material sample, such as a notched/precracked compact tension specimen, while measuring the crack length (a) during a number of cycles (n). The load is converted to a stress intensity factor (K) that characterizes the elastic stress singularity at the crack tip, and the sample is cyclically loaded between two values, K min and K max. The stress ratio is defined as R = K min/K max. The crack growth rate (da/dn) is plotted against the rise in the stress intensity factor (ΔK = K max − K min). Below a certain threshold value (ΔK < ΔK th), the crack growth rate is essentially zero. At moderate stress intensities above this value, the regime of stable crack growth is often described by a Paris Law. Reference Paris, Gomez and Anderson3
At the microscale, measurements of the local crack opening displacements can capture the behavior near the crack tip. In these measurements, a relevant parameter is the minimum value of the stress intensity necessary to separate the adjacent crack faces (K open). As originally shown experimentally in an Al alloy (with R = 0) in Ref. Reference Elber4 and nicely described in Ref. Reference Sehitoglu5, a crack may remain closed during a portion of a fatigue cycle due to residual stresses from plastically deformed material ahead of the crack tip. As the crack advances, the material behind the crack unloads, and trailing crack surfaces are driven into contact before the minimum load is reached during the cycle. Thus, a (potentially large) residual compressive stress is generated in the wake of the crack that requires a finite positive load, or ΔK open, to open the crack. This ‘crack closure effect’ is the result of elastoplastic behavior of the material, which is not captured by linear elastic fracture mechanics. Crack closure reduces the effective stress intensity factor and generally results in slower crack growth in the material than in a purely elastic material.
In this work, both macroscopic crack growth rates and microscopic crack opening displacements are measured. This multiscale experimental approach is used to study the effects of grain size (GS) on fatigue cracking in NiTi, but it could be readily applied to study fatigue cracking in other structural materials.
A. Nanocrystalline NiTi shape memory alloys
When the average GS of the SMA NiTi is refined to the nanocrystalline (NC) regime, several beneficial properties emerge, including a very narrow stress–strain hysteresis, a broad temperature window for superelasticity, improved thermomechanical cyclic stability, reduced latent heat generation, and a reduced sensitivity to deformation rate. Reference Sun, Aslan, Li and Chen6 These properties give rise to better stability in terms of functional fatigue, but the structural fatigue of NC NiTi remains poorly characterized.
Interestingly, NC NiTi SMAs do not exhibit shape memory, but still exhibit superelasticity. Reference Waitz, Tsuchiya, Antretter and Fischer7 While the absence of shape memory limits the use of NC NiTi in certain applications, the majority of commercial SMA applications exploit superelasticity, such as biomedical devices. Reference Duerig, Pelton and Stöckel8 Moreover, compared to commonly available NiTi SMAs, NC NiTi has a wider temperature range for superelasticity and reduced thermomechanical sensitivities. Typical coarse-grained NiTi has a superelastic temperature window of about 50 °C, while 10 nm GS NiTi has a superelastic window of 130 °C. Reference Sun, Aslan, Li and Chen6 Coarse-grained NiTi has acute thermomechanical couplings that alter the material’s stress–strain response with relatively small temperature changes, on the order of tens of degrees Celsius, which leads to hypersensitivities to the loading rate and heat transfer characteristics of the ambient medium. Reference Shaw and Kyriakides9 These issues are largely avoided by the use of NC NiTi.
The origin of NC NiTi’s remarkable properties is a homogeneous phase transformation, unlike the macroscopic nucleation and growth behavior of transformation in coarse-grained NiTi that involves strain localization and propagation phenomena. Reference Shaw and Kyriakides9–Reference Li and Sun13 In typical coarse-grained NiTi (GS ≈ 10 µm Reference Robertson, Pelton and Ritchie1 ), martensitic phase transformation localizes as multiple laminates within a grain. With GS below about 70 nm, however, a single laminate of martensite can form. The GS threshold for this single, continuous martensite laminate in NC NiTi has been measured with X-ray diffraction (XRD) to be 68 nm, under which there is a transition in XRD profiles from multiple peaks to a single, shifting peak. Reference Ahadi and Sun14 Furthermore, a recent simulation of the interplay between the interface and strain energies predicted that multiple laminates of martensite within one grain are more favorable than a single laminate above a GS diameter of about 70–90 nm. Reference Petersmann, Pranger, Waitz and Antretter15
Despite the remarkable functional fatigue resistance of NC NiTi, the critical stress intensity factor for crack extension (or mode I fracture toughness, K IC) monotonically decreases with NC grain size. Reference Ahadi and Sun16 For 10 and 18 nm GS NiTi, the crack growth resistance curves (stress intensity factor as a function of crack extension) were nearly flat. SEM fractography revealed cleavage planes with little ductile dimpling in the 10 and 42 nm GS, a mix of cleavage planes and dimpling in the 80 nm GS, and significant ductile dimpling in the 1500 nm GS. Notably, these fracture measurements were conducted on NC NiTi samples with the same compact tension geometry, cold rolling, and heat treatments used in the present study. Reference Ahadi and Sun16
There is currently a lack of consensus about NC NiTi’s FCG resistance. No results exist on damage tolerance with crack growth rates for cold-rolled NC NiTi, though recent works on cold-rolled NC NiTi Reference Yin, He, Moumni and Sun17 and equal channel angular pressed (ECAP) NC NiTi Reference Leitner, Sabirov, Pippan and Hohenwarter18 suggest that FCG resistance may decrease nonmonotonically with decreasing grain size. One recent work Reference Yin, He, Moumni and Sun17 studied the low-cycle fatigue life of NC NiTi tensile samples without notch defects. Although the NiTi alloy composition and sample geometry were different from this work, the same cold rolling and heat treatment conditions were used. GS refinement was shown to have an effect on fatigue life only under certain loading conditions. The 10 nm GS improved low-cycle fatigue life (N f < 104 cycles) for a cyclic uniaxial stress of σmax = 450 MPa with complete unloading (R = 0), but GS refinement had no effect for a lower cyclic peak stress of σmax = 300 MPa. Specific mechanisms for the different crack growth responses were not identified. Another recent work Reference Leitner, Sabirov, Pippan and Hohenwarter18 showed that ultra-fine grained ECAP NiTi had significantly increased transformation and yield stresses compared to coarse-grained NiTi without negatively affecting the structural fatigue response. The ultra-fine grained NiTi had large fractions with GS < 1 µm, with some large grains up to a few microns, and the coarse-grained NiTi had GS ≈ 100 µm. Additionally, the FCG resistance was mildly enhanced for high mean stresses (R = 0.7). Reference Leitner, Sabirov, Pippan and Hohenwarter18 Although ECAP processing cannot produce grain sizes below 70 nm and does not achieve the exceptional functional fatigue resistance of cold-rolled NC NiTi, Reference Prokofiev, Burow, Frenzel, Gunderov, Eggeler and Valiev19 the fact that the severe plastic deformation of NiTi can result in similar or in even improved FCG resistance is intriguing.
B. Fatigue crack characterization
On the macroscale, crack growth rates have been measured with indirect techniques, such as electric potential difference (EPD) and the adjusted compliance ratio (ACR, using a back-face strain gage) method. Both EPD and ACR require crack length calibrations, usually using an optical technique. These methods were applied recently to study the FCG rates of ECAP NiTi, Reference Leitner, Sabirov, Pippan and Hohenwarter18 as well as cold-drawn and hot-rolled NiTi. Reference Gall, Tyber, Wilkesanders, Robertson, Ritchie and Maier20 Unfortunately, indirect measurements cannot accurately capture cracks with branching or skewed paths to the tensile loading axis. Even direct optical observation of a crack can be problematic, due to rigid body motion of the sample, requiring position reference marks on the sample. 21
Originally developed by Sutton and co-workers in the 1980s, digital image correlation (DIC) is a powerful optical method for measuring displacement fields on a surface. Reference Sutton, Orteu and Schreier22 Measurements can be performed either with a single camera to measure displacements in two dimensions (2-D DIC) or with two or more cameras to measure displacements in three dimensions (3-D DIC). In the context of materials testing, DIC measures displacements on a sample surface from a sequence of images captured during mechanical testing. A DIC algorithm (between reference and current image pairs) is inherently length scale independent, so the physical length scale is determined by the field of view (FOV) of the images. The technique requires uniformly sized, randomly positioned, and visibly contrasting features on the sample to form a “speckle pattern” for tracking. Unless the sample surface already has suitable contrasting features, an artificial speckle pattern is applied, often by painting for samples at the millimeter scale. The size and distribution of the speckles, combined with the digital camera resolution, determine the spatial resolution of the measurement.
DIC was first applied to problems in fracture mechanics in 1987 to estimate stress intensity factors. Reference McNeill, Peters and Sutton23 The application of DIC to measure crack opening and closing displacements was pioneered in the late 1990s, Reference Sutton, Zhao, McNeill, Helm, Piascik and Riddell24 but there have been relatively few studies using DIC to measure crack displacements, as noted by Ref. Reference O’Connor, Nowell and Dragnevski25. Optical observations of the crack tip are especially helpful when cracks branch or run along oblique directions to the loading axis. Incremental crack growth rates have been measured with optical DIC (primarily 2-D DIC Reference Sangid, Pataky, Sehitoglu, Rateick, Niendorf and Maier26 ), but these measurements can exhibit a large degree of scatter due to the limited magnification of optical microscopy. A comparison of DIC with a crack mouth gage and the ACR method (back-face strain gage) was performed in Ref. Reference de Matos and Nowell27, and DIC was accurate for samples that approximated the plane stress and do not have significant crack length differences across the sample thickness. Crack length differences here were verified in Sec. II.C to be acceptably small.
Microscale optical DIC has been used to examine FCG rates in recent multiscale investigations by Sehitoglu and others, Reference Sangid, Pataky, Sehitoglu, Rateick, Niendorf and Maier26,Reference Carroll, Efstathiou, Lambros, Sehitoglu, Hauber, Spottswood and Chona28–Reference Carroll, Abuzaid, Lambros and Sehitoglu30 at spatial resolutions in the range of 0.4–2.0 µm per pixel. The importance of crack closure measurements and the application of DIC for measuring crack opening and closing displacements was discussed by Carroll et al. Reference Carroll, Efstathiou, Lambros, Sehitoglu, Hauber, Spottswood and Chona28 Recently, these multiscale investigations with optical, microscopic DIC measurements of crack opening have been applied to examine the damage tolerance of advanced alloys, including NC Ni–Co alloys Reference Sangid, Pataky, Sehitoglu, Rateick, Niendorf and Maier26 and Hastelloy X. Reference Casperson, Carroll, Lambros, Sehitoglu and Dodds29 Another study on Hastelloy X included sub-grain level measurements of plastic strain accumulation near fatigue cracks, with the microstructure characterized by electron backscatter diffraction and overlaid with optical DIC measurements. Reference Carroll, Abuzaid, Lambros and Sehitoglu30
DIC within a scanning electron microscope (SEM-DIC) was introduced in the late 2000s and overcomes magnification limitations imposed by the wavelength of visible light. Reference Sutton, Li, Garcia, Cornille, Orteu, McNeill, Schreier, Li and Reynolds31,Reference Sutton, Li, Joy, Reynolds and Li32 The precision required to measure the microscopic crack opening levels in the present work was enabled by SEM-DIC. Optical microscopic DIC, with about an order of magnitude coarser resolution from the diffraction limit of light, may not have been able to resolve the sub-500 nm Δv displacement differences in this work between the 1500 nm sample and the other grain sizes. Complicated techniques exist to achieve better resolution than the diffraction limit in optical microscopes (such as interferometric microscopy, 4Pi microscopy, total internal reflectance microscopy, and stimulated emission depletion microscopy), but to the authors’ knowledge, these techniques have not yet been applied with DIC.
SEM-DIC requires a sufficiently fine speckle pattern on the sample surface. One option is the application of self-assembled Au nanoparticles, which was successfully demonstrated for SEM-DIC with a spatial resolution of 4 nm per pixel on 99.99% aluminum, 1100 aluminum, a nickel-chromium superalloy, and silicon carbide samples. Reference Kammers and Daly33 A drawback to SEM-DIC, however, is the added complexity from error sources that are not present with optical DIC, including spatial and drift distortions, scanning errors (also called image shifts or jumps), and non-negligible sample stress relaxation. Reference Sutton, Li, Garcia, Cornille, Orteu, McNeill, Schreier, Li and Reynolds31,Reference Kammers and Daly34 Various techniques, such as time averaging of images and distortion corrections, have been attempted to address these issues. In this work, we introduce an improved external scan control technique to address the source of the electron beam scanning errors.
II. METHODS
This work presents the first measurements of FCG rates at both low-and high-stress intensities in NC NiTi sheet samples with average grain sizes from 1500 nm down to 10 nm (Sec. II.A). To connect macroscopic crack growth rates to the microscopic crack opening displacements, experiments were performed with both optical DIC and SEM-DIC to study the responses across a broad range of length scales. At both the macroscopic and microscopic length scales, spatially resolved displacements from DIC enabled crack tip measurements without the need for crack length calibrations and assumptions required for other techniques. Macroscopic DIC enables accurate crack growth rate measurements and can identify if and when cracks branch or propagate in oblique directions. The issue of scatter was minimized by using an optimized, optical 3-D DIC system (Sec. II.B) with high-quality lenses, low-noise machine vision cameras, and cross polarization to increase contrast and eliminate saturated pixels. Reference LePage, Daly and Shaw35 At the microscale, SEM-DIC was used to measure the relative displacements between the crack faces (Δv) close to the crack tip, aiding in the characterization of mechanisms of crack growth resistance, such as crack closure. SEM-DIC was recently applied by others to measure crack opening and closing displacements in an aluminum alloy with a spatial resolution of 70 nm per pixel. Reference O’Connor, Nowell and Dragnevski25 In this study, a resolution of 31.25 nm per pixel was achieved with SEM-DIC during the loading of the precracked samples. As discussed in Sec. II.C, a custom, high-precision, external scan controller was used for the first time that largely eliminated scanning distortions and drift in the electron beam, providing improved accuracy in the SEM-DIC measurements. The experimental program consisted of samples with 10, 18, 42, 80, and 1500 nm GS, each subjected to a three-step sequence of experiments: (i) high ΔK FCG measurements with optical DIC, (ii) one loading cycle at high ΔK to measure crack opening displacements by SEM-DIC, and (iii) low ΔK FCG measurements with optical DIC.
A. Sample preparation
Superelastic NiTi sheets of 1.72 mm thickness with a slightly nickel-rich composition (50.9 at.% Ni, 49.1 at.% Ti) were obtained from Confluent Medical (Fremont California, formerly Nitinol Devices Company, or NDC; alloy SE508). The as-received sheets were annealed at 800 °C for 1 h in a furnace with flowing argon and then quenched in room temperature water. The sheets were then cold rolled between stainless steel plates to 1.00 mm (42% thickness reduction). Compact tension samples conforming to ASTM E561 36 with dimensions shown in Fig. S1 were produced by wire electrical discharge machining (EDM), with the crack notch direction perpendicular to the rolling direction. The cold-rolled compact tension samples were heat treated at different temperatures and durations (Table S1) to produce average grain sizes of 10, 18, 42, 80, and 1500 nm, as measured by transmission electron microscopy. Reference Ahadi and Sun37,Reference Ahadi and Sun38 Above 100 nm GS, the mechanical response of NiTi does not change significantly, so the 1500 nm GS sample is a representative baseline for comparison with the NC GSs. Reference Ahadi and Sun37,Reference Ahadi and Sun38 The condition without heat treatment after cold rolling had an average GS of 10 nm, so only the larger grain sizes had subsequent heat treatments. The sample surfaces were ground and polished with a sequence of 400, 600, 800, and 1500 grit silica papers and then finally polished with a 5:1 volume ratio mixture of colloidal silica (Buehler MasterMet 2, 0.02 µm) and 30% hydrogen peroxide (Fisher H325) on a microfiber cloth (Buehler MicroCut). The hydrogen peroxide accelerated the final polish with surface oxidation and aided the silanization step for self-assembled gold nanoparticle patterning for SEM-DIC, described in Sec. II.C.
For optical DIC, samples were speckle patterned after polishing using an Iwata CM-B airbrush with a basecoat of white paint (Golden High Flow Titanium White), followed by the application of black speckles (Golden High Flow Carbon Black). This paint sequence, white paint followed by black paint, provides higher contrast and lower DIC errors than the converse. Reference LePage, Shaw and Daly39
After performing macroscopic, high ΔK FCG measurements (Sec. II.B), the painted speckle pattern was removed with methanol, and the samples were coated with self-assembled gold nanoparticles (AuNPs) to create a suitable speckle pattern for SEM-DIC. The patterning procedure in Ref. Reference Kammers and Daly33 had three basic steps: (i) promote oxide/hydroxyl groups on the sample surface, (ii) form a thin organosilane layer with silane molecules that covalently bond to the reactive oxide/hydroxyl groups and have pendant functional groups that point away from the oxide/hydroxyl groups, and (iii) soak samples in AuNP colloid and allow AuNPs to self-assemble on the pendant functional groups of the silane molecules. We modified this procedure slightly: step (i), final polishing with the 5:1 mixture of colloidal silica and 30% hydrogen peroxide was sufficient; step (iii), samples were soaked in an AuNP colloid with an average diameter of about 50 nm for an extended period of 7 days, to allow for the formation of AuNP aggregates for the relatively wide SEM-DIC horizontal field width (HFW) of 200 µm, and on the third and fifth days, the samples were rinsed and placed in fresh AuNP colloid. After the SEM-DIC crack displacement measurements (Sec. II.C), the samples were cleaned again with methanol and speckle painted again for the low ΔK FCG measurements (Sec. II.D).
B. Macroscale fatigue measurements at high ΔK
The first stage of the fatigue procedure for each sample consisted of macroscale crack growth measurements during cyclic loading at high stress intensity (K). Fatigue cracks were grown in the compact tension samples from the initial EDM notch length of a
0 = 8.0 mm to a crack length of a = 10.0 mm. This was performed in room temperature air with a TA ElectroForce LM1 system operating at 10 Hz in load control at an initial peak stress intensity factor (K
max) of about
 $6\;{\rm{MPa}}\sqrt {\rm{m}}$
(based on the notch length, a
0) and a stress intensity ratio R = K
min/K
max = 0.1. At this stress intensity level, the FCG rate was in a high ΔK regime, with crack growth rates exceeding 10−8 m per cycle.
The stress intensity factor (K) was calculated following ASTM E561 11.3. 36 For an applied force P, crack length a, sample thickness B, and sample width W,
 $$K = {P \over {B\sqrt W }}{{\left( {2 + {a \over W}} \right)} \over {{{\left( {1 - {a \over W}} \right)}^{3{\rm{/}}2}}}}f\left( {{a \over W}} \right)\quad ,$$
with
 $$f\left( {{a \over W}} \right) = 0.886 + 4.64\left( {{a \over W}} \right) - 13.32{\left( {{a \over W}} \right)^2} <$$><$$>+ 14.72{\left( {{a \over W}} \right)^3} - 5.6{\left( {{a \over W}} \right)^4}\quad .$$
This formula is based on linear elastic fracture theory, which is not strictly valid for SMA behavior. Reference Wu, Ojha, Patriarca and Sehitoglu40 However, it was adopted here since it is proportional to the applied load P, provides a simple measure of the stress intensity, and provides a reasonable estimate if the inelastic zone at the crack tip is small.
The crack length was monitored with an optical 3-D DIC system with a precision of about 25 µm minimum detectable crack extension and an accuracy within about 50 µm, as determined from postmortem SEM images. The optical 3-D DIC system (shown in Supplementary Material Fig. S2) consisted of two cameras (Point Gray Grasshopper GRAS 50S5M-C with Nikon Micro Nikkor 200 mm f/4 lenses) and two LED light panels (LitePanels Astra 935-1003). The FOV was 8.0 mm and 2448 px for a pixel size of 3.3 µm. An image pair for 3-D DIC was captured every 1000 fatigue cycles during the minimum and maximum applied loads, and the fatigue cycling was paused for 2 s for each image pair. Cross polarization was utilized by placing linear polarizing filters (Tiffen 62POL) on the lenses in an orthogonal position to linear polarizing filters (American Polarizers AP38-030T with 38% transmission) on the LED lights. Cross polarization increases contrast, lowers optical DIC error, and attenuates saturated pixels to preserve sub-pixel displacement accuracy. Reference LePage, Daly and Shaw35 Distortions from thermal air currents were minimized by gently blowing air from a fan over the setup. The fan was mounted adjacent to the macroscopic fatigue system on a tripod that was not in contact with the optical table of the DIC system, to avoid introducing vibrations. Reference Reu, Jones, Sutton and Reu41
Cracks can be identified and tracked using various DIC quantities, including the correlation residual (also called correlation confidence interval, or CCI), displacement field discontinuities, and strain field discontinuities. Reference Hild and Roux42 CCI is a statistical measure of the local quality of correlation, with units of pixels, and a value of zero indicating perfect correlation. Using CCI to locate crack tips was introduced by Cady, Liu, Rae, and Lovato. Reference Cady, Liu, Rae and Lovato43,Reference Liu, Cady, Rae and Lovato44 The major principal strain field (ε1) has also been used to locate multiple cracks in the complicated fracture of large masonry walls. Reference Wang, Li, Sanusei, Ghorbani, Matta, Sutton, Jin, Sciammarella, Yoshida and Lamberti45 Regardless of the quantity used to track the crack tip, only the discontinuities in the field are needed and not their precise values. For the NiTi samples used in this study, the crack tip position was measured by either the CCI or the in-plane strain perpendicular to the crack path, ε yy , whichever provided the clearest discontinuity at the crack tip. For high stress intensity factors (ΔK) during fatigue precracking, the CCI was used because the high strains (process zone) around the crack tip blurred the discontinuity. For low stress intensity factors, the discontinuity from the correlation residual was not large enough to reliably track the crack tip, and the false strains from the separating crack faces (ε yy ) were used instead. The threshold ranges for crack tip detection were 5 × 10⁻³ to 15 × 10−3 px for CCI, and 0.4–0.8% for ε yy .
C. SEM-DIC measurements
Following the macroscopic fatigue measurements (just described), each sample was subjected to a single high ΔK loading cycle during which crack opening displacements were measured at the microscale by SEM-DIC. Measurements were performed with an FEI Teneo SEM (FEI, Hillsboro, Oregon) equipped with an in situ mechanical testing stage (Kammrath & Weiss 5 kN tension/compression module, Kammrath & Weiss, Dortmund, Germany) and a custom, high-precision external scan controller to lower the SEM-DIC error. Scanning was controlled by a C++ script running a digital-to-analog converter (DAC; National Instruments, Austin, Texas; NI USB-6251). The output voltage of the DAC board was connected to the input of a pair of analog amplifiers in the SEM, which controlled the SEM scan coils. The secondary electron detector’s analog voltage signal was then fed back as an input to the DAC board and was recorded for each image.
The external scan controller provided acceptably low SEM-DIC errors, without the spatial and drift distortion corrections that are normally required for high-magnification SEM-DIC.
Reference Sutton, Li, Joy, Reynolds and Li32,Reference Kammers and Daly34
Before each experiment, the baseline noise and error measurements were performed using static and translated images captured away from the crack tip. Each image had an HFW of 200 µm (6400 px). Static SEM-DIC images (no sample displacement) captured drift distortion and noise errors, while translated images captured spatial distortion and noise errors.
Reference Sutton, Li, Joy, Reynolds and Li32
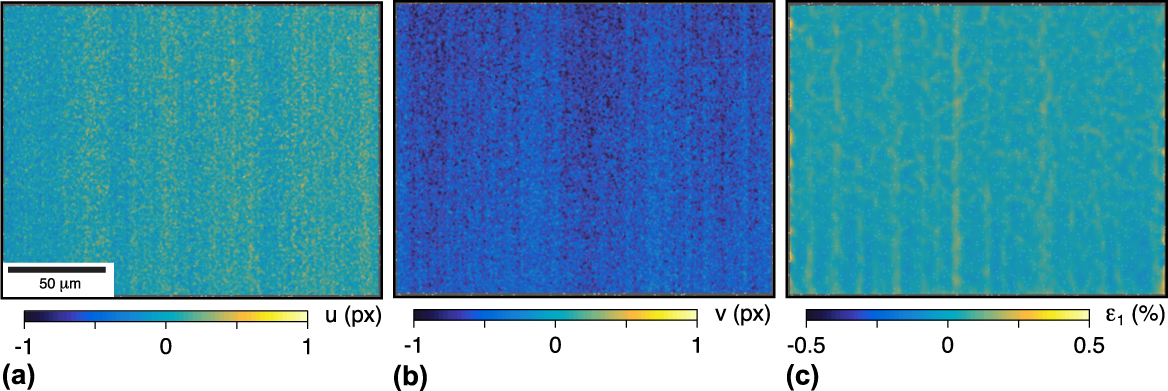
The noise in the displacements (u, v) and the major principal strain ε1 from a representative set (the 80 nm GS sample) is provided in Fig. 1, showing small but noticeable image shift errors. Averaging over all five sets (one for each GS) of static images, the false
 $\bar{u} = 0.21 \pm 0.74\;{\rm{px}} = 0.007 \pm 0.023\;\mu {\rm{m}}$
(mean ± standard deviation) and the false
 $\bar{v} = - 0.19 \pm 0.31\;{\rm{px}} = - 0.006 \pm 0.010\;\mu {\rm{m}}$
. The translated images were captured with a sample displacement of u = 10 μm (5% of the HFW), resulting in average false
 ${\bar{\varepsilon }_1} = 0.021 \pm 0.007\%$
and standard deviations
 $\overline {\Delta u} = 0.32\;{\rm{px}} = 0.010\;\mu {\rm{m}}$
and
 $\overline {\Delta v} = 0.44\;{\rm{px}} = 0.014\;\mu {\rm{m}}$
. These displacement errors in terms of pixel units are somewhat larger than desired, but are still small in μm, and quite satisfactory considering the typical values (several microns) measured in this study. For comparison, baseline measurements from a recent SEM-DIC study
Reference Guo, Sutton, Li, Li, Wang and Rajan46
with very low SEM-DIC errors after drift and distortion corrections had standard deviations of
 $\overline {\Delta u} = 0.023\;{\rm{px}} = 1.3\;{\rm{nm}}$
(for their 57 µm, 1024 px HFW) and
 ${\overline {\Delta \varepsilon } _{xx}} = 0.020\%$
after translation (although these values excluded the image edges that had larger error values
Reference Sutton47
). Here, the
 $\overline {\Delta u}$
and
 $\overline {\Delta v}$
noise levels correspond to 10 and 14 nm (0.1% and 0.14% of the 10 µm translation), larger than theirs but acceptable for our purposes. Our average false horizontal strain was
 ${\overline {\Delta \varepsilon } _{xx}} = - 0.005 \pm 0.015\%$
, which is comparable to theirs.
A representative set of baseline SEM-DIC images is shown: (a, b) false horizontal and vertical displacements (u, v) by static image pairs; and (c) false major principal strain ε1 by rigid translation of the sample. The vertical streaks are sub-pixel image shift errors, yet the errors from drift, spatial distortions, noise, and scanning shifts are low relative to the strains and displacements from the crack tip measurements (shown in Figs. 6 and 7). For this set, the respective means and standard deviations are u = −0.05 ± 0.11 px (−0.002 ± 0.004 μm), v = −0.59 ± 0.11 px (−0.018 ± 0.004 μm), and ε1 = 0.024 ± 0.037%.

During quasistatic loading of the samples, force P readings were monitored and the loading was periodically paused to image the crack tip vicinity. After waiting about five minutes for the sample to stress relax, secondary electron images were captured at 5 µs/px dwell time, giving a total scan time per image of about 4 min. No line or image averages or integrations were performed. The SEM images were correlated using Vic2D 6 commercial DIC software (Correlated Solutions, Inc., Irmo, South Carolina) with a 15 px step size, yielding about 140,000 DIC data points per image. The correlation used low-pass filtering, Gaussian subset weights, eight-tap interpolation, and the normalized squared differences method, with 0.02 px consistency threshold, 0.05 px maximum confidence interval, and 0.1 px matchability threshold.
Only one fatigue loading cycle was executed on each sample for the in situ SEM-DIC crack opening displacement measurements. The maximum force applied to each sample during testing was adjusted to account for specimen variations (slight differences in fatigue precrack lengths and sample thicknesses due to polishing) to produce a consistent maximum stress intensity factor K
max = 8.0 ± 0.1
 ${\rm{MPa}}\sqrt {\rm{m}}$
. The reference image for each experiment was taken at the minimum stress intensity factor K
min = 0.8
 ${\rm{MPa}}\sqrt {\rm{m}}$
, following Ref. Reference O’Connor, Nowell and Dragnevski25. Images were captured in 0.8
 ${\rm{MPa}}\sqrt {\rm{m}}$
increments during loading to K
max, giving a total of 10 SEM-DIC images (including reference image) for each sample.
The relative crack displacements Δv were measured similar to the approach in Ref. Reference O’Connor, Nowell and Dragnevski25, although no standard method exists for this new SEM-DIC technique. Since there is a discontinuity in the displacement field across a crack and since DIC has a finite step size and subset size, a small region next to each crack face is unmeasurable. Therefore, crack opening measurements were taken at an offset distance (y 0 = ±10 µm) on either side. The origin (x = y = 0) was defined at the crack tip, with x > 0 in front of the crack and y pointing normal to it. The relative displacements were taken as Δv(x) = v(x, y 0) − v(x, −y 0). The crack tip opening displacement (CTOD) is then Δv(0), when measured across the crack tip. The crack opening level, or the stress intensity at which the crack faces open (K open), is indicated by Δv(0) > 0.
The crack length difference between front and back faces of the sample was verified to be within the ASTM E647 21 criterion of 25% of the thickness. Between the two faces of the samples, the difference between the crack lengths averaged 140 µm for the five samples. The largest discrepancy was in the 1500 nm GS sample, where the crack length difference was 200 µm, or 21% of the thickness. The crack length for the stress intensity calculation was measured by an optical microscope on the same sample face that was imaged for SEM-DIC.
D. Macroscale fatigue measurements at low ΔK
After the SEM-DIC experiment described above, each sample was again cyclically loaded with the LM1 ElectroForce system (TA Instruments, New Castle, Delaware), but cycling at 50 Hz and at a lower ΔK to probe the fatigue thresholds and low ΔK crack growth rates. To determine the fatigue threshold ΔK th, the stress intensity factor range ΔK (with R = 0.1) was decreased incrementally until the crack growth rate was below one Angstrom (10−10 m) per cycle, as measured over the span of at least 250,000 cycles. Upon reaching ΔK th, the minimum and maximum cyclic forces were held fixed until the crack had propagated from a precrack length of a ≈ 10.0 mm (2.0 mm from the 8.0 mm notch) to a final length of a ≈ 14–15 mm (the edge of the DIC FOV).
III. RESULTS AND DISCUSSION
Experimental results are presented and discussed below to quantify the fatigue behavior of the five GS samples and explore their trends. The experimental program subjected each sample to a three stage procedure: (i) high stress intensity fatigue loading for thousands of cycles with optical DIC measurements; (ii) one high stress intensity loading cycle with SEM-DIC measurements; and (iii) low stress intensity fatigue loading for hundreds of thousands of cycles with optical DIC. Microstructural observations of the samples are first provided to characterize the material (Sec. III.A). Both sets of macroscale fatigue results, (i) and (iii), are presented together (Sec. III.B). SEM-DIC results (ii) of microscale crack opening displacements are then discussed (Sec. III.C), followed by postmortem fractography results (Sec. III.D).
A. Microstructure
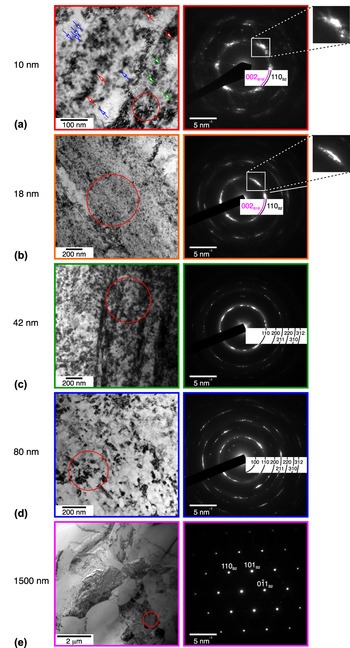
In the as-rolled sheet without any subsequent heat treatment (10 nm GS), severe plastic deformation from a 42% thickness reduction during cold rolling generated significant texture, defects, and residual martensite. High-resolution transmission electron microscopy (HRTEM) imaging of the as-rolled (10 nm GS) sample in Fig. 2(a) revealed austenite nanocrystals (blue arrows) with a high density of defects and lattice strains (red arrows). Residual martensite (also known as retained or deformation-induced martensite), as evident from the twin lamellae of martensite (green arrows), existed heterogeneously in the as-rolled sheet. An important consequence of residual martensite is that the material may exhibit significant in-plane anisotropy, both in the mechanical response Reference Sedlak, Frost, Kruisova, Hivrmanova, Heller and Sittner48 and thermal expansion, Reference Ahadi, Matsushita, Sawaguchi, Schaffer, Sun and Tsuchiya49 due to martensite’s low (monoclinic) crystal symmetry. Interestingly, the volume fraction of residual martensite varies nonmonotonically with the amount of cold rolling, with a maximum near 20% thickness reduction, beyond which the residual martensite fragments. Reference Li, Li, Liu, Ren, Chen, Yao and Mei50 The corresponding selected-area electron diffraction (SAED) pattern, taken from the red circle area in Fig. 2(a), shows the existence of weak satellites belonging to martensite 002B19′ just within the ring of the main 110B2 spots. From a previous study Reference Ahadi, Matsushita, Sawaguchi, Schaffer, Sun and Tsuchiya49 with the same material and processing used here, the sample with 42% cold rolling had complete γ-fiber {111}〈uvw〉 in the surface normal direction and a relatively weak α-fiber {331}〈110〉 texture component in the rolling direction. In that study, the volume fraction of residual martensite in the as-rolled sample was estimated to be about 25% from chi-scan XRD rotations.
HRTEM and SAED patterns are shown for each grain size: (a) 10 nm, (b) 18 nm, (c) 42 nm, (d) 80 nm, and (e) 1500 nm.

The 18 nm GS also exhibited residual martensite, but only about half as much as the 10 nm GS. The 18 nm sample was annealed at 250 °C and underwent slight grain growth from the as-rolled condition. The diffraction pattern of the 18 nm sample still exhibited residual martensite, as inferred from the extra ring near the 110B2 in the SAED pattern of Fig. 2(b). Previous work measured the volume fraction of residual martensite for the 18 nm condition to be 11%. Reference Ahadi, Matsushita, Sawaguchi, Schaffer, Sun and Tsuchiya49
All other GS samples showed no evidence of residual martensite. The 42 nm sample was annealed at 520 °C for two minutes and was fully austenitic at room temperature, as shown by the distinct 110B2 ring and spots in Fig. 2(c). Further annealing continued to grow the grains, with 600 °C for 6 min yielding 80 nm GS and 600 °C for 45 min yielding 1500 nm GS. The 1500 nm GS sample had relatively coarse austenite grains, with the diffraction from one grain shown in Fig. 2(e).
B. Macroscale fatigue responses
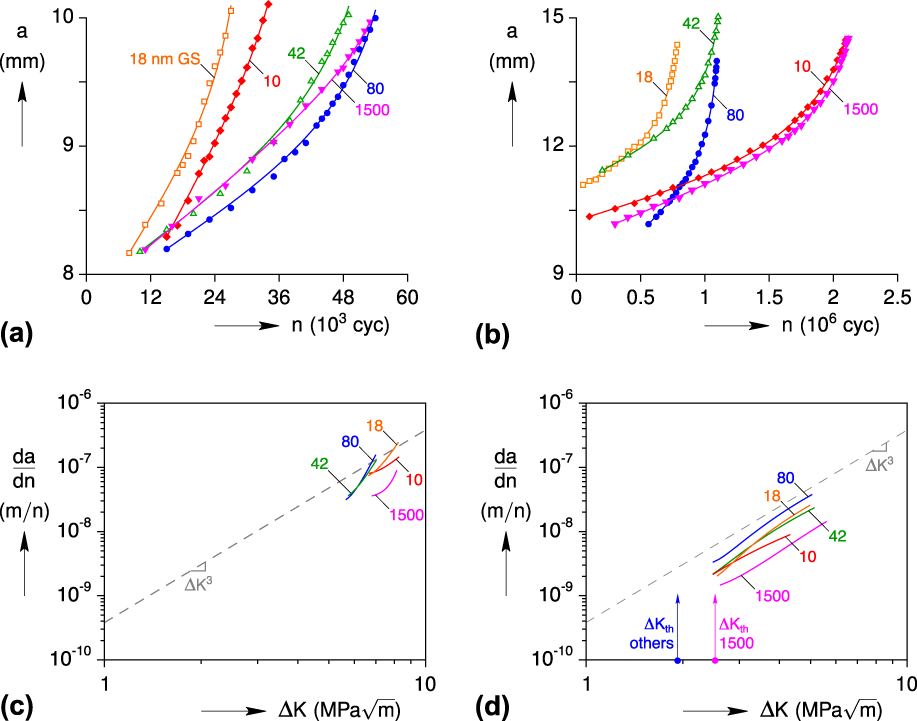
Macroscopic crack length (a) versus cycle (n) results for all five GS samples are summarized in Figs. 3(a) and 3(b) for high ΔK and low ΔK, respectively, showing typical exponential-like growth trends for each sample but irregular trends across the grain sizes. We discovered a simple, three-parameter function to fit the data in Figs. 3(a) and 3(b) (shown by the curved lines). The function has the form
 $$a\left( {\tilde{n}} \right) = A\tilde{n} + B{\tanh ^{ - 1}}\left[ {C\tilde{n}} \right]\quad ,$$
where {A, B, C} are fitting constants, and
 $\tilde{n}$
is a normalized cycle variable according to
 $$\tilde{n} = {{\left( {n - {n_0}} \right)} / {{n_{\rm{f}}}}}\quad .$$
Macroscopic crack lengths a in the five compact tension samples were measured by 3-D DIC during cycling n at (a) high ΔK then (b) low ΔK. Data points were fitted with an inverse hyperbolic tangent function (lines), which were used to generate respective growth rate da/dn curves shown in (c) and (d). The dashed gray lines denote a Paris Law exponent of m = 3. At both low and high ΔK, the 1500 nm GS sample had the lowest crack growth rates, and the 80 nm sample had the highest crack growth rates (although the 42 nm sample was quite close at high ΔK).

It is well known that obtaining accurate rate information from noisy experimental data is problematic, so some form of filtering or fitting of the data is usually needed before taking any derivatives. ASTM E647 21 proposes an incremental polynomial method to provide better da/dn results than taking differences of successive data points. Equation (2) fits the crack growth data quite nicely over all cycles, without the need for “sliding polynomial” domain shifting. All of the fits shown in Fig. 3(a) (high ΔK) and Fig. 3(b) (low ΔK) had coefficients of determination R 2 ≥ 0.9920 and R 2 ≥ 0.9992, respectively. These functions were subsequently used to generate smooth da/dn curves.
The corresponding crack growth rate (da/dn) versus ΔK curves [Figs. 3(c) and 3(d)] shows a complicated ordering with respect to the grain size. For reference, the dashed gray line shows the Paris Law with an exponent of m = 3, which aligns reasonably well with the slopes of the rate curves at low ΔK in Fig. 3(d). For both low and high ΔK experiments, the 1500 nm GS sample exhibited the slowest crack growth, and the 80 nm GS sample exhibited the fastest. At high ΔK, the apparent ordering with increasing crack growth rates was {1500, 10, 18, 42, 80} nm GS, based on where the curves overlapped at a common ΔK. At low ΔK, the ordering was {1500, 10, 42, 18, 80} nm. For high ΔK, the FCG rates of the 10 and 18 nm samples were slightly lower than those of the 42 and 80 nm samples. These differences may be due to the presence of residual martensite in the 10 and 18 nm conditions, about 25% and 11% volume fractions, Reference Ahadi, Matsushita, Sawaguchi, Schaffer, Sun and Tsuchiya49 respectively. The slight improvement in the high ΔK regime for the 10 nm GS agrees with recent total-life fatigue results Reference Yin, He, Moumni and Sun17 of the tensile bars of NC NiTi, although no differences were observed in the moderate-cycle fatigue life among the 10, 42, and 80 nm GS samples.
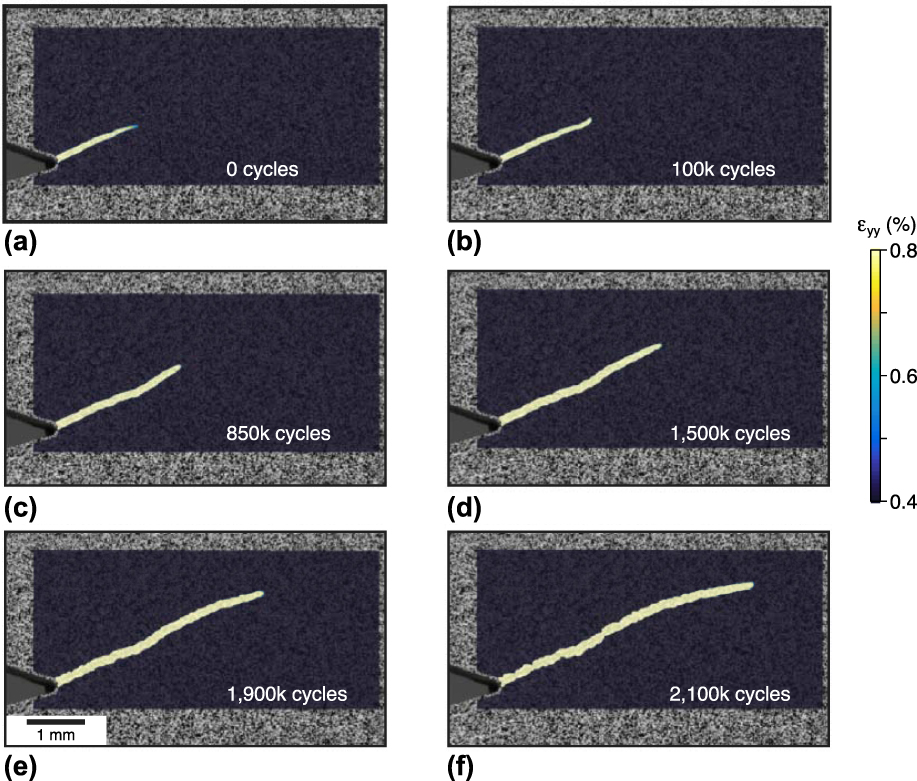
Fatigue cracks all grew in the expected (mode I) x-direction, perpendicular to the loading axis, except for the 10 nm GS sample. The 10 nm GS sample exhibited a macroscopic crack path at an oblique angle (Fig. 4), and since this created a mixed mode I (opening) and mode II (sliding) condition, its interpretation is less clear. In this case, the crack length a was measured along the oblique crack path, underscoring the importance of using spatially resolved techniques to track crack growth. The source of the anomalous crack path may be due to one or both of the following reasons. First, it may be related to a positive ‘T-stress’ σ xx , which is known to promote crack path instability. Reference Gupta, Alderliesten and Benedictus51 While a small amount of ε xx was detected near the crack tip, the difference between the ε xx fields of the 10 and 18 nm GS samples was negligible. Second, it may be due to a strong crystallographic texture in the 10 nm GS that directed the crack along a path of lower resistance. This type of unexpected crack path has been observed in NiTi before, in experiments on compact tension samples produced from NiTi tube, Reference Robertson and Ritchie2 where the notches in compact tension samples were oriented in three different directions with respect to the tube axis: longitudinal, circumferential, and 45°. The samples with longitudinal and 45° notches exhibited crack paths in the expected mode I direction, but the circumferential samples exhibited crack paths that were angled about 25° from the notch. Previous measurements on the NiTi tube Reference Robertson, Gong and Ritchie52 and sheet Reference Gao and Yi53 have also shown that phase transformation is most easily activated when the tensile axis is 45° with respect to the drawing direction.
In the 10 nm GS sample, the crack grew at an oblique angle during both high and low ΔK cracking (shown here in the low ΔK stage), deviating from the expected mode I path perpendicular to the tensile axis. Its crack length a was measured along the crack path, and the sample was subjected to mixed mode I and mode II fatigue, thereby obscuring a direct comparison to the other grain sizes in Figs. 3(a) and 3(b).

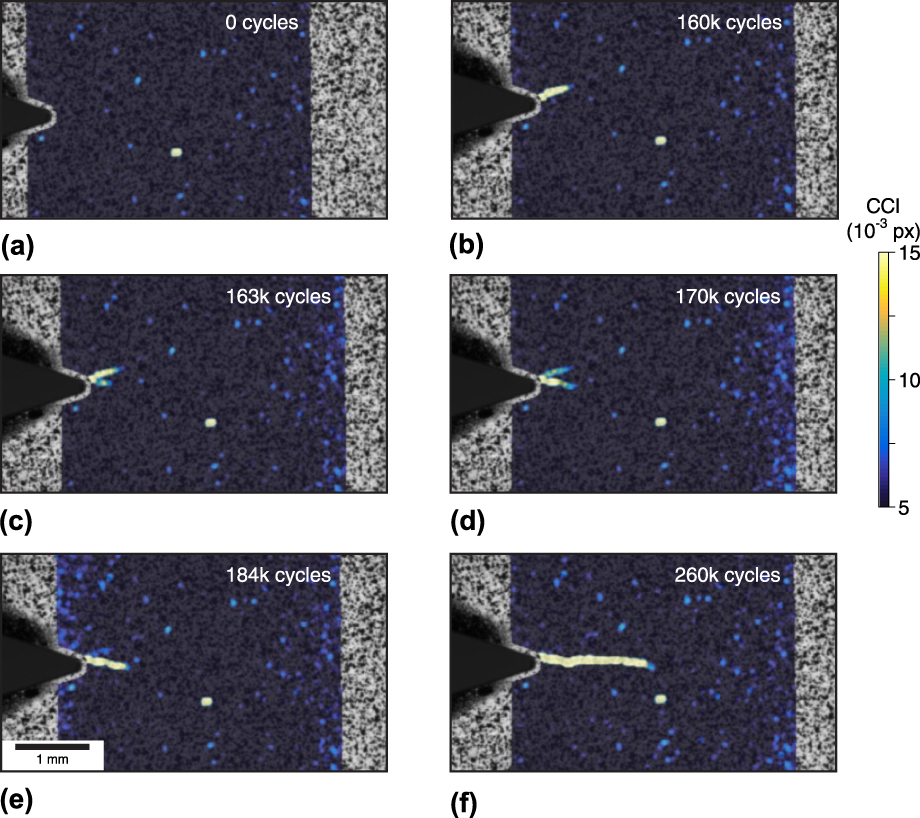
Crack branching was observed in the 1500 nm GS, presenting another challenge in characterizing fatigue behavior. This occurred at both microscopic (not shown) and macroscopic length scales (Fig. 5). More than 100,000 cycles were necessary to initiate the first crack, yet within about 24,000 cycles, this crack arrested and a second crack grew that dominated the failure process during the remainder of the 260,000 total cycles (Fig. 5). DIC captured this bifurcation, which likely would have been missed by indirect crack growth measurements that would not distinguish one stagnating crack from a second growing crack. In fact, crack branching was observed in another sample with 120 nm GS, which was so extensive that it was removed from the data set here (see Supplementary Material Fig. S4). It had multiple secondary cracks extending laterally from the nominal crack path, which prohibited measuring the relative crack displacements (Δv). Similar crack branching was observed in a 1500 nm GS sample, but not in the FOV used for the Δv measurements presented below.
Correlation confidence interval (CCI) fields in the 1500 nm GS sample at selected instances during the high ΔK stage of cycling show early crack branching. (a) The high CCI spot near the middle of each image should be ignored, likely due to the dust on the camera lens observed before cracking. (b) Initially, a crack developed at a positive angle from the notch root. (c) With further cycling, a second crack formed at a negative angle from the notch, and the first crack stopped. (d, e) Subsequently, the second crack continued to grow, while the CCI signal of the first crack progressively faded. (f) The second crack grew further along the x-direction, and the first crack was no longer detectable via CCI since it had completely closed.

The threshold stress intensities ΔK
th of the NC NiTi samples in this work are somewhat smaller than average, but within the expected range, for coarse-grained NiTi. The fatigue threshold for superelastic NiTi with R = 0.1 has an average reported value of ΔK
th ≈ 2.8 ± 1.3
 ${\rm{MPa}}\sqrt {\rm{m}}$
, from aggregated measurements of several experimental studies compiled in a review.
Reference Robertson, Pelton and Ritchie1
Here, the 1500 nm GS sample had a fatigue threshold ΔK
th = 2.4
 ${\rm{MPa}}\sqrt {\rm{m}}$
, while the 10, 18, 42, and 80 nm GS samples all had a ΔK
th = 1.9
 ${\rm{MPa}}\sqrt {\rm{m}}$
.
Similar to other intermetallic alloys, NiTi’s fatigue threshold decreases with increasing the stress intensity ratio R, meaning that FCG rates depend on both ΔK and ΔK
max. Robertson and Ritchie
Reference Robertson and Ritchie2
measured a decrease of ΔK
th from 2.48
 ${\rm{MPa}}\sqrt {\rm{m}}$
for R = 0.1, down to 1.15
 ${\rm{MPa}}\sqrt {\rm{m}}$
for R = 0.7. They proposed that this decrease in ΔK
th with increasing R was associated with crack closure mechanisms, and their SEM images of tortuous crack paths and microcracks supported this hypothesis.
C. Microscale fatigue responses
Between the macroscopic fatigue measurements just described, each sample was subjected to one additional loading cycle at high K
max = 8.0
 ${\rm{MPa}}\sqrt {\rm{m}}$
and imaged at the microscale by SEM-DIC. The major principal strain (ε1) fields near the crack tip in each sample at K
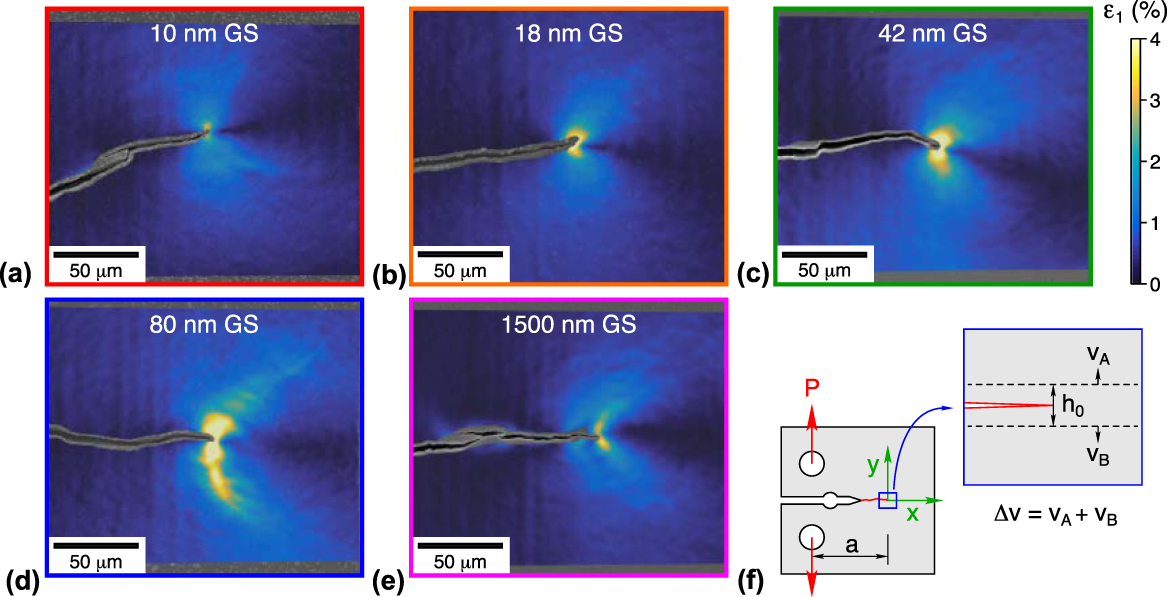
max are provided in Fig. 6. With increasing GS from 10 to 80 nm, the strain fields exhibited a progressive broadening of process zones (high strain regions) around the crack tip. However, this trend was reversed in the 1500 nm sample that had a small process zone size, between the 10 and 18 nm cases. The 42 and 80 nm samples had large regions of high strain (ε1 ≈ 4%) roughly ≥10 µm around the crack tip, while the 10, 18, and 1500 nm samples had relatively small regions of high strain, <5 µm around the crack tip. This trend is unexpected, as previous measurements of fracture in NC NiTi demonstrated a monotonically decreasing fracture toughness K
IC with decreasing the GS.
Reference Ahadi and Sun16
Fracture toughness, therefore, does not seem to correlate directly to the fatigue behavior (crack growth and crack opening response) in NC NiTi.
Microscale measurements of major principal strain fields ε1(x, y) from SEM-DIC are shown at the peak stress intensity K max during a single fatigue cycle (performed between high ΔK and low ΔK measurements shown in Fig. 3). Smaller regions of high major principal strain (ε1 ≈ 4%) are observed around the crack tip for the 10, 18, and 1500 nm GS samples (a, b, e) than in the 42 and 80 nm samples (c, d), and the 1500 nm sample (e) exhibits the most microcracking. (f) The origin of coordinate axes (as used in Fig. 7) is placed at the crack tip with positive x in the cracking direction. The relative crack displacement Δv indicates the elongation between the two lines symmetrically offset about the crack by h 0 = 20 µm.

One can observe in Fig. 6 that the cracks in the 10 and 1500 nm samples actually consisted of multiple microcracks. While the 18 and 42 nm samples did not show evidence of microcracks (at least within this FOV), the cracks do show occasional slight kinks along their length. Only the 80 nm sample exhibited a smooth and continuous crack. Again, recall that the crack did not grow perpendicular to the loading axis in the 10 nm sample, making it a mixed mode fracture case and thus an outlier to the other cases.
The strain state around the crack tip exhibited unequal biaxial strain, with the minor principle strain (not shown) generally close to negative values of the major principle strain, ε2 ≈ −ε1, for all grain sizes. This indicates that large in-plane shear strains were present.
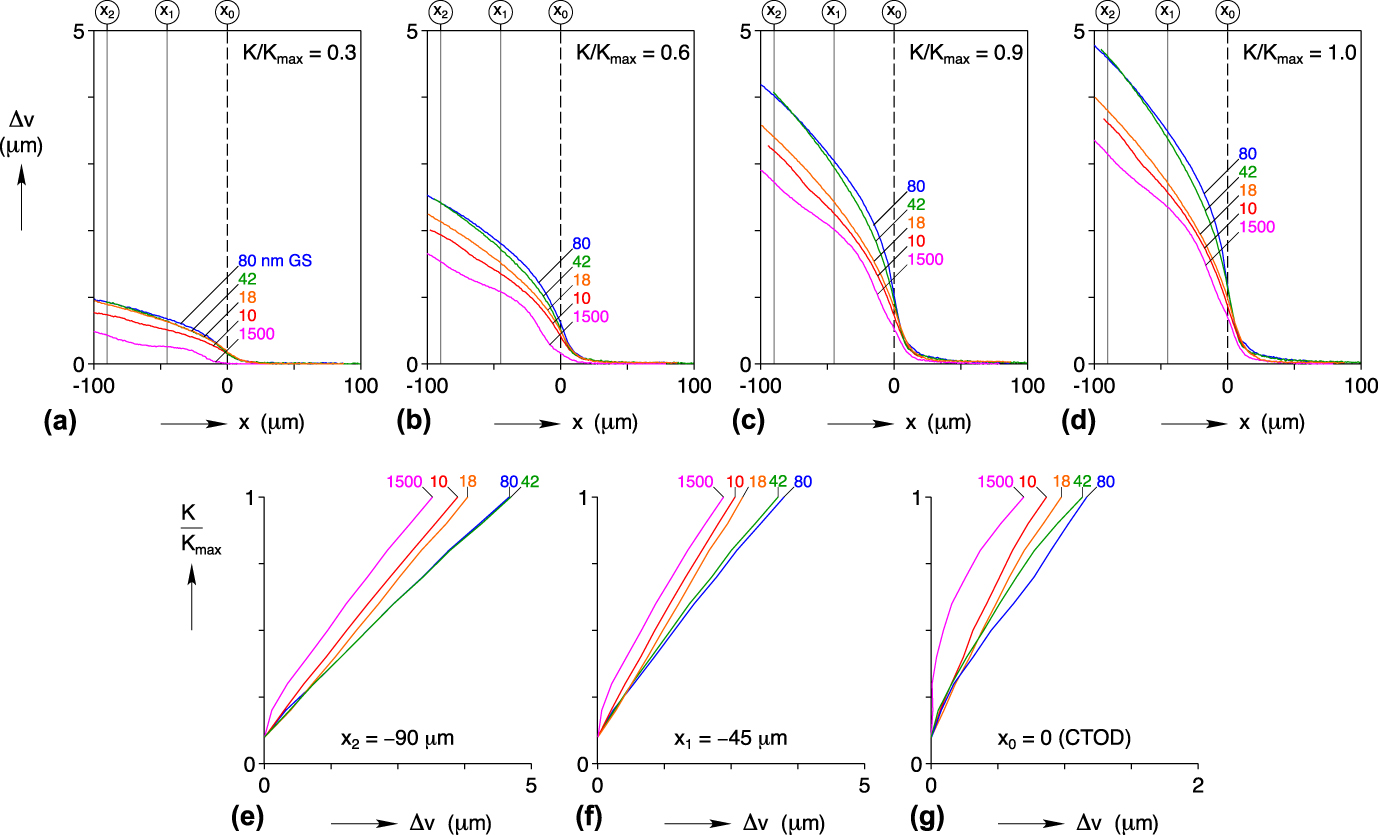
A nonmonotonic GS dependence was also observed in the relative crack displacement profiles Δv(x) shown in Figs. 7(a)–7(d), and the stress intensity responses with respect to relative crack displacements are shown in Figs. 7(e)–7(g). The 1500 nm sample consistently exhibited the lowest Δv. It also exhibited a bump in the Δv profile at about 30 µm behind the crack tip that corresponded to a small branched crack (only visible upon very close inspection) in the SEM-DIC images (Fig. 6). The 10 and 18 nm samples had the next lowest Δv after the 1500 nm sample. At 90 µm behind the crack tip, the 10 nm sample generally had about 0.1 µm lower Δv than the 18 nm sample. The 42 and 80 nm samples had the highest and nearly coincident Δv profiles, with only a slightly higher Δv in the 80 nm sample just behind the crack tip (−45 μm < x < 0). This small difference is also apparent in the CTOD responses shown in Fig. 7(g). Given the irregular ranking among the grain sizes, however, the Δv(x) profiles generally grew during loading in a self-similar manner [Figs. 7(a)–7(d)].
In situ SEM-DIC (Fig. 6) enabled crack opening responses to be characterized at the microscale, including (a–d) relative crack displacement profiles Δv(x) at selected stress intensities and (e–g) stress intensity response curves at selected positions. For clarity, the x-axis scale for (g) is magnified compared to (e) and (f). The 1500 nm GS sample consistently exhibited the smallest Δv profile (a–d) and the largest crack opening level (K open/K max between 30 and 40%) at Δv = 0 (e–g).

The elevated crack opening level at v(0) = 0, shown in Figs. 7(e)–7(g) in the 1500 nm GS (K
open/K
max of 30–40%) versus the others (K
open/K
max < 10%) is consistent with the higher fatigue threshold noted previously (ΔK
th = 2.4
 ${\rm{MPa}}\sqrt {\rm{m}}$
for the 1500 nm GS and ΔK
th = 1.9
 ${\rm{MPa}}\sqrt {\rm{m}}$
for the others). Interestingly, however, the 10 and 18 nm samples exhibited smaller Δv [nearly 20% smaller at K
max in Fig. 7(e)] than the 42 and 80 nm samples, yet all had the same crack opening level.
In attempting to explain the reasons for the irregular dependence on GS in the FCG results (Fig. 3) and the microscale deformation results (Fig. 7), we note that the Young’s modulus of cold-rolled NC NiTi is known to depend on GS in a nonmonotonic way. Reference Xia, Liu and Sun54 Table I shows that a minimum exists in the austenite modulus (E A = 39 GPa) at intermediate grain sizes near 48–60 nm. Although not listed in the table, coarse-grained NiTi has an even larger Young’s modulus, typically E A > 60 GPa. Reference Kim and Daly55 The cases (1500 and 10 nm) that had slow crack growths and small crack opening displacements have relatively large Young’s moduli (E A = 50 to ≈65 GPa), while the intermediate GS samples that had faster crack growths and larger crack opening displacements have smaller Young’s moduli. The crack opening displacement data showed that the 80 nm GS sample had the largest Δv, although it was quite close to that of the 42 nm GS sample. While the correlation with elastic modulus is suggestive, we cannot conclusively say that the variations in elastic modulus are directly responsible for the trends in our fatigue results. The defect density increases monotonically with the decreasing grain size, yet the amount of residual martensite increases with the decreasing GS and only exists in the smallest two GS samples. Perhaps, these competing factors are responsible for both nonmonotonic trends in elastic modulus and fatigue performance, meaning both may be manifestations of the same microstructural factors.
The Young’s modulus (rolling direction) of nominally austenite NiTi has a nonmonotonic relationship with GS (data from Ref. Reference Xia, Liu and Sun54).

Other complications exist in the superelastic behavior of NiTi that warrant mentioning. First, the macroscopic uniaxial tension behavior of coarse-grained NiTi exhibits unstable phase transformation that manifests as a nucleation peak near the onset, accompanied by strain (and phase) localization. This is followed by a stress plateau, during which transformation fronts (near discontinuities in strain) propagate along the length of the test sample. In other words, the strain field exhibits Lüders-like bands during phase transformation. These phenomena have been extensively studied in NiTi (see, e.g., Refs. Reference Shaw and Kyriakides9, Reference Shaw and Kyriakides10, Reference Chang, Shaw and Iadicola12, Reference Feng and Sun56, and Reference Daly, Ravichandran and Bhattacharya57), and the important conclusion is that the apparent uniaxial response is a ‘structural’ response, not a local stress–strain response at a material ‘point’, since the strain field is not uniform during the test. In fact, the actual stress–strain relationship has an up-down-up character, although a special setup that suppresses strain localization is needed to reveal it. Reference Hallai and Kyriakides58 The strong strain (and stress) gradients in the vicinity of a crack also likely suppress any such instabilities, and macroscopic phase fronts are not observed in fracture and fatigue experiments. One must be cautious in using uniaxial data to interpret structures with more complex stress fields. Nevertheless, we note that macroscopic uniaxial responses of NC NiTi [see Fig. 2(a) in Ref. Reference Ahadi and Sun37] demonstrate a gradual progression with decreasing GS, from superelastic responses that exhibit distinct stress plateaus (1500 nm, 80 nm GS) to those that maintain a positive and successively larger tangent modulus (64 nm down to 10 nm GS) during phase transformation. This at least points to an increasing resistance to phase growth and an overall stabilizing effect on the mechanical behavior with grain refinement.
Second, phase transformation in NiTi involves enthalpy changes in the sample that can produce unusual sensitivities to loading rates. This is caused by a combination of interrelated factors: latent heat being released (or absorbed) during phase transformation, the strong thermomechanical coupling of transformation stresses (Clausius–Clapeyron relation), and the vagaries of the heat transfer environment in the test setup. Reference Shaw and Kyriakides9 The overall load-unload response in (as-received) coarse-grained superelastic NiTi is a flag-shaped loop if conditions are isothermal (slow loading), yet a smoother loop with elevated transformation stresses and positive tangent moduli if conditions are adiabatic (fast loading). The strain rates that encompass these two extremes depend on the environment, thermal boundary conditions, and the size and geometry of the sample, according to heat transfer scaling laws. In stagnant room air with millimeter scale specimens, the transition between these two extremes occurs at strain rates between 10−5/s to 10−2/s, Reference Chang, Shaw and Iadicola12 a range normally considered quasi static for the testing of conventional metals. For NC NiTi, however, the enthalpy change, stress hysteresis, and Clausius–Clapeyron slope have been shown to decrease monotonically to almost zero with grain refinement from 1500 to 10 nm, Reference Ahadi and Sun37 meaning that the overall thermomechanical coupling and rate effects are greatly diminished with decreasing the GS. The macroscopic fatigue measurements involved relatively fast loading rates (10 Hz for high ΔK and 50 Hz for low ΔK), probably near adiabatic conditions; whereas, the microscopic measurements here were performed slowly, allowing the sample to stress relax and reach thermal equilibrium (isothermal conditions). Thus, one should recognize that any differences in the loading rate may be important for the larger GSs but not for the smaller GSs.
D. Fracture surfaces
SEM fractography revealed a distinctly rougher failure surface in the 1500 nm sample compared to the other grain sizes (Fig. 8). The rougher fatigue fracture surface for the 1500 nm sample can promote crack closure, Reference Suresh and Ritchie59 which is consistent with the 1500 nm sample’s larger crack opening level (K open) compared to the other samples. The 1500 nm sample also exhibited small pockets of smooth fracture surfaces that were not observed in the other grain sizes. The samples with 10, 18, 42, and 80 nm GS exhibited similar morphologies, with transgranular fatigue fracture surfaces and tear ridges in the crack growth direction. Overall, none exhibited the dimpled surfaces that one might see during tearing of more ductile metals, which is consistent with the generally low fracture and fatigue resistance of intermetallic alloys like NiTi.
SEM micrographs of fracture surfaces were captured post-mortem for the five samples at a = 9.5 mm, corresponding to prior cracking at high stress intensity ΔK ≈ 7
 ${\rm{MPa}}\sqrt {\rm{m}}$
. In general, the fatigue fracture surfaces were transgranular, and tear ridges existed in the direction of crack propagation. Surface features in the 10, 18, 42, and 80 nm samples (a–d) were similar. The 1500 nm sample (e) exhibited the most roughness, consistent with expectations from the crack growth rate and crack opening displacement measurements.

IV. SUMMARY AND CONCLUSIONS
For the first time, the structural fatigue behavior of NC NiTi was characterized at low and high stress intensities, at the millimeter and micron length scales, and for test samples with average grain sizes of 10, 18, 42, 80, and 1500 nm, with the following major results.
-
(i) High-resolution SEM-DIC, using a novel external scan controller, largely eliminated pernicious drift, distortion, and scanning errors that otherwise require lengthy scan times (line or image averaging) and/or extensive corrections during image postprocessing to achieve accurate results.
-
(ii) Crack paths and deformation fields were measured in situ during fatigue cycling at both the macroscale (by optical 3D-DIC) and microscale (by SEM-DIC) to connect the fatigue responses at disparate length scales. Optical DIC allowed crack growth to be accurately tracked, occasionally detecting anomalies in crack growth (crack branching in the 1500 nm GS sample and an oblique crack path in the 10 nm GS sample) as well as providing details of the strain field around the crack. SEM-DIC allowed displacement and strain fields to be examined in the local vicinity of the crack tip.
-
(iii) Macroscopic fatigue performance correlated well with the microscopic observations. The grain sizes with relatively fast macroscopic crack growth rates exhibited relatively large crack displacements at the microscale and vice versa.
-
(iv) The sample with the largest GS studied (1500 nm) exhibited the slowest crack growth rates and the largest threshold stress intensity at the macroscale, while exhibiting the minimum crack opening displacements, the largest crack opening stress intensity level, and the roughest fracture surfaces at the microscale. The sample with an intermediate GS (80 nm) generally exhibited the fastest crack growth rates and the largest crack opening displacements.
-
(v) The structural fatigue behavior measured here did not follow the monotonic fracture trends previously reported on similar NC NiTi. The remarkable functional fatigue resistance previously reported for the smallest GS samples (10 and 18 nm) also was not reflected in the improved structural fatigue behavior (especially at low stress intensity). Trends in fatigue behavior among the grain sizes were nonmonotonic, and the cause is as yet unknown. Various underlying mechanisms, including the presence of residual martensite (only in the 10 and 18 nm GS samples) and previously observed nonmonotonic trends in Young’s modulus with GS, were proposed and discussed.
Supplementary Material
To view supplementary material for this article, please visit https://doi.org/10.1557/jmr.2017.395.
ACKNOWLEDGMENTS
Dr. S. Daly gratefully acknowledges financial support from the National Science Foundation (CAREER Award, CMMI-1251891). Mr. W. LePage is grateful for financial support from the U.S. Department of Defense (Air Force Office of Scientific Research, National Defense Science and Engineering Graduate, or NDSEG, Fellowship program, 32 CFR 168a). Dr. A. Ahadi is grateful for financial support from the International Center for Young Scientists (ICYS), National Institute for Materials Science (NIMS) Japan, under grant number C1052. Dr. QP Sun is grateful for financial support from the Research Grant Council of Hong Kong through GRF Project No. 16214215. We sincerely thank Dr. J. Wayne Jones, Dr. Michael Thouless, and Dr. Alan Pelton for insightful discussions, Dr. Nakhiah Goulbourne for sharing fatigue testing equipment, Dr. Zhe Chen for assistance with SEM-DIC experiments, Dr. Jerry Zhongrui Li for assistance with X-ray diffraction measurements, Mr. Benjamin Marchi for developing the function to compute the coefficients of determination (R 2) in Mathematica, Dr. Ryan Watkins for developing the DIC image overlay plotting routines, and the Michigan Center for Materials Characterization for instrument use and staff assistance.