





Driven by globalisation and convenience, global dietary patterns have been changed substantially over recent decades, mainly characterised by a decline in the consumption of unprocessed or minimally processed foods and a concomitant increase in ultra-processed foods (UPF)(Reference Baker, Machado and Santos1). In Brazil, UPF accounted for 19·7 % of total energy intake in 2017–2018, with lower consumption observed among older adults and higher intake among individuals with higher income and education levels(Reference Louzada, Cruz and Silva2).
UPF are industrial formulations made predominantly from food-derived substances that undergo intense physical, chemical and biological processing, as defined by the NOVA food classification system. They are typically ready to consume, produced by large corporations, highly profitable and designed to be hyper-palatable(Reference Monteiro, Cannon and Levy3,Reference Gupta, Hawk and Aggarwal4) . The high consumption of these products can be considered a marker of dietary quality, as they contain large amounts of sugars, Na and fats, low levels of fibre and high caloric density, all of which are associated with adverse health outcomes(Reference Gupta, Hawk and Aggarwal4).
Evidence from prospective studies consistently links UPF consumption to increased morbidity and mortality. The systematic review of eighteen cohort studies reported that higher UPF intake was associated with an approximately 15 % higher risk of all-cause mortality compared to with the lowest intake levels, with a 10 % increase in UPF consumption corresponding to a 10 % higher mortality risk(Reference Liang, Zhou and Zhang5). In addition, a review by Moradi et al. (2023), which included nine cross-sectional and three cohort studies, showed that a 10 % increase in energy intake from UPF was also associated with a 7 %, 6 % and 5 % higher risk of overweight, obesity and abdominal obesity, respectively(Reference Moradi, Entezari and Mohammadi6). Similarly, Mambrini et al. (2023) concluded that there is consistent evidence supporting an association between UPF consumption and the incidence of obesity and cardiometabolic risk factors(Reference Mambrini, Menichetti and Ravella7).
In the Brazilian population, high UPF consumption has been associated with several adverse health outcomes, including increased body fat percentage and reduced lean mass among women(Reference Rudakoff, Magalhães and Viola8), higher risk of metabolic syndrome(Reference Canhada, Vigo and Luft9), dyslipidaemia(Reference Scaranni, Cardoso and Griep10), overweight and obesity and abdominal obesity(Reference Canhada, Luft and Giatti11). Notably, it has been estimated that approximately 15 % of large increases in body weight and waist circumference (WC), as well as the incidence of overweight and obesity, in the ELSA-Brasil cohort, can be attributed to consuming more than 17·8 % of total energy from UPF(Reference Canhada, Luft and Giatti11). Furthermore, findings from this same cohort showed that higher UPF consumption was associated with an increased risk of all-cause and non-communicable disease mortality, highlighting the potential long-term health consequences of these products(Reference Silva, Giatti and Fonseca12).
Despite this consistent evidence, no previous studies have evaluated whether the maintenance or increase of UPF consumption over time is associated with changes in anthropometric measures and BMI. Moreover, investigations exploring potential differences in these associations remain scarce, despite known biological, behavioral and sociocultural differences that may influence dietary patterns, body fat distribution and metabolic responses.
Considering that dietary patterns evolve over time and the sustained changes in diet may have important health implications, the present study aimed to evaluate the association between changes in UPF consumption over 9 years of follow-up and changes in anthropometric indicators in the Brazilian Longitudinal Study of Adult Healthy (ELSA-Brasil) cohort, using sex-stratified analyses.
Method
Study design and population
This longitudinal analysis was conducted using data from the baseline (2008–2010) and the second follow-up (wave 3; 2017–2019) of ELSA-Brasil. At baseline, 15 105 active or retired employees aged 35–74 years were recruited from five public universities (University of São Paulo and the Federal Universities of Bahia, Espírito Santo, Minas Gerais and Rio Grande do Sul) and one research institution (Oswaldo Cruz Foundation). The primary objective of ELSA-Brasil is to investigate the incidence and determinants of chronic non-communicable diseases, with a particular focus on CVD and diabetes.
Participants and data collection
Detailed descriptions of the recruitment, procedures, participant selection and data collection methods of ELSA-Brasil have been published elsewhere(Reference Aquino, Araujo and Almeida13–Reference Mill, Pinto and Griep15). Briefly, participants were interviewed using standardised questionnaires to obtain information on age, sex, education level, family income, medical history, smoking status (current and former), alcohol consumption, leisure-time physical activity and dietary intake. Data collection followed rigorous standardisation procedures, including staff training, monitoring protocols and quality assurance and control measures, ensuring the reliability and validity of the collected information(Reference Schmidt, Griep and Passos16).
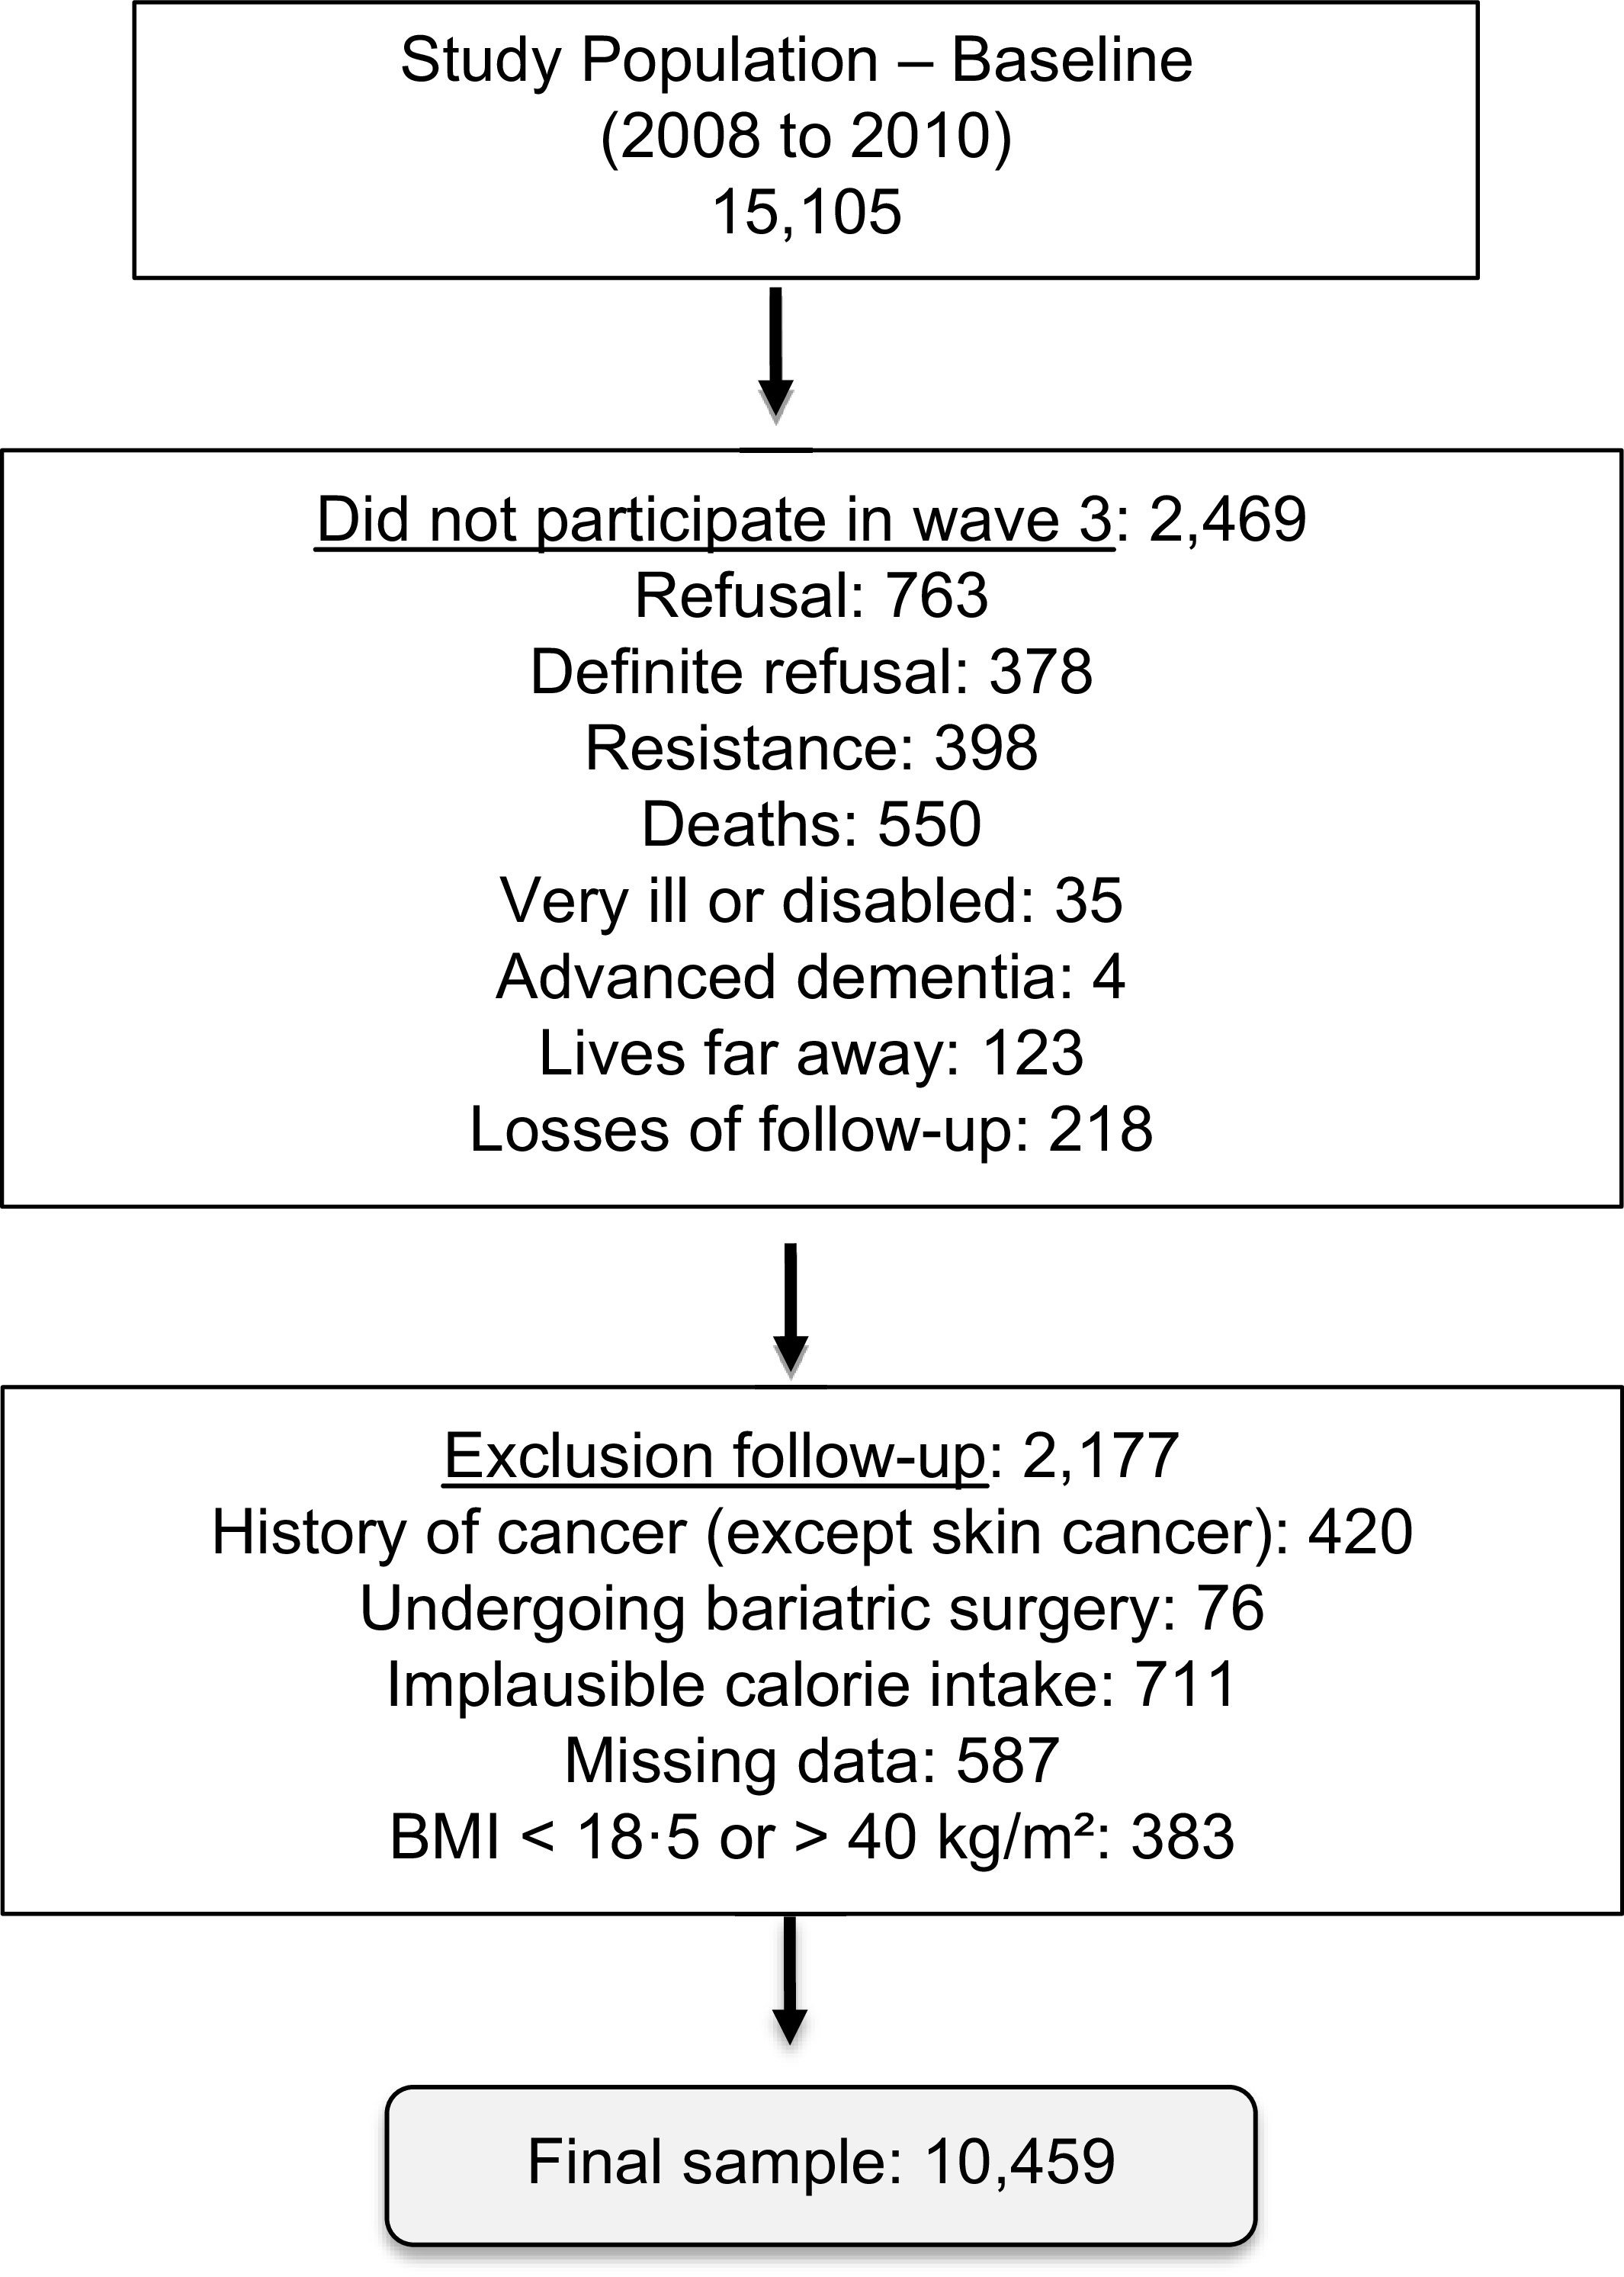
Participants were excluded if they had undergone bariatric surgery, reported a history of cancer (except non-melanoma skin cancer), presented implausible total energy intake values (<600 kcal or >4200 kcal per day for men and <500 kcal or >3600 kcal per day for women)(Reference Goldberg, Black and Jebb17) or had a BMI < 18·5 kg/m2 or >40 kg/m2, at both baseline and follow-up. Participants with missing data on exposure or outcome variables at either assessment, as well those who died or did not participate in the follow-up, were considered losses (Figure 1).
Flow chart of exclusions and losses in the studied population.

Dietary assessment
UPF consumption was estimated using the validated ELSA-Brasil FFQ, which includes seventy-six food items in the baseline and wave 3(Reference Molina, Benseñor and Cardoso18,Reference Mannato, Pereira and Velasquez-Melendez19). Originally, the ELSA-Brasil FFQ included 118 food items. However, a shortened version containing seventy-six items was subsequently developed and validated against the original instrument. Despite a reduction in the number of items, the abbreviated FFQ retained adequate performance for estimating energy and nutrient intake and was subsequently used in follow-up assessments. The ELSA-Brasil FFQ is a semi-quantitative instrument designed to assess habitual dietary intake over the previous 12 months.
For each food item, participants reported the usual frequency of consumption during the past year using eight response options: ‘more than three times a day’, ‘2–3 times a day’, ‘once a day’, ‘5–6 times a week’, ‘2–4 times a week’, ‘once a week’, ‘1–3 times a month’ and ‘never/almost never’. Information on portion size was also collected using standardised serving sizes.
The daily intake of each food item (in grams) was estimated by multiplying the number of servings consumed by the standard portion weight and the reported frequency of consumption. Nutritional composition and total energy intake were calculated using the Nutrition Data System for Research, University of Minnesota(20).
To estimate food consumption according to the degree of processing, all food items were classified into the following groups according to the NOVA food classification system: unprocessed or minimally processed foods and culinary ingredients; processed foods and UPF(Reference Monteiro, Cannon and Levy21).
UPF, expressed in grams per day (g/day), was categorised into quintiles at baseline and at the second follow-up (wave 3). Quintiles 1 and 2 were considered low consumption, quintile 3 as moderate and quintiles 4 and 5 as high consumption. To assess changes in UPF consumption over time, participants were subsequently classified into three categories: maintained low or reduced (those who remained in shifted to the low consumption category at follow-up), maintained moderate (those who remained in the moderate consumption category across waves) and maintained high or increased (those who remained in or shifted to the high consumption category at follow-up).
Alcoholic beverages were not included in the UPF exposure variable, regardless of their degree of processing. Plain water intake was not assessed by the dietary assessment instrument and, therefore, was not included in the calculation of UPF consumption expressed in grams/day.
Anthropometric measurements
Data collection
Anthropometric measurements, including body weight, height and waist circumference (WC), were obtained according to standardised procedures(Reference Lohman, Roche and Martorell22), with participants fasting and with an empty bladder. Body weight was measured with participant barefoot and wearing standardised light clothing over underwear, using an electronic scale (Toledo®, model 2096PP, Brazil) with a maximum capacity of 200 kg and precision of 50 g.
Height was measured using a wall-mounted stadiometer (Seca®) with a precision of 1 mm. Participants stood barefoot with their head, buttocks and heels in contact with the wall, eyes positioned in Frankfurt horizontal plane. Height was recorded at the end of a deep inhalation.
WC was measured using a 150 cm non-elastic measuring tape (Mabis-Gulick), positioned at the midpoint between the lower margin of the last rib and the iliac crest along the mid-axillary line. BMI was defined by calculated as body weight divided by height squared – kg/m2.
Anthropometric changes
Changes (Δ) in anthropometric measurements (body weight and WC) and BMI were calculated as the difference between values measured at the second follow-up (wave 3) and at baseline, thus representing the variation that occurred during the follow-up period.
Confounding variables
Socio-demographic, behavioural and dietary variables were collected through structured questionnaires administered at each research centre(Reference Chor, Alves and Giatti14) and were used to adjust the regression models. Sex and age were self-reported. Per capita income and education level were also collected. Education was categorised as incomplete elementary, complete elementary, complete high school and completed higher education or postgraduate degree. Smoking status was classified as ‘never smoked’, ‘former smoker’ or “current smoker.
Leisure-time physical activity was assessed using the long version of the International Physical Activity Questionnaire, validated for Brazil(Reference Matsudo, Araújo and Matsudo23), covering leisure-time and transport-related physical activity domains. The physical activity variable was recorded in minutes/week. Physical activity was recorded in minutes per week and categorised as inactive (<10 min/week), insufficiently active (10–149 min/week) and active (≥150 min/week)(Reference Pitanga, Matos and Almeida24).
Alcohol consumption was obtained via a structured questionnaire, including type of beverage (beer, wine, spirits – cachaça, vodka and whiskey), frequency (daily, weekly and monthly) and amount in ml/day. Standard drink equivalents were defined as: one glass of wine (120 mL), one can or long-neck beer (350 mL), one 620 mL beer bottle (equivalent to two drinks) or 50 mL of distilled spirits (cachaça, vodka or whisky). Alcohol intake was expressed in grams of ethanol per week and categorised as abstainers (0 g/week), moderate drinkers (men ≥ 1–209 g/week; women 1–139 g/week) and excessive drinkers (men ≥210 g/week; women ≥ 140 g/week)(25).
Statistical analysis
Data were presented as mean ± sd or as absolute and relative frequencies. Differences in socio-demographic and lifestyle variables between sexes, at baseline and follow-up, were evaluated using the χ 2 test for categorical variables and Student’s t-test for continuous variables. Variations (Δ) in anthropometric measurements according to UPF consumption groups were assessed using ANOVA with Tukey’s post hoc test. Changes in anthropometric measurements between baseline and follow-up, stratified by sex, were assessed using paired t-test.
Considering that the present study included two time points for the assessment of anthropometric indicators, crude and robust linear regression models were fitted to estimate the prospective association between changes in UPF consumption and changes (Δ) in anthropometric indicators. Confounding variables were selected for adjustment based on theoretical plausibility, previous evidence in the literature and statistical significance in univariate analyses (p value < 0·20). Interaction by sex was tested for the association between change in consumption and outcomes. Evidence of interaction was observed for body weight (p = 0·057) and BMI (p = 0·058), but not for WC (p = 0·176). Given these interactions, all analyses were stratified by sex.
As a sensitivity analysis, the main analyses were repeated using the percentage of total energy intake derived from UPF as an alternative exposure metric. UPF energy contribution was calculated by dividing energy intake from UPF (kcal/day) by total energy intake (kcal/day) and multiplying by 100. UPF energy contribution was categorised into quintiles separately at baseline and at wave 3. At each wave, quintiles 1 and 2 were classified as low consumption, quintile 3 as moderate consumption and quintiles 4 and 5 as high consumption. Participants were then classified into three categories according to changes in UPF consumption over time: maintained low or reduced, maintained moderate and maintained high or increased, following the same approach used in the primary analysis. The same regression models and covariate adjustments used in the primary analyses were applied to this sensitivity analysis.
All analyses were conducted using R software version 4.5.0 and RStudio version 2025.05.0. Statistical significance was set at α = 0·05.
Ethical aspects
ELSA-Brasil was approved by the Research Ethics Committees of all participating centers, under the following protocols: 669/06 (University of São Paulo, USP), 343/06 (Oswaldo Cruz Foundation, FIOCRUZ), 041/06 (Federal University of Espírito Santo, UFES), 186/06 (Federal University of Minas Gerais, UFMG), 194/06 (Federal University of Rio Grande do Sul, UFRGS) and 027/06 (Federal University of Bahia, UFBA). All participants provided written informed consent at both baseline and follow-up, and confidentiality of all information collected was strictly ensured. All measurements were conducted following standardised protocols and underwent regular quality control assessments.
Results
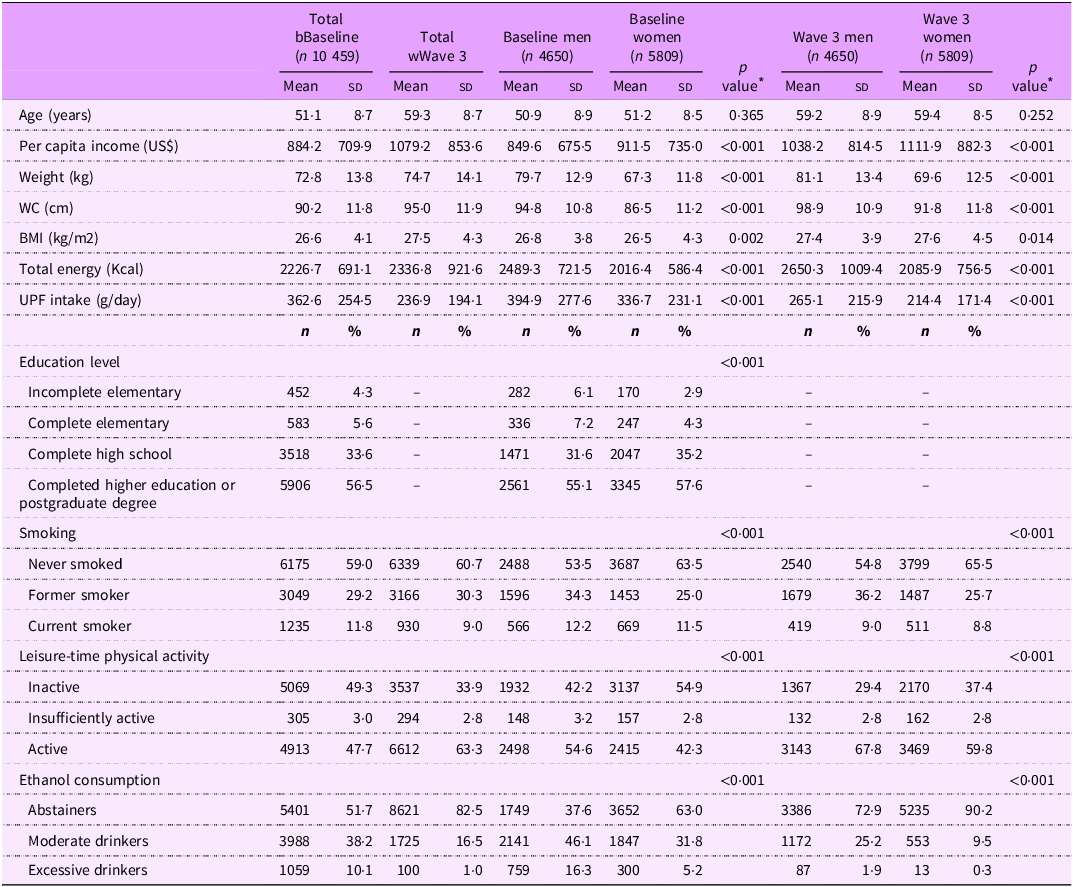
Table 1 presents the socio-demographic, lifestyle and nutritional characteristics of participants by sex at baseline and at the second follow-up. The sample comprised 10 459 participants (44·5 % men and 55·5 % women), with a mean age of 51·1 ± 8·7 years and a mean per capita income of US$ 884·2 ± 709·9. At baseline, the majority of participants self-identified as white (53·7 %), had completed higher education or postgraduate studies (56·5 %), engaged in non-sedentary physical activity (49·7 %), reported abstaining from alcohol (51·9 %) and had never smoked (59·0 %).
Socioeconomic characteristics, lifestyle, and dietary intake of participants, by sex, ELSA-Brasil, 2008–2010 to 2017–2019 (n 10 459)

Table 1. Long description
A table comparing socioeconomic characteristics, lifestyle, and dietary intake of participants by sex. The table has 10 rows and 12 columns. Column headers include Total Baseline, Total Wave 3, Baseline men, Baseline women, Wave 3 men, and Wave 3 women. Row labels include Age (years), Per capita income (US$), Weight (kg), WC (cm), BMI (kg/m2), Total energy (kcal), UPF intake (g/day), Education level, Smoking, Leisure-time physical activity, and Ethanol consumption. Each row provides mean and standard deviation values for each category. Notable trends include differences in per capita income, weight, and education level between men and women across different waves.
WC, waist circumference; UPF, ultra-processed food.
* χ 2 test and Student’s t-test for categorical and continuous variables, respectively. Values are mean ± sd or n (%). Education level was collected only at Baseline.
After 9 years of follow-up, there was an increase in the proportion of participants who abstained from alcohol, accompanied by reduction in physical inactivity and smoking. When stratified by sex, notable differences were observed: women had higher rates of physical inactivity and alcohol abstinence, whereas men had higher rates of smoking at both baseline and follow-up. Significant sex differences were also detected in all changes over time, except for dietary quality at baseline. During the same period, total energy intake increased, while UPF consumption decreased in both sexes (Table 1).
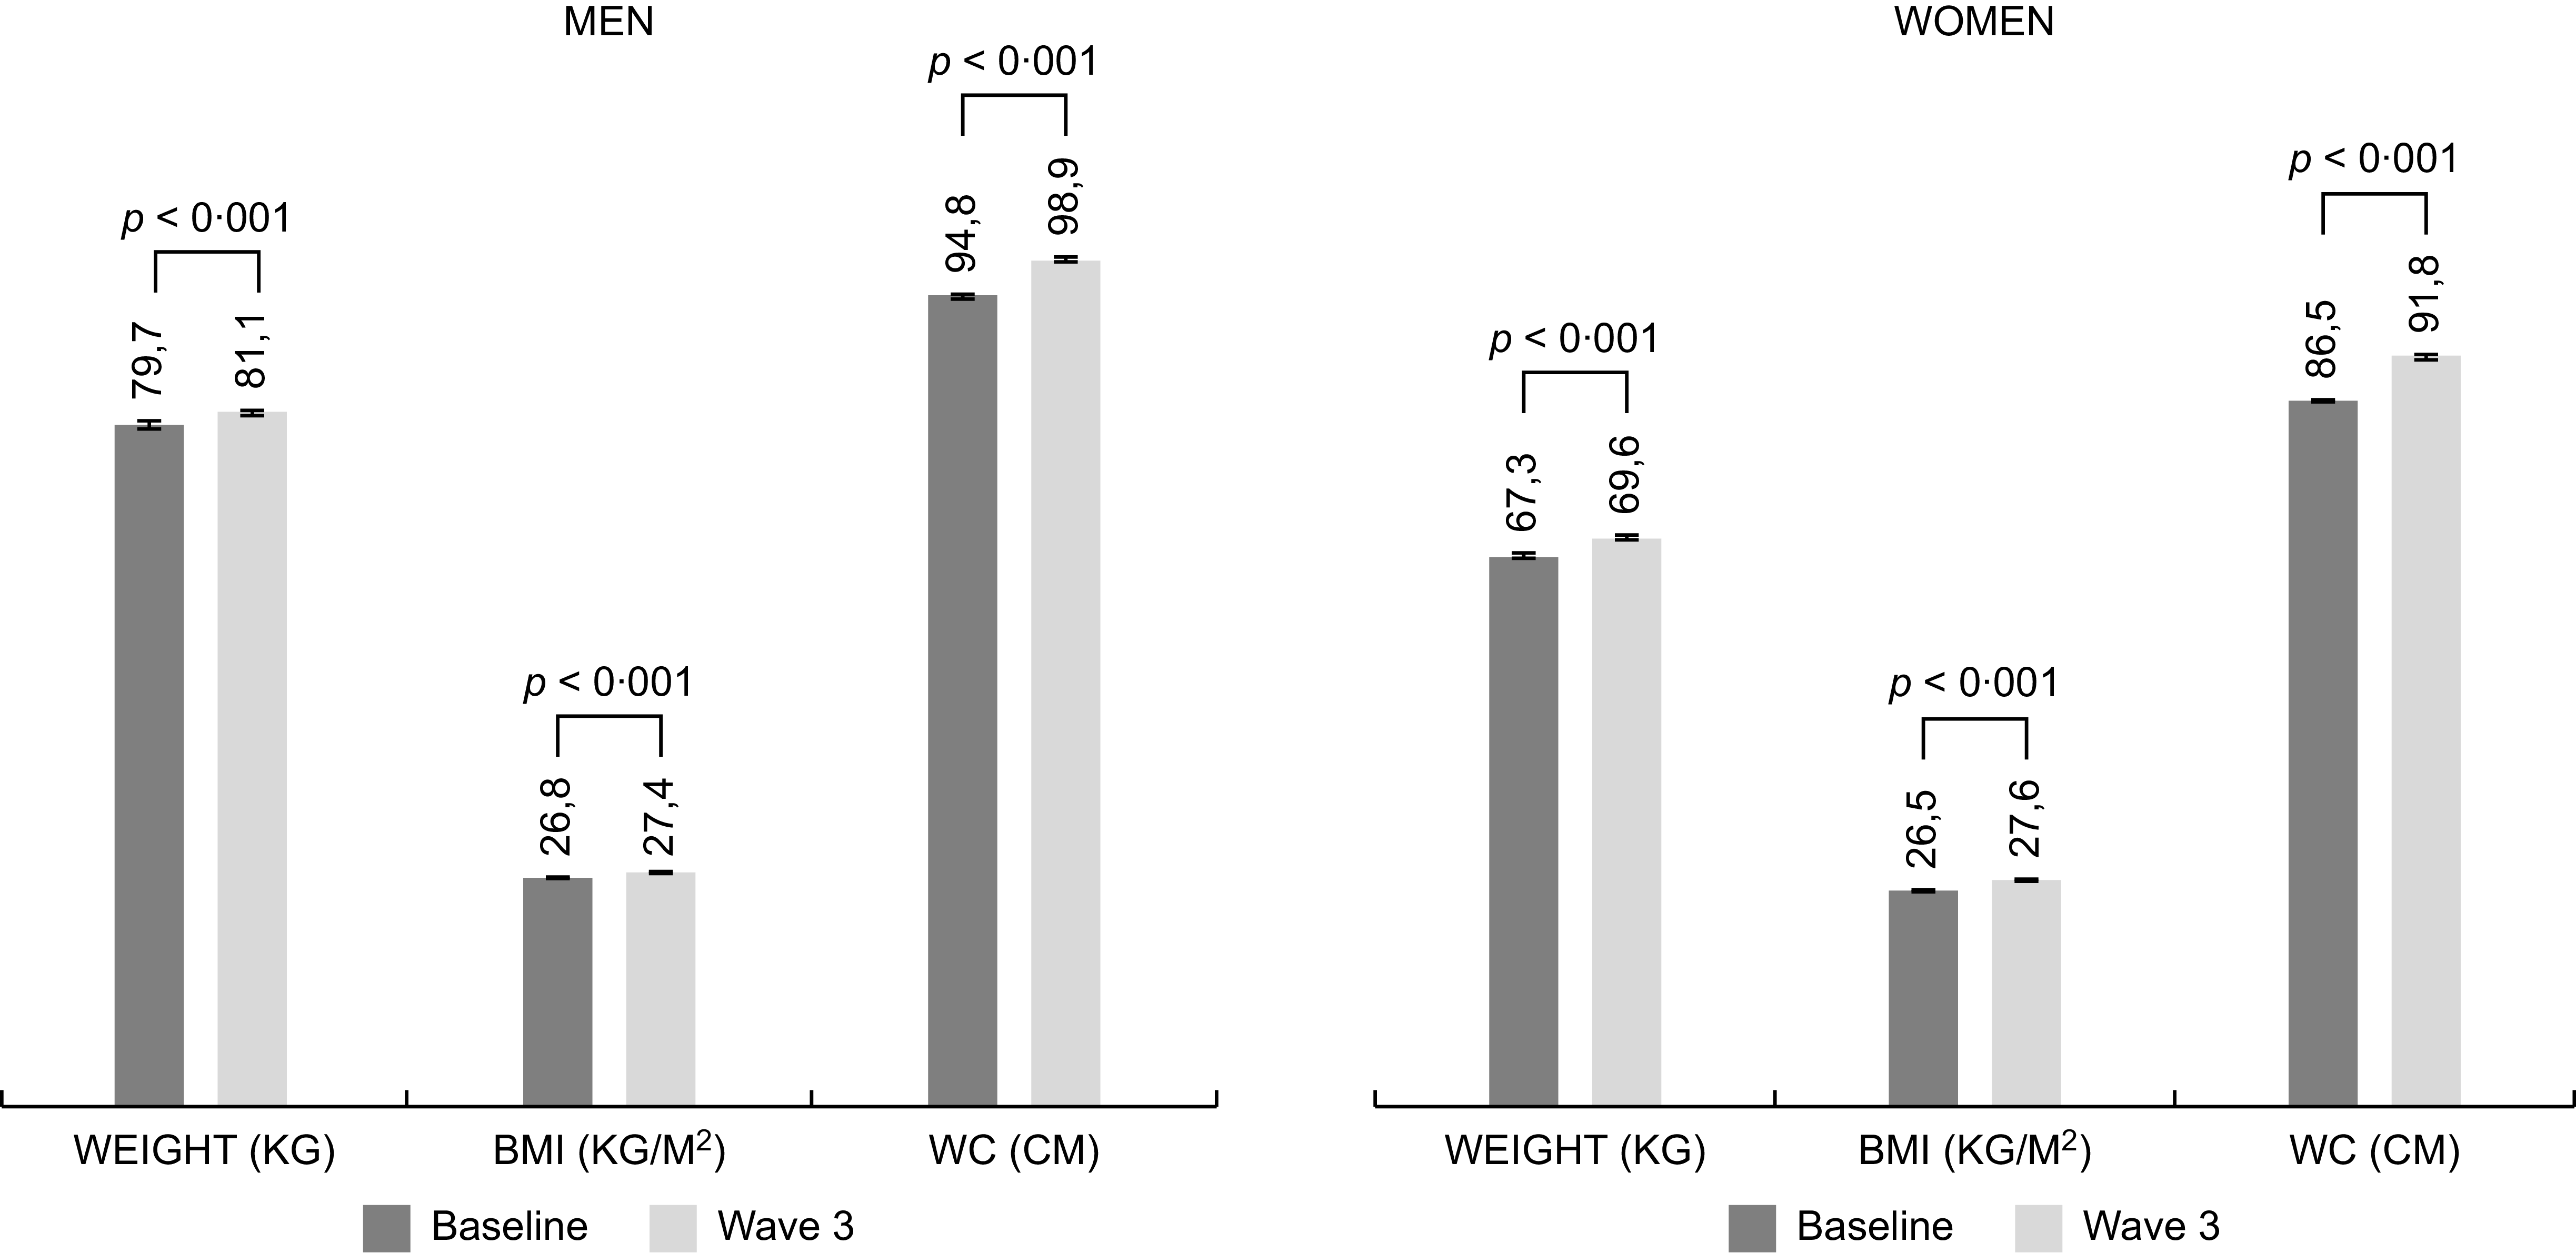
Figure 2 presents the mean values of body weight, BMI and WC at baseline and at the second follow-up, stratified by sex. Among both men and women, all anthropometric measures increased significantly over follow-up period (p < 0·001). In men, mean body weight increased from 79·7 kg to 81·1 kg, BMI from 26·8 to 27·4 kg/m2 and WC from 94·8 to 98·9 cm. In women, mean body weight increased from 67·3 to 69·6 kg, BMI from 26·5 to 27·6 kg/m2 and waist circumference from 86·5 to 91·8 cm.
Changes in anthropometric measurements (body weight and waist circumference) and BMI between baseline and the second follow-up, by sex, ELSA-Brasil, 2008–2010 to 2017–2019 (n 10 459). Values are presented as means. p-valor refer to paired t-tests.

Figure 2. Long description
The image contains two sets of bar graphs, one for men and one for women, comparing anthropometric measurements between baseline and wave 3. Each set includes three bar graphs representing weight, BMI, and waist circumference. The x-axis labels are WEIGHT (KG), BMI (KG/M^2), and WC (CM). The y-axis values are not labeled but show numerical differences. For men, weight increased from 79.7 kg to 81.1 kg, BMI decreased from 26.8 kg/m^2 to 27.4 kg/m^2, and waist circumference increased from 94.8 cm to 98.9 cm. For women, weight increased from 67.3 kg to 69.6 kg, BMI increased from 26.5 kg/m^2 to 27.6 kg/m^2, and waist circumference increased from 86.5 cm to 91.8 cm. All changes are statistically significant with p-values less than 0.001.
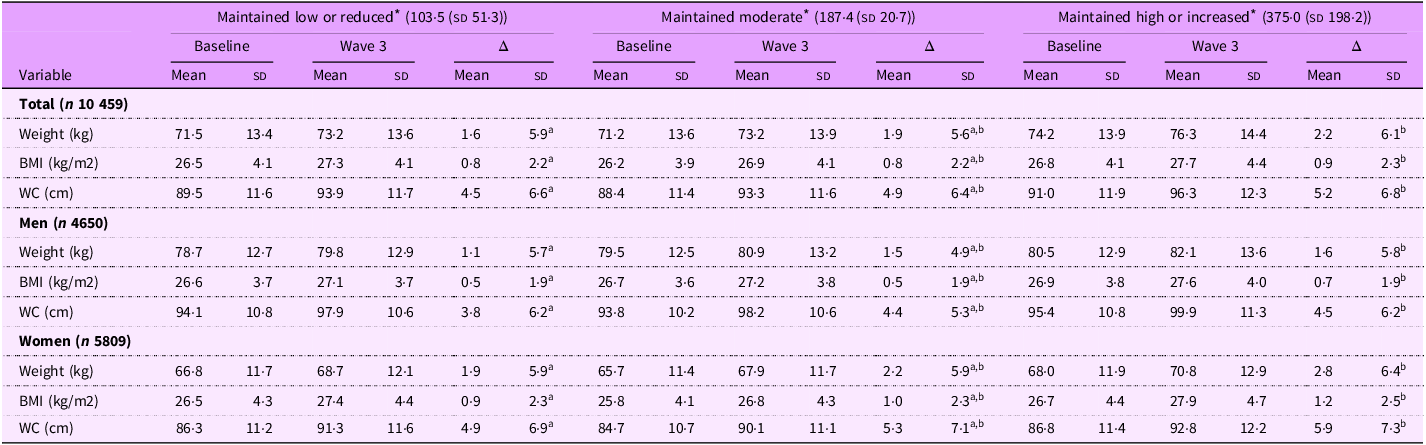
Table 2 presents anthropometric measurements (weight and WC) and BMI according to changes in UPF consumption categories. Increases in all anthropometric variables were observed across all UPF consumption categories. However, participants who maintained high UPF consumption or increased their intake experienced greater increases in body weight, WC and BMI, with more pronounced effects observed in women.
Anthropometric measurements and BMI according to changes in ultra-processed food consumption among ELSA-Brasil participants, 2008–2010 to 2017–2019 (n 10 459)

Table 2. Long description
The table presents anthropometric measurements and BMI according to changes in ultra-processed food consumption among participants. It is divided into three main categories based on changes in consumption: maintained low or reduced, maintained moderate, and maintained high or increased. Each category is further divided into total participants, men, and women. The table includes baseline and wave 3 measurements for weight, BMI, and waist circumference (WC), along with the changes (Δ) between these periods. For each category, the table lists the mean and standard deviation (sd) for each measurement. Notable trends include increases in weight, BMI, and WC across all categories, with more pronounced effects observed in women who maintained high or increased their ultra-processed food intake.
* Mean ± sd of ultra-processed food intake at wave 3 (g/day); BMI, body mass index; WC, waist circumference. Distinct superscript letters within rows indicate statistically significant differences between groups (p < 0.05), based on one-way ANOVA with Tukey’s post hoc test. Δ represents the absolute change between baseline and wave 3.
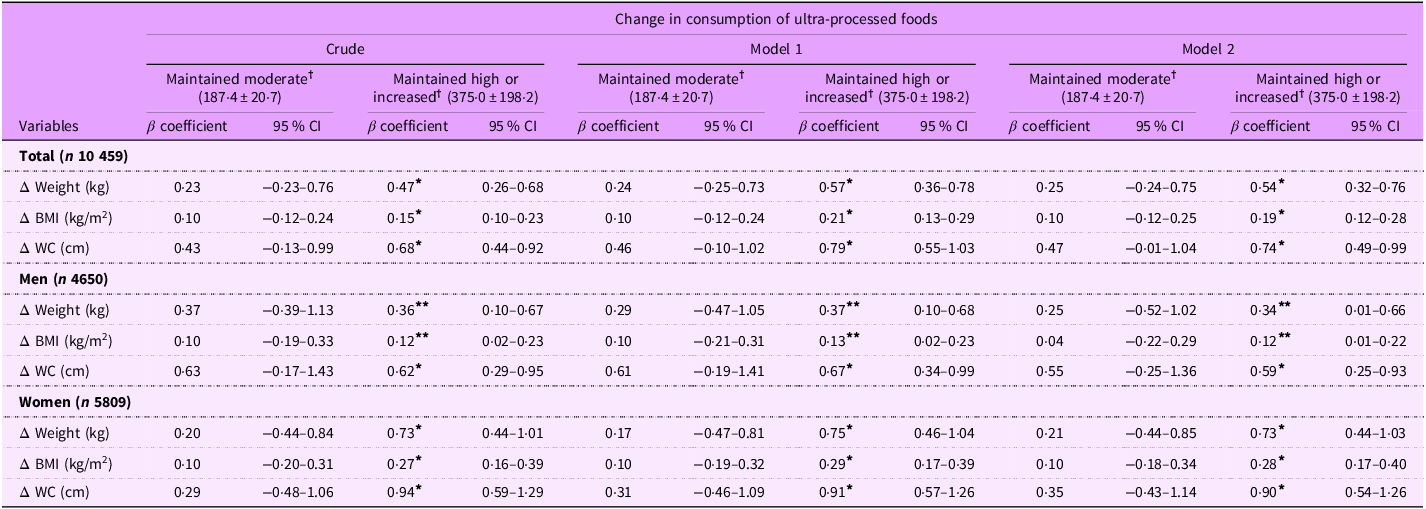
Table 3 presents the association between changes in UPF consumption and variations in anthropometric indicators across study waves. In the crude model, participants who maintained high or increased UPF consumption between baseline and the second follow-up showed significant increases in body weight, BMI and WC, compared with the reference group (participants who maintained low or reduced UPF consumption), regardless of sex.
Robust linear regression of changes in ultra-processed food consumption and variations in anthropometric measures and BMI, ELSA-Brasil, 2008–2010 to 2017–2019 (n 10 459)

Table 3. Long description
The table presents data on the association between changes in ultra-processed food consumption and variations in anthropometric measures and BMI. It includes 10459 participants and is divided into three main sections: Total, Men, and Women. Each section shows changes in weight, BMI, and waist circumference (WC) for two groups: those who maintained moderate consumption and those who maintained high or increased consumption. The table has three models: Crude, Model 1, and Model 2, each with beta coefficients and 95% confidence intervals. Row 1: Total (n 10459), Δ Weight (kg), β coefficient -0.23, 95% CI -0.23 to 0.76, β coefficient 0.47, 95% CI 0.26 to 0.68, β coefficient 0.24, 95% CI -0.25 to 0.73, β coefficient 0.57, 95% CI -0.36 to 0.78, β coefficient 0.25, 95% CI -0.24 to 0.75, β coefficient 0.54, 95% CI 0.32 to 0.76. Row 2: Total (n 10459), Δ BMI (kg/m^2), β coefficient 0.10, 95% CI -0.12 to 0.24, β coefficient 0.15, 95% CI 0.10 to 0.23, β coefficient 0.10, 95% CI -0.12 to 0.24, β coefficient 0.21, 95% CI -0.13 to 0.29, β coefficient 0.10, 95% CI -0.12 to 0.25, β coefficient 0.19, 95% CI 0.12 to 0.28. Row 3: Total (n 10459), Δ WC (cm), β coefficient 0.43, 95% CI -0.13 to 0.99, β coefficient 0.68, 95% CI 0.44 to 0.92, β coefficient 0.46, 95% CI -0.10 to 1.02, β coefficient 0.79, 95% CI 0.55 to 1.03, β coefficient 0.47, 95% CI -0.01 to 0.94, β coefficient 0.74, 95% CI 0.49 to 0.99. Row 4: Men (n 4650), Δ Weight (kg), β coefficient 0.37, 95% CI -0.39 to 1.13, β coefficient 0.36, 95% CI 0.10 to 0.67, β coefficient 0.29, 95% CI -0.47 to 1.05, β coefficient 0.37, 95% CI 0.10 to 0.68, β coefficient 0.25, 95% CI -0.52 to 1.02, β coefficient 0.34, 95% CI 0.01 to 0.66. Row 5: Men (n 4650), Δ BMI (kg/m^2), β coefficient 0.10, 95% CI -0.19 to 0.33, β coefficient 0.12, 95% CI 0.02 to 0.23, β coefficient 0.10, 95% CI -0.21 to 0.31, β coefficient 0.13, 95% CI 0.02 to 0.23, β coefficient 0.04, 95% CI -0.22 to 0.29, β coefficient 0.12, 95% CI 0.01 to 0.22. Row 6: Men (n 4650), Δ WC (cm), β coefficient 0.63, 95% CI -0.17 to 1.43, β coefficient 0.62, 95% CI 0.29 to 0.95, β coefficient 0.61, 95% CI -0.19 to 1.41, β coefficient 0.67, 95% CI 0.34 to 0.99, β coefficient 0.55, 95% CI -0.25 to 1.36, β coefficient 0.59, 95% CI 0.25 to 0.93. Row 7: Women (n 5809), Δ Weight (kg), β coefficient 0.20, 95% CI -0.44 to 0.84, β coefficient 0.73, 95% CI 0.44 to 1.01, β coefficient 0.17, 95% CI -0.47 to 0.81, β coefficient 0.75, 95% CI 0.46 to 1.04, β coefficient 0.21, 95% CI -0.44 to 0.85, β coefficient 0.73, 95% CI 0.44 to 1.03. Row 8: Women (n 5809), Δ BMI (kg/m^2), β coefficient 0.10, 95% CI -0.20 to 0.31, β coefficient 0.27, 95% CI 0.16 to 0.39, β coefficient 0.10, 95% CI -0.19 to 0.32, β coefficient 0.29, 95% CI 0.17 to 0.39, β coefficient 0.10, 95% CI -0.18 to 0.34, β coefficient 0.28, 95% CI 0.17 to 0.40. Row 9: Women (n 5809), Δ WC (cm), β coefficient 0.29, 95% CI -0.48 to 1.06, β coefficient 0.94, 95% CI 0.59 to 1.29, β coefficient 0.31, 95% CI -0.46 to 1.09, β coefficient 0.91, 95% CI 0.57 to 1.26, β coefficient 0.35, 95% CI -0.43 to 1.14, β coefficient 0.90, 95% CI 0.54 to 1.26.
WC, waist circumference.
Reference category: maintained low or reduced ultra-processed food consumption (103·5 ± 51·3 g/day).
Model 1 adjusted for sex, change in age, change in per capita income and education level.
Model 2 additionally adjusted for alcohol consumption, smoking status, leisure-time physical activity and change in total energy intake.
Sex-stratified models were not adjusted for sex.
† Mean ± sd of ultra-processed food intake at wave 3 (g/day).
* p < 0·001.
** p < 0·05.
In model 1, adjusted for socio-economic variables, significant increases were observed across all anthropometric outcomes. In model 2, which additionally adjusted for lifestyle factors and total energy intake, the observed increases were slightly attenuated but remained statistically significant. Over approximately 9 years of follow-up, participants who maintained high or increased UPF consumption gained, on average, 0·54 kg (95 % CI: 0·32–0·76) in body weight, 0·19 kg/m2 (95 % CI: 0·12–0·28) in BMI, and 0·74 cm (95 % CI: 0·49–0·99) in WC. No significant associations were observed for the group that maintained moderate consumption.
These effects were more pronounced in women. Among participants who maintained or increased UPF consumption, women experienced an increase of 0·28 kg/m2 in BMI (95 % CI: 0·17–0·40), compared with an increase of 0·12 kg/m2 (95 % CI: 0·01–0·22) in men. For WC, the increase was 0·90 cm (95 % CI: 0·54–1·26) in women and 0·59 cm (95 % CI: 0·25–0·93) in men. Regarding body weight, women gained 0·73 kg (95 % CI: 0·44–1·03), whereas men gained 0·34 kg (95 % CI: 0·01–0·66).
Sensitivity analyses using the percentage of total energy intake from UPF yielded results largely consistent with those of the primary analyses based on UPF consumption in grams/day (Supplementary Table 1). In the total sample, maintaining high or increasing UPF consumption was associated with greater increases in weight (β = 0·49 kg; 95 % CI: 0·28–0·70), BMI (β = 0·19 kg/m2; 95 % CI: 0·11–0·27) and waist circumference (β = 0·72 cm; 95 % CI: 0·48–0·96). Among women, the associations also remained consistent across all three anthropometric outcomes. Among men, the association with waist circumference remained (β = 0·52 cm; 95 % CI: 0·19–0·85), whereas the estimates for weight and BMI were attenuated, and their 95 % confidence intervals included the null value.
Discussion
This study demonstrated a significant increase in all anthropometric indicators among participants who maintained high or increased UPF consumption over the follow-up period, with more pronounced effects observed in women. During the same period, there was a reduction in mean daily UPF intake (g/day), an increase in the proportion of physically active individuals and a decline in the prevalence of excessive alcohol consumption and smoking. Together, these trends suggest a general shift towards healthier lifestyle behaviours, which may contribute to improvements in survival and life expectancy.
Despite these favorable behavioural changes, the persistent increase in anthropometric indicators, particularly among individuals with sustained high exposure to UPF, represents a relevant risk factor for adverse cardiometabolic outcomes. This finding indicates that the deleterious effects associated with high UPF consumption may partially offset the benefits of other health-promoting behaviours, potentially undermining long-term cardiometabolic health and longevity in this population.
Louzada et al. (2023)(Reference Louzada, Cruz and Silva2) analysed the distribution and temporal trends of UPF consumption in Brazil between 2008 and 2018. During this period, UPF accounted for an average of 19·7 % of total caloric intake, with higher consumption observed among women and residents of the South and Southeast regions, and lower consumption among Black individuals and those living in rural areas. The authors also reported a decreasing trend in UPF consumption with increasing age, education level and household income. Consistent with these findings, within the ELSA-Brasil cohort, a significant reduction in mean daily UPF consumption (g/day) was observed after 9 years of follow-up, despite an overall increase in total energy intake among both sexes.
UPF are generally characterised by high energy density and elevated contents of total and saturated fats, added sugars and Na, while containing lower amounts of fiber and protein compared with unprocessed or minimally processed foods(Reference Gupta, Hawk and Aggarwal4). These nutritional characteristics favour excessive caloric intake, thereby contributing to weight gain and increased body fat accumulation(Reference Chen, Khandpur and Desjardins26). In addition, UPF may induce rapid postprandial glycaemic responses and impair satiety regulation by disrupting hunger and reward signalling pathways. Beyond their nutritional profile, chronic UPF consumption may increase exposure to food additives and endocrine-disrupting chemicals, such as bisphenol A, tartrazine, erythrosine, artificial sweeteners, parabens, phthalates, microplastics and mineral oils, which have been implicated in metabolic dysregulation(Reference Lane, Gamage and Du27).
Dicken and Batterham (2021)(Reference Dicken and Batterham28), in a review of prospective studies, reported that most associations between UPF consumption, obesity and other health-related outcomes remained significant and of similar magnitude even after adjusting for diet quality or dietary patterns. These findings suggest that the deleterious effects of high UPF consumption are largely independent of the nutritional quality of the diet and of total energy intake. This interpretation is consistent with the results of the present study, in which participants who maintained high UPF consumption over 9 years exhibited greater increases in body weight, BMI and WC compared with those who maintained low intake or reduced their consumption. However, direct comparison between the findings should be interpreted with caution, as, unlike the study by Dicken and Batterham, our analyses did not include adjustments for indicators of diet quality or other equivalent measures.
In a previous analysis from the ELSA-Brasil cohort, UPF accounted for an average of 24·6 ± 9·6 % of total energy intake at baseline. After a mean follow-up period of 3·8 years, individuals in the highest quartile of UPF consumption exhibited a higher relative risk of substantial gains in body weight and WC, as well as a 20 % increased risk of overweight/obesity and a 2 % increased risk of obesity(Reference Canhada, Luft and Giatti11). In the present analysis, significant increases in body weight, WC and BMI were observed after approximately 9 years of follow-up across all UPF consumption categories. However, when consumption patterns were compared, these increases were more pronounced among those who maintained high UPF intake or increased their consumption over time.
Hall et al. (2019)(Reference Hall, Ayuketah and Brychta29), in a randomised controlled clinical trial, compared ultra-processed and minimally processed diets that were isocaloric and matched for macronutrients, and offered ad libitum. After 2 weeks of intervention, participants consuming the ultra-processed diet experienced an average weight gain of 0·9 ± 0·3 kg, whereas those assigned to the minimally processed diet showed an average weight loss of 0·9 ± 0·3 kg. These findings reinforce evidence that the adverse effects of UPF are not explained solely by energy density or nutritional composition, but also involve additional mechanisms related to palatability, texture, food matrix disruption, additives and impaired satiety regulation. Moreover, alterations in gut microbiota composition and function have also been associated with weight gain in the context of UPF consumption(Reference Lane, Gamage and Du27,Reference Geng, Ni, Sun and Li30) .
The effect of maintaining or increasing UPF consumption on anthropometric indicators was more pronounced among women in the ELSA-Brasil cohort than among men. This sex difference may be partially explained by hormonal factors, sex-specific body composition and differential metabolic responses to UPF intake(Reference Pestoni, Habib and Reber31). Consistent with these findings, Rudakoff et al. (2022)(Reference Rudakoff, Magalhães and Viola8) reported in a longitudinal study that higher UPF consumption among adult women was associated, over the long term, with increased fat mass and reduced lean mass, even after adjustment for multiple confounding factors.
In men, the anthropometric impact of UPF consumption appears attenuated; however, experimental data indicate important metabolic and reproductive effects beyond changes in body weight. In a randomised controlled clinical trial involving men of reproductive age, UPF consumption, even within an isocaloric and nutritionally matched diet compared with one based on unprocessed foods, led to unfavourable metabolic and reproductive alterations(Reference Preston, Iversen and Hufnagel32). Key findings included increases in body weight and in the LDL/HDL cholesterol ratio, indicating a deterioration in lipid profile. Together, these results suggest that the deleterious effects of UPF extend beyond adiposity, involving pathways related to inflammation, hormonal dysfunction and adverse modulation of lipid metabolism.
Future studies should explore sex-specific biological pathways, including hormonal and metabolic mechanisms, as well as life-course exposure to UPF, to better elucidate differential susceptibility and inform targeted public health interventions.
High consumption of UPF has become a global public health priority due to its widespread prevalence, well-documented adverse health effects and its association with increased all-cause mortality(Reference Louzada, Cruz and Silva2). A systematic review on UPF consumption identified higher intake among men, young adults and individuals with overweight or obesity, although substantial variability exists across countries, regions, age groups and sex(Reference Marino, Puppo and Bo’33).
According to the Pan American Health Organization(34), the Americas are experiencing a rapid replacement of unprocessed or minimally processed foods by ultra-processed products, a trend that parallels the rising prevalence of overweight and obesity reported by the WHO, which currently affects 62 % of adults aged 20 years or older in the region. In Brazil, the Dietary Guidelines for the Brazilian Population recommend limiting the consumption of processed foods, and, especially, avoiding UPF, emphasising the health risks associated with dietary patterns based on these products(35). Consistent with these recommendations, the American Heart Association also prioritises unprocessed or minimally processed foods over ultra-processed options as a key strategy for cardiovascular health promotion(Reference Lichtenstein, Appel and Vadiveloo36).
This study has some limitations that should be acknowledged. First, dietary intake was assessed using an FFQ, which is subject to recall bias and potential under or overestimation of consumption. Nevertheless, the FFQ employed has been previously validated for the study population. Second, although the analyses were adjusted for several socio-demographic and lifestyle confounders, the possibility of residual confounding by unmeasured factors cannot be entirely ruled out. In this context, given the stronger associations observed among women, the lack of adjustment for hormonal and metabolic factors represents an additional limitation. Furthermore, the classification of foods according to the NOVA system may involve some degree of misclassification, particularly for products with complex compositions. Finally, as the study sample is composed of civil servants, the findings may not be fully generalisable to the broader Brazilian population.
Despite these limitations, this study has several notable strengths. It is a longitudinal analysis based on data from ELSA-Brasil, one of the largest and most well-structured cohorts in Latin America. Its extended follow-up period, combined with repeated dietary assessments, enables a robust investigation of the association between persistent patterns of UPF consumption and anthropometric changes over time. Furthermore, the use of standardised methods to assess both exposure and outcomes contributes to the consistency and comparability of the findings. The cohort also implements rigorous quality control procedures at all stages of data collection, enhancing the reliability and validity of the information obtained.
The application of the NOVA classification enabled a focused investigation of the effects of UPF, an issue of increasing relevance in public health research. Moreover, the analysis was robust, with adjustment for a wide range of sociodemographic and behavioural factors, as well as total energy intake, which strengthens confidence in the observed associations. Finally, these findings contribute to growing body of evidence linking UPF consumption to weight gain and adverse metabolic outcomes in the adult population.
Conclusion
This study shows that high consumption of UPF is associated with increases in body weight, BMI and WC among participants of the ELSA-Brasil cohort, with stronger association observed among women, independent of socio-economic characteristics, lifestyle factors and total caloric intake.
These findings reinforce the evidence that UPF represent an independent risk factor for obesity and metabolic disorders. Given their growing presence in contemporary diets, particularly among younger populations, public policies aimed at regulating the production, marketing and availability of UPF, alongside the promotion of diets based on unprocessed or minimally processed foods, are essential to mitigate their adverse impacts on population health.
Supplementary material
For supplementary material accompanying this paper visit https://doi.org/10.1017/S136898002610370X.
Acknowledgements
The authors thank all study participants for their valuable contribution. The authors also acknowledge the Coordenação de Aperfeiçoamento de Pessoal de Nível Superior (CAPES; Coordination for the Improvement of Higher Education Personnel), the Fundação de Amparo à Pesquisa do Estado de Minas Gerais (FAPEMIG; Research Support Foundation of the State of Minas Gerais), the Conselho Nacional de Desenvolvimento Científico e Tecnológico (CNPq; National Council for Scientific and Technological Development) and the Ministério da Saúde (Brazilian Ministry of Health) for their institutional support.
Author contributions
All authors contributed to the study concept; MBS designed the study guided by MCBM; MBS and CMOA analysed the data; MCBM, BEC and VNMCL contributed to interview data analysis and draft theme development; FCV, SISJ, TRPB and MCBM contributed to theme finalisation; MBS, BEC, CMOA and RVNMCL finalised results, including further analysis to integrate the quantitative and qualitative results; MCBM and MBS drafted the manuscript; all authors critically reviewed the manuscript and approved the final submission.
Financial support
This study was funded by the Brazilian Ministry of Health (Science and Technology Department) and the Brazilian Ministry of Science, Technology and Innovation (FINEP and CNPq): Grant Numbers: 01 06 0010.00 and 01.10.0643.03 (RS); 01 06 0212.00 and 01.10.0742-00 (BA); 01 06 0300.00 and 01.12.0284.00 (ES); 01 06 0278.00 and 01 10 0746 00 (MG); 01 06 0115.00 and 01.10.0773-00 (SP) and 01 06 0071.00 and 01.11.0093.01 (RJ).
Milena Bernardes Santos e Belisa Eduarda Crabbis have CAPES scholarship.
Maria del Carmen Bisi Molina has a productivity grant from CNPq.
Rita Valéria Nunes de Melo Campos de Lima has a FAPEMIG scholarship.
Competing interests
The authors declare no conflicts of interest.
Ethical standards
This study was conducted in accordance with the guidelines established in the Declaration of Helsinki, and all procedures involving research participants were approved by the ethics committees of the Federal Universities of Espírito Santo, Minas Gerais, Rio Grande do Sul and Bahia, the University of São Paulo and FIOCRUZ. Written informed consent was obtained from all participants.


 Open access

