Introduction
In the past decade, II–VI compound semiconductor quantum dots (QDs) have gained significant attention of the scientific research community for their numerous applications such as field effect transistors, optoelectronic transducers, light-emitting diodes, solar cells, radiation detectors, and non-linear optical devices.[Reference Mattoussi, Radzilowski, Dabbousi, Thomas, Bawendi and Rubner1–Reference Nordell, Boatman and Lisensky6] The driving force behind their persistent utilization is the unique combination of their optical properties; i.e., narrow emission peak, high quantum yield and electronic stability.[Reference Genger, Grabolle, Cavaliere Jaricot, Nitschke and Nann7–Reference Madan, Kumar, Singh, Madhwal, Bhatnagar and Mathur9] The possibility of multiple exciton generation and band gap engineering has made QDs an excellent candidate for developing high-efficiency solar cells and light-emitting diodes radiating pure colors. In spite of this, the II–VI compound semiconductor QDs have recently been banned in various countries due to inherent toxicity issues related with them.[Reference Omata, Nose and Otsuka-Yao-Matsuo10] Their composition does not match with the global trend to regulate the use of toxic materials such as Cd, Te, Pb, etc. Therefore, there is a demand of a material, which can effectively replace these QDs in the industry.
As an alternative, I–III–VI ternary compound QDs have recently attracted several researchers because of their attractive electrical and optical properties, well suited for replacing Cd-based QDs.[Reference Arici, Sariciftci and Meissner11–Reference Song and Yang14] CuInS2 (CIS) is the most extensively studied form among various I–III–VI ternary compositions. It is environment friendly, has a small direct band gap of 1.5 eV (which is nearly the optimum band gap for a single junction photovoltaic device), high absorption coefficient (>105 cm−1), high photoconductivity, and possesses long-term electronic stability.[Reference Lewerenz15, Reference Hussain, Podder, Saha and Ichimura16] CIS QDs can also be used for bio-labeling because of their non-toxic nature. The Bohr exciton radius for CIS QDs is ~4 nm hence nanoparticles having size approximately <8 nm can show quantum confinement effects.[Reference Czekelius, Hilgendorff, Spanhel, Bodja, Lerch, Miller, Bloeck, Su and Giersig17]
Ternary compounds, unlike conventional II–VI binary compounds [where photogenerated excitons rapidly decay to give photoluminescence (PL)], show a different PL mechanism due to their complex crystal structure and non-stoichiometric composition.[Reference Mochizuki, Niwa and Masumoto18, Reference Pandey and Maroudas19] This gives rise to generation of defect states populated in the forbidden gap. The presence of defect states greatly affects the PL mechanism in the ternary compounds. Therefore, it is utmost important to determine their optical and electronic properties in correlation with their structure for their application in a variety of fields.
The PL spectra and quantum confinement effects on I–III–VI ternary compound QDs have presently been widely studied but the outcome of these investigations are inconsistent.[Reference Nam, Seuk and Yang20–Reference Hamanaka, Ogawa, Tsuzuki and Kuzuya23] Nam et al.[Reference Nam, Seuk and Yang20] have shown that the radiative recombination of excited electron–hole pairs in Cu-deficient QDs is associated with defect states inside the band gap. They stated that the emission is due to transition between donor and acceptor levels. On the other hand, Li and Teng[Reference Li and Teng21] found that the PL energy of the CIS QDs was higher than the gap transition energy obtained from the absorption spectrum. They suggested that this emission results from the excited electrons falling from quantized discrete levels higher than the band edge to the ground states. Nairn et al.[Reference Nairn, Shapiro, Twamley, Pounds, vonWandruszka, Fletcher, Williams, Wang and Norton22] also concluded that the PL emission is irrelevant to the particle size agreeing with Li and Teng.[Reference Li and Teng21] Hamanaka et al.[Reference Hamanaka, Ogawa, Tsuzuki and Kuzuya23] observed that tunability of ternary QD band gap with size variation is limited. They also concluded that due to strong electron–phonon interaction the emission band in chalcopyrite QDs is broad. The diversity in the findings motivated us to study the optical characteristics of the CIS QDs to find their applicability in developing non-toxic photovoltaics and light-emitting diodes. In the present work, we have synthesized CIS QDs by the solvothermal method[Reference Li, Pandey, Werder, Khanal, Pietryga and Klimov24] and studied their optical properties as a function of their size. The PL measurements were used as a tool to explain the relaxation dynamics of the photogenerated excitons in the CIS QDs.
Experimental details
The chemicals used for synthesizing CIS QDs viz. indium acetate [In(OAc)3], copper iodide (CuI), and 1-dodecanethiol (1-DDT) were procured commercially. All the three components were mixed in a beaker keeping the concentration of In(OAc)3 and CuI as 1 mmol in 5 mL of 1-DDT. The mixture was then homogenized using ultrasonication and was kept on a hot plate (100 °C) till the solution became colorless. Afterwards, the temperature was increased to 150 °C where the nucleation process is initiated and growth of nanocrystals occurs. The solution changed from colorless to light green and finally to black (through yellow, orange, and red) as the time of heating progressed. The change in color indicates increase in size of QDs with passage of reaction time. The growth process was terminated by placing beaker in an ice bath. Three samples namely sample A (green), sample B (yellow), and sample C (red) were synthesized by this process, keeping their reaction time as 12, 13, and 15 min, respectively. The so-obtained QDs were dispersed in toluene for characterization. A typical image of the so-dispersed QD samples is shown in Fig. 1. The size distribution of QDs in the toluene and their chemical compositions were studied by high-resolution transmission electron microscopy (HRTEM) and energy dispersive X-ray spectroscopy (EDAX), respectively (using HRTEM: TECNAI G2 T30 U-TWIN). For optical characterization, the absorption and PL spectra of the samples were studied using spectrophotometer (Shimadzu UV-2450) and spectrofluorophotometer (Shimadzu RF-5301PC), respectively.
Typical image of CIS QDs dispersed in toluene.

Results and discussion
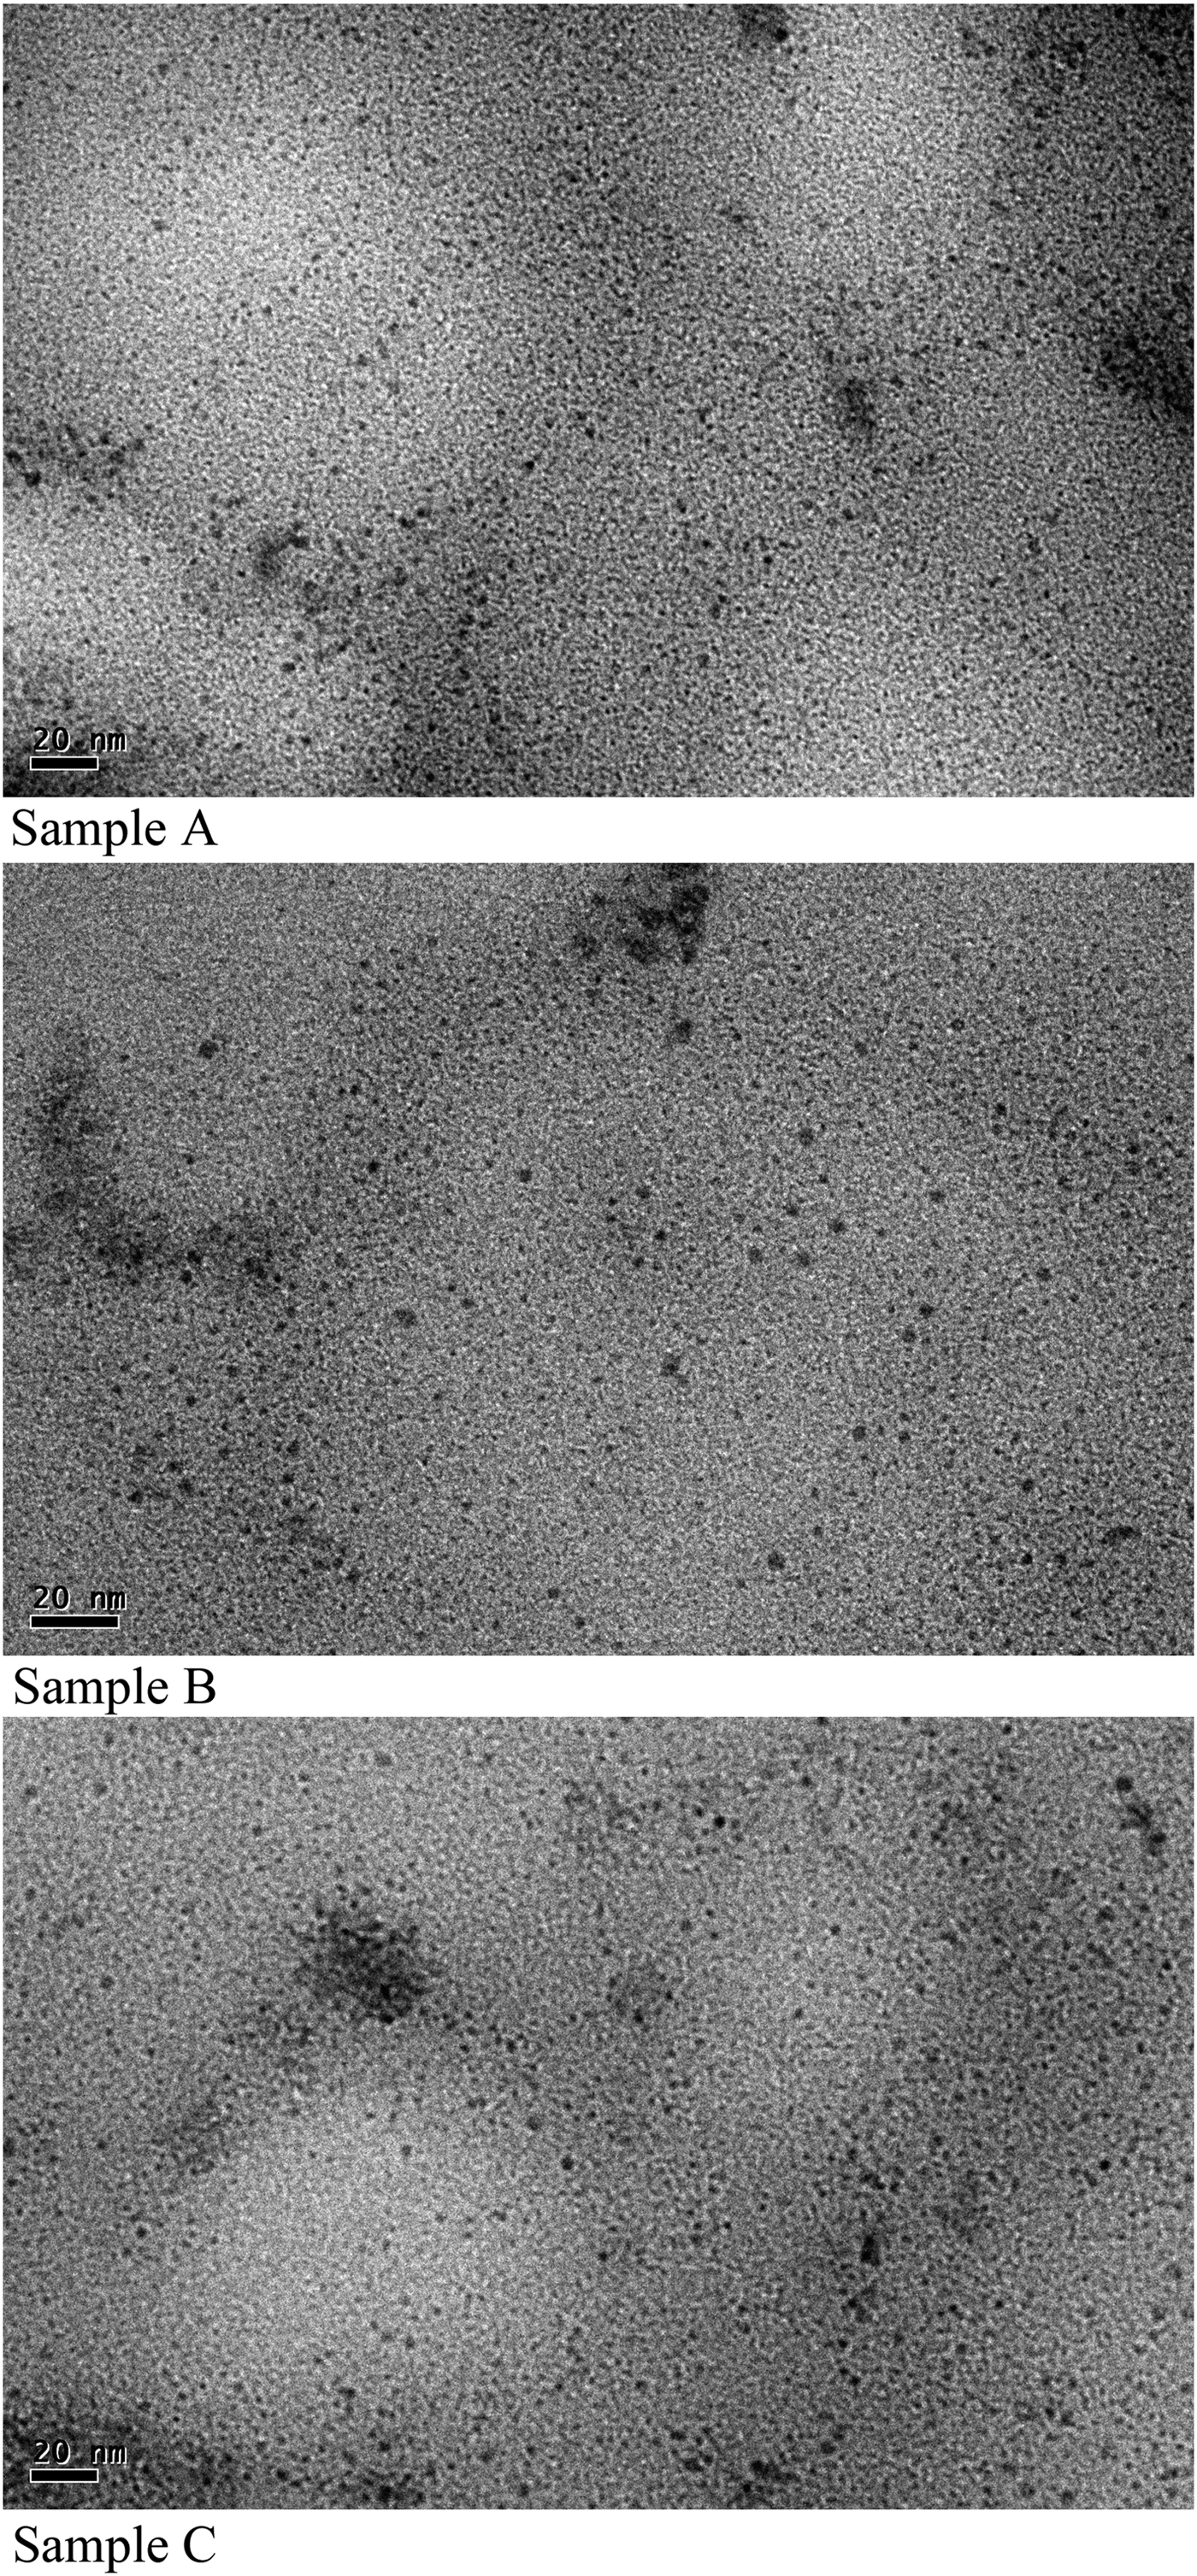
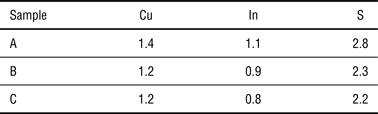
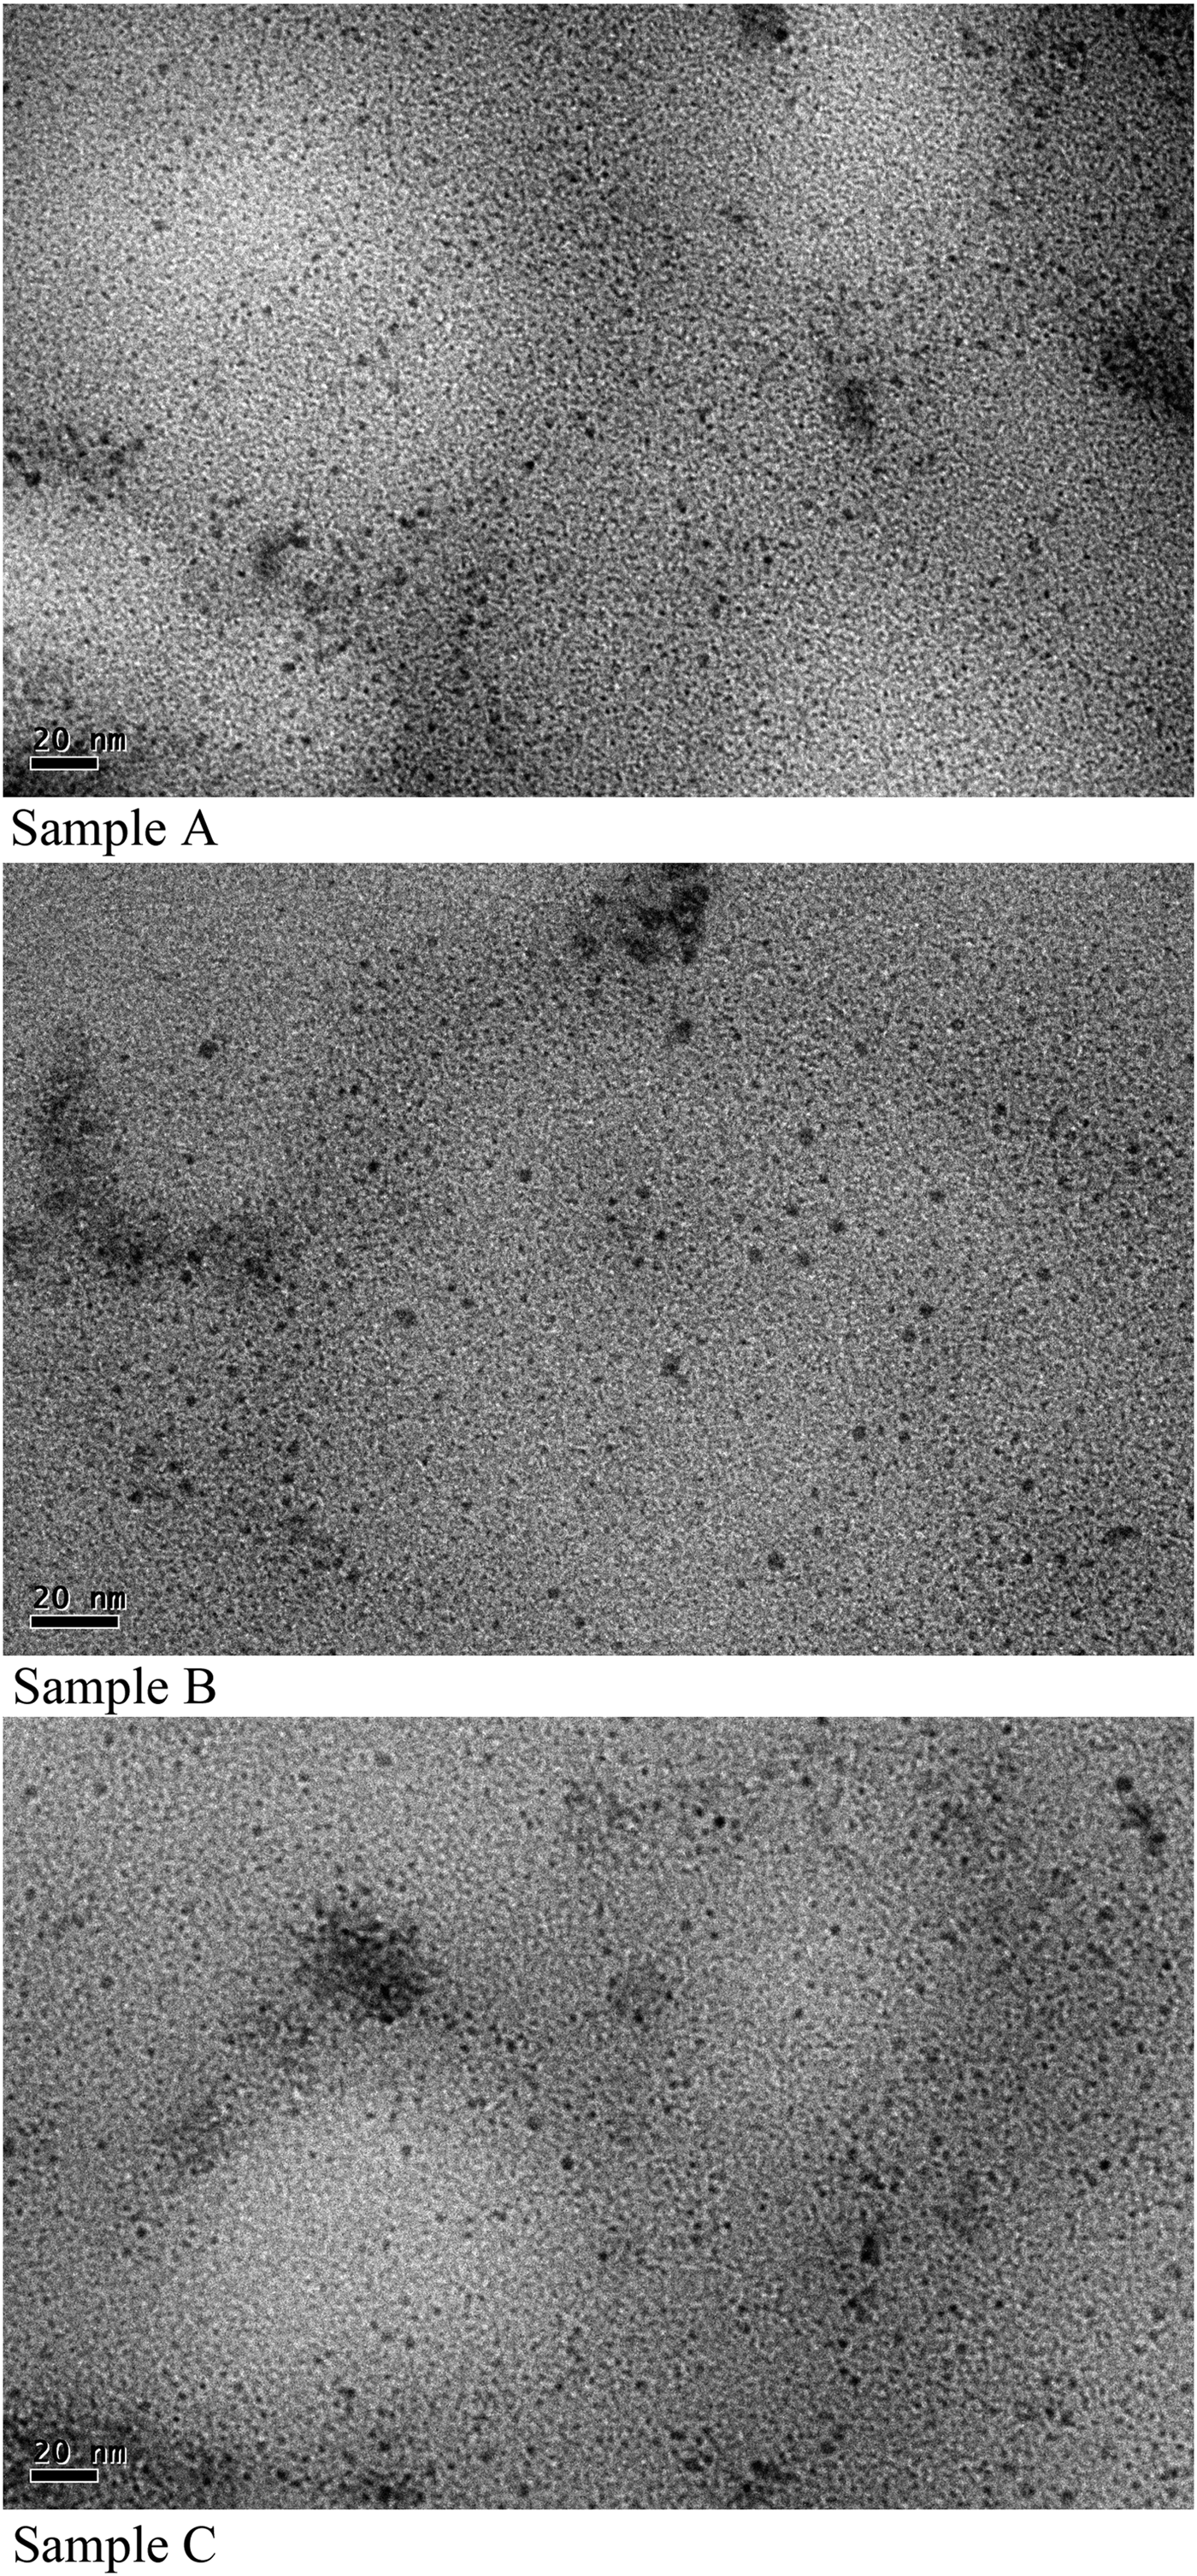
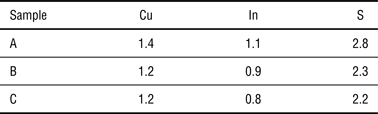
The TEM images of all the three QD samples A, B, and C are shown in Fig. 2. A homogeneous distribution of QDs is observed in toluene for all the samples. The average size of QDs as determined from the TEM analysis is found to be 2.6 ± 0.2, 3.0 ± 0.2, and 3.7 ± 0.2 nm for samples A, B, and C, respectively. The actual chemical composition of the QD samples as observed by EDAX analysis is presented in Table I. The composition is found to be approximately same for all the three samples (i.e., 1:0.8:2).
HR-TEM images of CIS QDs dispersed in toluene for all the three samples.
Chemical composition of the QD samples.
The optical absorption spectra for all the three samples (A, B, and C) are shown in Fig. 3. The spectra exhibit sharp absorption band edges, which are blue-shifted with respect to the bulk band gap (1.5 eV). The band gap widening confirms the quantum confinement in the so-grown nanocrystals, which is also evident from the occurrence of excitonic peak in the absorption spectra. It is found that as the reaction time increases the absorption peak gets red-shifted. This is attributed to the increase in the size of the nanocrystals with the growth time. As the time progresses more and more constituents add to the growing crystals leading to the larger size nanocrystals.
Absorption spectra of the as grown CIS QDs dispersed in toluene.
The optical band gap values of CIS QDs were determined using the relation given by Mondal et al.[Reference Mondal, Mulick, Layanya, Dhar, Ray and Lahiri25]
 $$\alpha h\nu = {\rm const}\, \lpar h\nu - E_{\rm g} \rpar ^n\comma$$
where α is the absorption coefficient, hν is the photon energy, E g is the band gap and n represents the type of transition. The value of α is obtained from α = 2.3028(A/t), where ‘A’ is the absorbance and ‘t’ is the thickness of the sample. For the direct band gap semiconductors, the value of ‘n’ is 0.5. The plot of variation in (αhν)2 with the energy (hν) is shown in Fig. 4. To estimate the optical band gap (E qdg), the curves were extrapolated toward the x-axis. The values of E qdg obtained from the intercept are shown in Table II.
Plot of variation in (αhν)2 with energy.
Variation of QD size and band gap with reaction time.
The average radii of QDs are calculated using the following relation given by Barman et al.[Reference Barman, Sarma, Sarma and Sarma26]:
 $$E_{\rm g}^{qd} = E_{\rm g}^{{\rm bulk}} + \displaystyle{{h^2 \pi ^2 } \over {2\mu R^2 }} - \; \displaystyle{{1.8e^2 } \over {\varepsilon R}}\comma$$
or
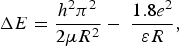 $$\Delta E = \displaystyle{h^2 \pi ^2 \over 2\mu R^2} - \; \displaystyle{1.8e^2 \over \varepsilon R}\comma$$
where E bulkg is the bulk band gap of CIS, ΔE is the increase in band gap energy due to quantum confinement, R is the average radius, and μ −1 = (m *e)−1 + (m *h)−1, where m *e and m *h are the values of effective masses of electron and hole, respectively, for CIS QDs. The first term of Eq. (3) represents the kinetic energy of the confined exciton and the second term is the Coulomb interaction of the electron with the hole. It can be observed from Table II that the average size of QDs increases from 2.89 to 3.83 nm with the increasing reaction time from 12 to 15 min. The same trend with matching numbers is also seen in the HRTEM analysis.
The PL spectra for all the three samples are studied in the wavelength region 400–800 nm (Fig. 5). All the samples were excited with their optical absorption energy i.e., 2.76, 2.56, and 2.22 eV for samples A, B, and C, respectively. The PL peak energy was found to be red-shifted with increase in the reaction time. The red shift again is an evidence of increase in size of QDs. The stokes shift between absorption and PL peaks was calculated for all the three samples and is as shown in Table III.
PL spectra of CIS QDs dispersed in toluene.
Variation of stokes shift and FWHM with QD size.
It may be noted that the QDs did not show near-optical band gap luminescence and the stokes shift is found to be quite larger (more than 100 meV) in all the samples. This larger value cannot be associated with the direct exciton recombination because in that case stokes shift would be ≤100 meV.[Reference Murray, Norris and Bawendi27] It may be mentioned that the relaxation dynamics of photogenerated charge carriers involving the direct exciton recombination is quite faster with small stokes shift as compared with the recombination relating to defect states.[Reference Murray, Norris and Bawendi27, Reference Thomas, Hopfield and Augustyniak28] The PL emission in CIS QDs is therefore predominantly governed by defect states available within the forbidden gap as explained by some other workers.[Reference Li and Teng21, Reference Satoh, Abe, Wakita and Mochizuki29] The defect sites in the nanocrystals (originating due to interstitials, vacancies, etc.) have a certain energy state, which is hardly affected by the QD size. However, it may be noted that as the QD size increases the PL emission energy reduces by ~280 meV that is quite larger to be associated with defect-related emission. This can be explained by considering that PL emission in CIS QDs involves transition between excitonic level and defect states. Involvement of defect states causes a larger stokes shift and contribution of excitonic level results in change of PL emission energy with size of QDs. The color tuning of the CIS QDs therefore can be achieved via two routes namely by changing size of QDs (reaction time in our case) or by varying stoichiometry of the QDs.
The PL spectrum can also be used to study the density of defect states present in the nanocrystals. It is observed that with increase in QD size the intensity of PL peak and its full-width at half-maxima (FWHM) decreases. This is attributed to the fact that for small size QDs the surface-to-volume ratio is quite larger so the probability of occurrence of defects is higher. With a large number of defect sites the small size QDs show highly intense PL emission with a larger FWHM.
Conclusions
The PL emission in CIS QDs is predominantly governed by defect states present in the forbidden gap as is evident by the larger stokes shift. However, the variation in the emission energy with the QD size indicates that the transition responsible for PL emission is between the excitonic level and defect states. Furthermore, as the QD size increases the defect sites decrease resulting in low intensity of PL emission with small FWHM.
Acknowledgments
The financial support from the Department of Science and Technology, India is gratefully acknowledged. The authors also acknowledge the University Science Instrumentation Centre, University of Delhi, India for TEM and EDAX measurements.