INTRODUCTION
Onchidella celtica (Cuvier, 1817) is an air-breathing gastropod belonging to the Family Onchidiidae and the Order Systellommatophora (Dayrat et al., Reference Dayrat, Conrad, Balayan, White, Albrecht, Golding, Gomes, Harasewych and de Frias Martins2011). It is the only representative of the Onchidiidae in Britain. Onchidella celtica is a warm water species. Its geographic range extends from the Azores to the south-west shores of Britain (Tween, Reference Tween1987) where it has been surveyed with a suite of other potential climate change indicator species (Mieszkowska et al., Reference Mieszkowska, Leaper, Moore, Kendall, Burrows, Lear, Poloczanska, Hiscock, Moschella, Thompson, Herbert, Laffoley, Baxter, Southward and Hawkins2005; Laffoley et al., Reference Laffoley, Baxter, O'Sullivan, Greenaway, Colley, Naylor and Hamer2006).
Although the presence of O. celtica individuals has been recorded for Ireland, Scotland, South Wales, the Farne Islands, and south Devon, established populations of breeding individuals have been confirmed only for Cornwall and north Devon where it is an obligate crevice dweller on exposed rocky shores dominated by barnacles and mussels (Tween, Reference Tween1987; Kent, Reference Kent2017).
The life of O. celtica is centred around its crevice which acts as a refuge from physical stress and possibly predation (Chelazzi, Reference Chelazzi1990). A crevice may be occupied by multiple individuals that emerge during some ebb tides to forage over open rock grazing mainly on diatoms and macroalgae, especially Porphyra spp. and Enteromorpha spp., and also to find a mate (Tween, Reference Tween1987). Although O. celtica is a hermaphrodite capable of self-fertilization, it usually reproduces by cross-fertilization (Fretter, Reference Fretter1943; Tween, Reference Tween1987).
There are many reports on the foraging activities of intertidal gastropods, especially patellid limpets (e.g. Hartnoll & Wright, Reference Hartnoll and Wright1977; Hawkins & Hartnoll, Reference Hawkins and Hartnoll1983; Little, Reference Little1989; Evans & Williams, Reference Evans and Williams1991; Chelazzi et al., Reference Chelazzi, Santini and Della Santina1998; Gray & Hodgson, Reference Gray and Hodgson1998; Henninger & Hodgson, Reference Henninger and Hodgson2001; Santini et al., Reference Santini, Thompson, Tendi, Hawkins and Hartnoll2004), but few on O. celtica (Fretter, Reference Fretter1943; Tween, Reference Tween1987) and other onchidiids (Arey & Crozier, Reference Arey and Crozier1921, on Onchidium floridanum; McFarlane, Reference McFarlane1980, on Onchidium peronii; and Pepe & Pepe, Reference Pepe and Pepe1985, on Onchidella binneyi). Fretter's (Reference Fretter1943) observations were qualitative and incidental to her research on the functional morphology and embryology of O. celtica. Tween's thesis (Reference Tween1987) includes a study of a population of O. celtica foraging on a rocky reef at Trevone on the north Cornwall coast, but it was limited in spatial replication and temporal coverage.
We give the first detailed quantitative study of the timing and duration of foraging of a population of O. celtica individuals outside their crevice refuge during each emersion period of every semi-diurnal tide of two semi-lunar periods. Using time-lapse photography and image analysis software, we were able to make precise counts of the numbers foraging at specific times, enabling correlation with a range of environmental factors.
Our overall aim was to find out if a population of O. celtica exhibits distinct temporal patterns of foraging activity which can be correlated with the state of the tide, time of day, or the condition of the weather or the sea. Spatial aspects of foraging will be dealt with more fully in a separate paper.
MATERIALS AND METHODS
Study area
The study area was a moderately exposed rocky shore at Polzeath, north Cornwall (OS grid reference SW 935 794; GPS coordinates 50.5784°N 4.9189°W), characterized by the presence of mussels and barnacles.
Two contrasting mid-shore vertical slate outcrops 30 m apart and separated by an area of sandy substratum were selected for recording the foraging activity of O. celtica by time-lapse photography. The first outcrop (RC1) faces north-east, rises ~1 m above a sandy gulley about 3.5 m above Chart Datum, and levels off to a wave-cut platform. The substratum was relatively smooth slate with a sparse cover of macroalgae, barnacles and mussels. The second outcrop (RC2) was heavily encrusted with barnacles, rises 0.6 m almost vertically above a shallow rock pool (about 4 m above Chart Datum) and levels off to a horizontal wave-cut platform dominated by dense clusters of mussels. The average tidal emersion period of the slate outcrops was about 390 min.
Environmental data
Local weather data (air temperature, air pressure, solar irradiation, precipitation, relative humidity and wind speed) for each period of tidal emersion were obtained from a weather station at St Enodoc about one mile from the study area (weather data were accessed from the Weather Underground website, available at http://www.wunderground.com). Surf and wave data, and sunset and sunrise times were obtained from Magicseaweed webpages (http://magicseaweed.com) for Polzeath. Surf height is an estimate of the height of waves breaking on the shore and is based on ‘swell’ height, the height of unbroken waves as they approach the shore. Tidal data were obtained from predictions made by the UK Hydrographic Office for Newquay. The Newquay low tide times are on average about 10 min earlier than those for Polzeath.
Time of day
Throughout this study the local time of day, British Summer Time (BST), has been used. This is the time given in the sources of weather and tidal data, and sunrise and sunset times. At Polzeath, solar noon (the time at which the sun is at its highest altitude in the sky) was at 13:16 h BST between 12 May and 16 May 2015; at 13:17–13:18 h BST between 24 May and 6 June; and at 13:26 h BST between 24 July and 6 August 2015 (the time of solar noon at Polzeath was obtained from the website http://www.solar-noon.com).
Measuring foraging activity
Emerged individuals of O. celtica were recorded using time-lapse photography with waterproof digital cameras (Pentax Optio 80, and Ricoh WG20) during 60 periods of tidal emersion between May and September 2015. These recordings included all the consecutive periods of emersion at RC1 and RC2 during two spring-neap tidal cycles; the first between 24 May and 6 June, and the second between 23 July and 6 August.
The cameras were mounted on tripods placed firmly on the substratum in a stable position 0.75 m from the rock face and set to take images continuously at 1-min intervals for 360 min of the total period of emersion (about 390 min); image recording started only when the rocks became completely emersed and finished when the flood tide reached the entrance to the gulley. Automatic flash (white light) enabled images to be recorded during low light intensity and darkness. Analysis of movements before and after the electronic flash was switched on indicated that movements of O. celtica are not affected by very brief exposures to white light (see also Pepe & Pepe, Reference Pepe and Pepe1985, who showed that movements of Onchidella bineyi were not affected by flashlight). In the present investigation, recorded images were downloaded into Fiji, an Open Source platform for biological image analyses and tracking (Schindelin et al., Reference Schindelin, Arganda-Carreras, Frise, Kaynig, Longair, Pietzsch, Preibisch, Rueden, Saalfeld, Schmid, Tinevez, White, Hartenstein, Eliceiri, Tomancak and Cardona2012).
All O. celtica individuals found within a 0.5 × 0.5 m quadrat defined by four plastic studs inserted into each rock face, were labelled and counted manually on every 10th image recorded during an ebb tide. This gave the occurrence of O. celtica as number per 0.25 m2 at 10-min intervals after complete tidal emersion of the crevices.
At RC1 all O. celtica individuals 5 mm and longer that emerged from the shared home crevice were tracked at 1-min intervals using the Fiji manual tracking plug-in available on the Fiji platform. Distance data were calibrated using the Fiji scale against a known distance between two points on an image stack. This enabled measurements of total foraging distance and speed of foraging to be estimated. Each image frame was date- and time-stamped (with the local time, given as BST) so that the actual time of exit and re-entry could be determined. Onchidella celtica individuals foraging in the observation area at RC2 emerged from different crevices, some from outside the photographed area; these could not be tracked completely.
Statistical analyses and graphical representations of the results were made using Minitab 17 and R Studio for Mac (Gandrud, Reference Gandrud2013).
RESULTS
General observations
The group of O. celtica individuals sharing the same home crevice at RC1 made a total of 223 emergences during 60 ebb tides over three periods of consecutive tides (12 May–16 May; 24 May–6 June; 23 July–6 August). The maximum number of individuals observed emerging from the crevice during a single emersion period was 15. Full tracking from leaving the home crevice to re-entry was possible on 193 occasions.
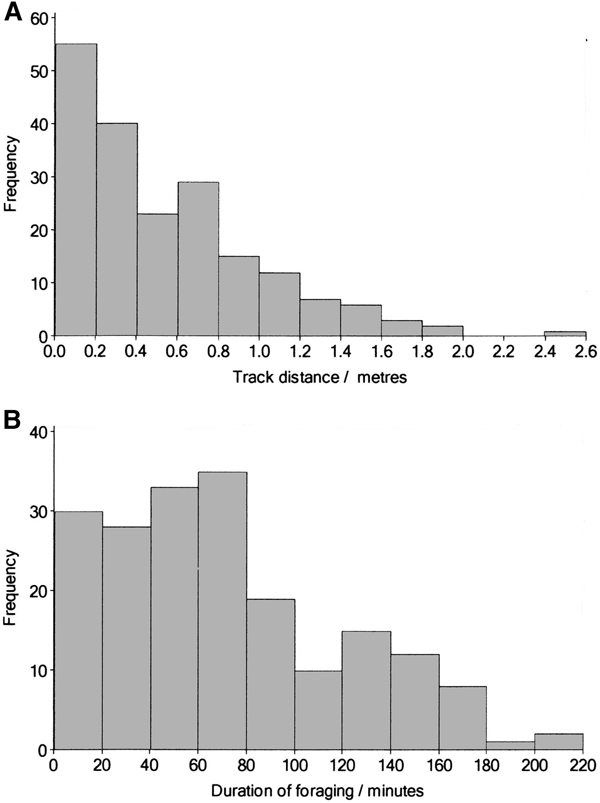
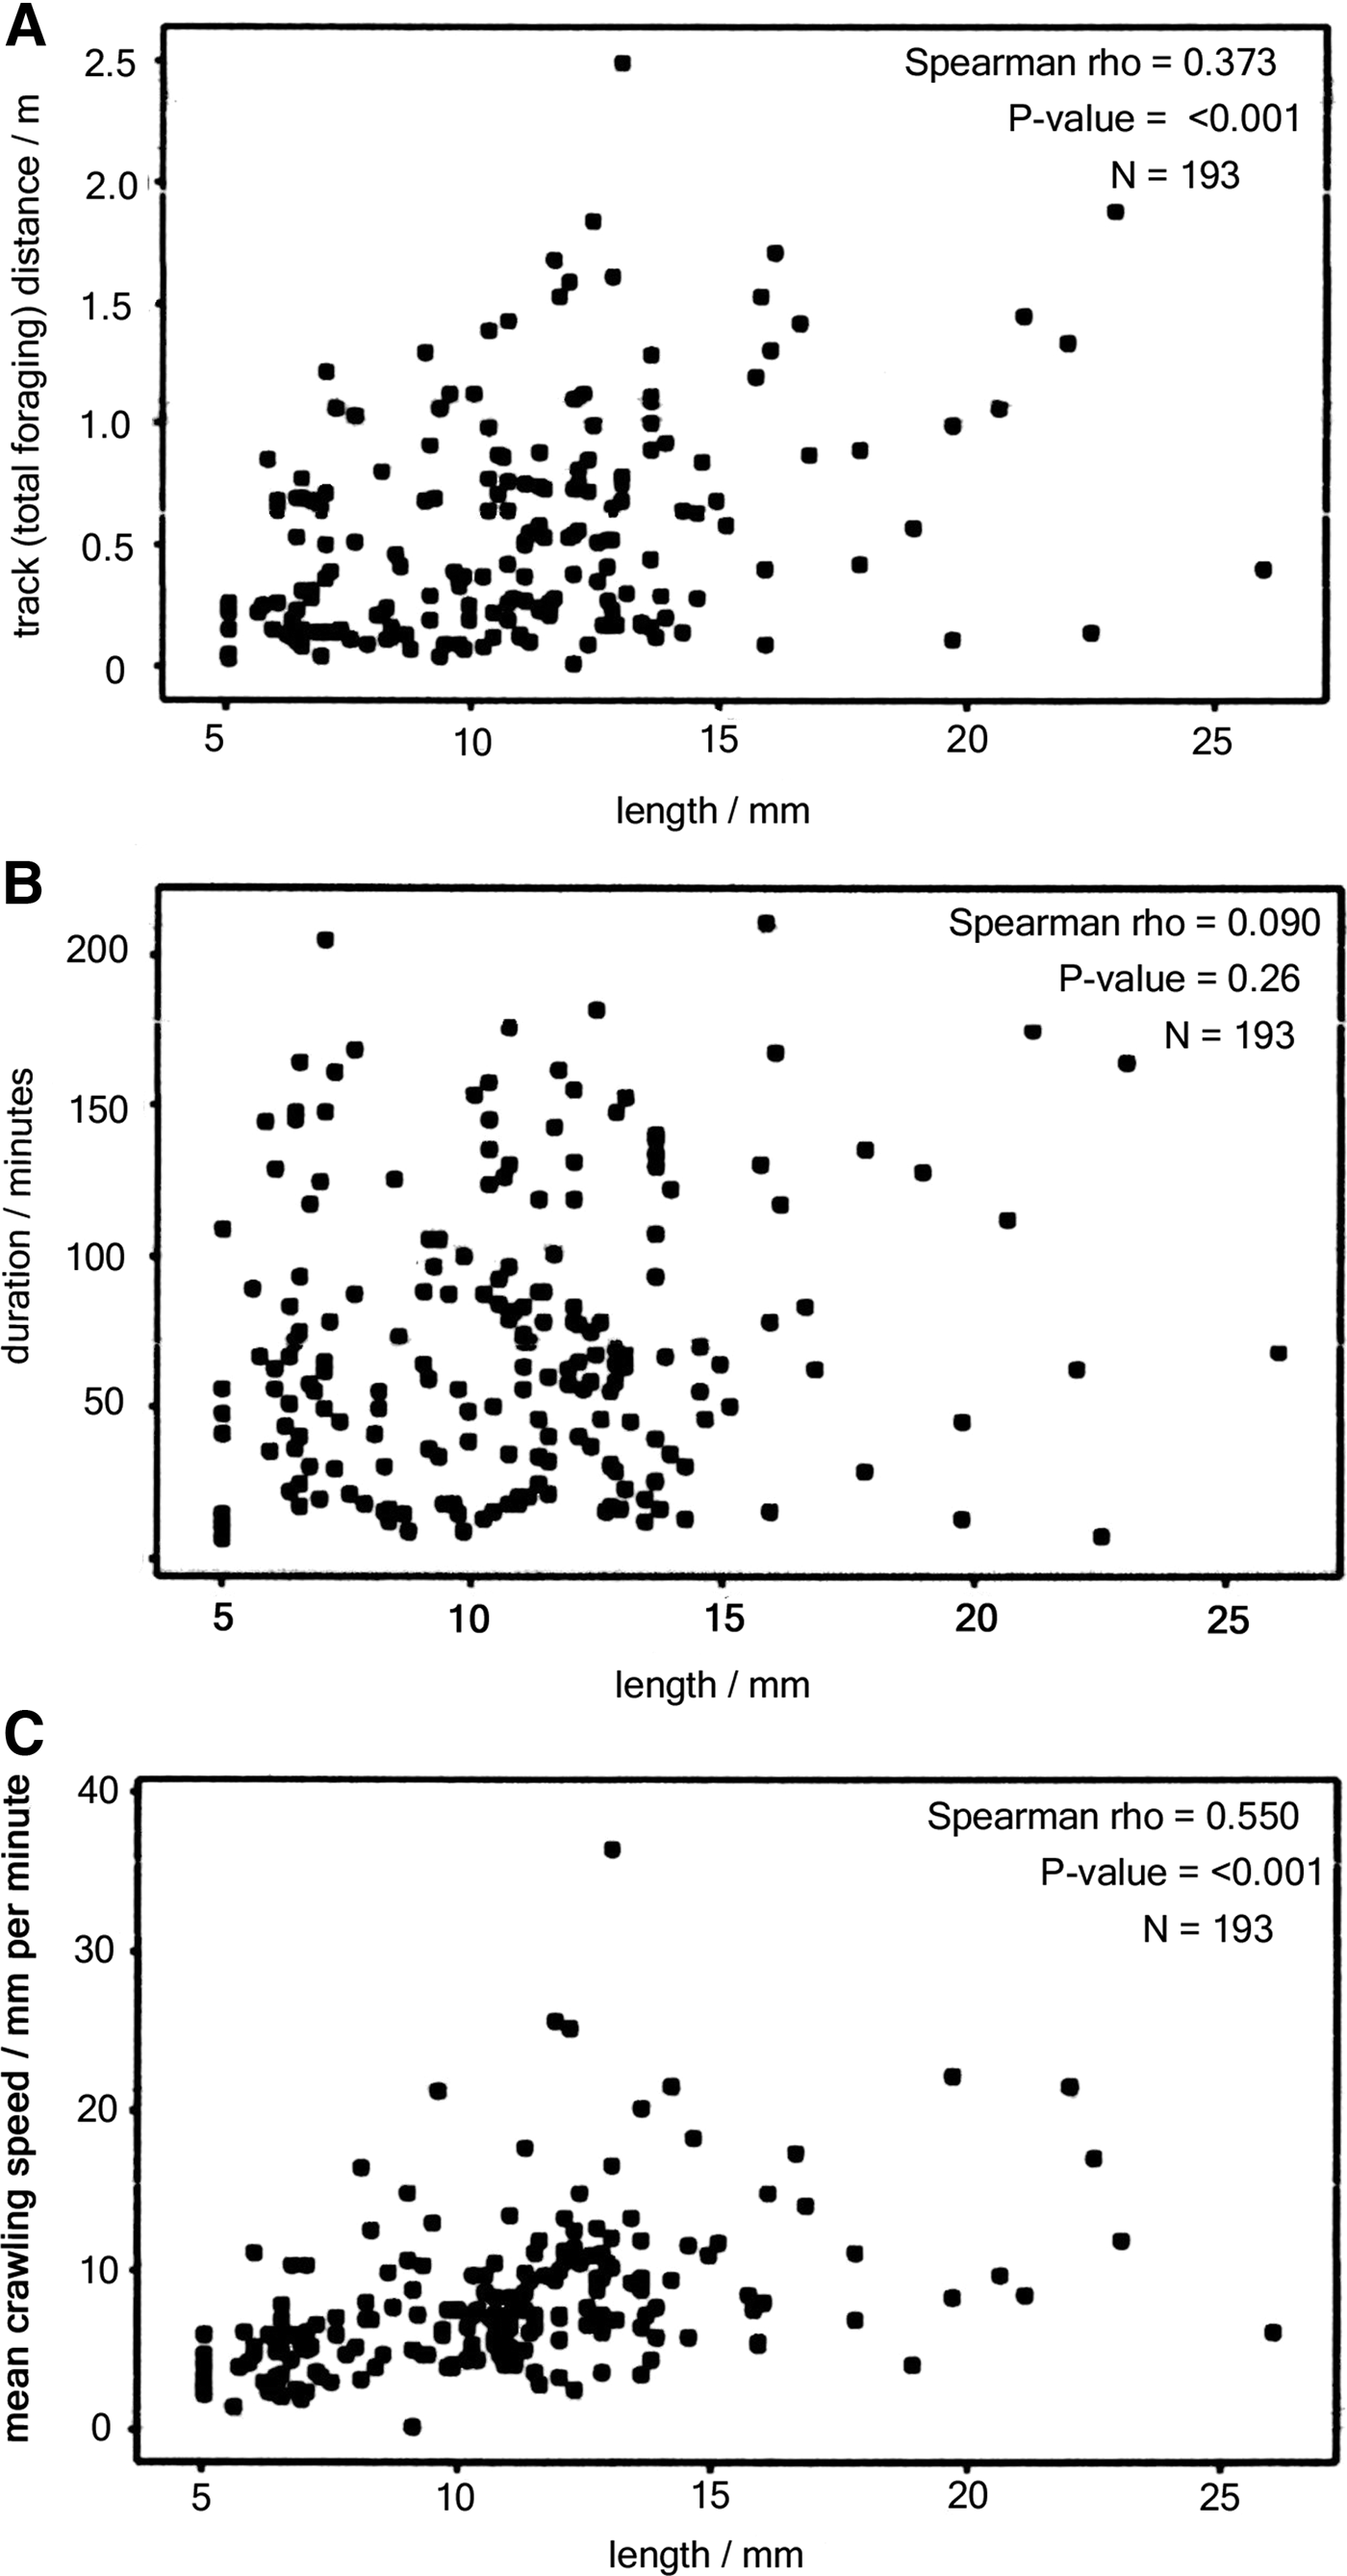
Total distance travelled and duration of emergence during a single emersion period varied greatly (Figure 1). Homing behaviour (re-entry of the crevice from which an onchidellid had emerged) was recorded for 216 (more than 96%) of 223 emergences at RC1. Estimates of animal length using image analysis software showed that there is a high level of variation of track distance, mean speed of crawling, and foraging duration, even for individuals of similar length (Figure 2).
Frequency of the total distance (A) and duration (B) of 193 onchidellid tracks recorded at RC1 during 60 ebb tides between 12 May and 6 August 2015.

Track distance, foraging duration, and mean crawling speed in relation to length of Onchidella celtica estimated from images of 193 tracks made by individuals emerging from RC1 between 12 May and 6 August. (A) Track distance (y) against onchidellid length (x). (B) Foraging duration (y) against onchidellid length (x). (C) Mean crawling speed (y) against onchidellid length (x).

Speed and time partitioning of foraging
At RC1, the mean speed of crawling for a foraging period was highly variable, even for O. celtica individuals of similar length (Figure 2C). Many exhibited periods of inactivity or very slow movement (crawling speed less than 5 mm per minute) with intermittent bouts of more rapid movement. On some occasions individuals could be observed moving in and around the entrance to the crevice without emerging completely.
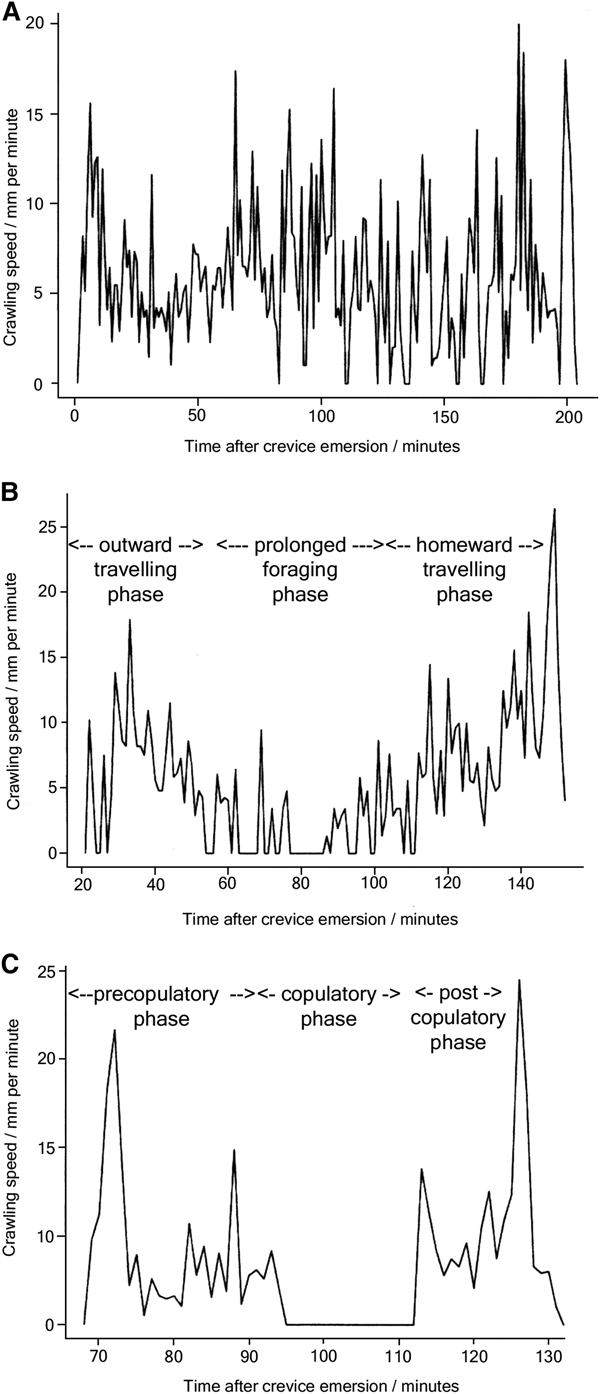
Crawling speed within foraging periods was also highly variable. There was no single discernible pattern of partitioning of time between travelling (indicated by periods of fast crawling speed) and intense foraging (indicated by periods of slow crawling speed). Intense foraging could occur towards the beginning, during the middle or towards the end of emergence (Figure 3A). Only 21 out of 223 foraging trips could be divided into three clear phases: an outward travelling phase followed by a prolonged foraging phase and a terminal period of return travel to the home crevice (Figure 3B). A prolonged foraging phase was identified by its having several periods of no movement or slow movement, with each period being more than 5 min duration and occurring close together. The duration of a prolonged foraging phase ranged from 20 min to 50 min. The 21 triphasic trips include four during which copulation was recorded: these trips were clearly divided into three phases: pre-copulatory, copulatory and post-copulatory (Figure 3C).
Changes in crawling speed of individual Onchidella celtica during single periods of emergence from RC1. (A) An example of changes in crawling speed of a non-mating individual that follows no clearly discernible pattern (based on a single track made by a 7 mm long individual that emerged at 13:51 h on 24 May 2015). (B) An example of changes in crawling speed of non-mating individuals that follow a triphasic pattern (based on single track made by a 12 mm long individual that emerged at 19:39 h on 30 May 2015). (C) An example of changes in crawling speed of mating individuals that follow a triphasic pattern (based on a single track made by a 12.8 mm long individual that emerged at 18:30 h on 13 May 2015).

Mating
At RC1, observations using time-lapse photography started on 12 May. The first mating was recorded on 13 May, and the last on 6 June. No matings were recorded at RC1 during the semi-lunar period from 23 July to 6 August. There were 170 tracks when no mating occurred and 28 tracks when mating was clearly taking place. On occasions when mating was observed, not all animals appeared to mate (e.g. on 15 May, six out of eight O. celtica individuals that had emerged were recorded mating, two were not recorded mating). The mean duration of emergence of mating O. celtica individuals was 100.5 min (SD = 38.5). It was significantly longer (t-test, t = −4.24, P = <0.001; DF = 41) than duration of emergence for non-mating individuals (mean 66.0 min; SD = 46.8).
Exit and re-entry times
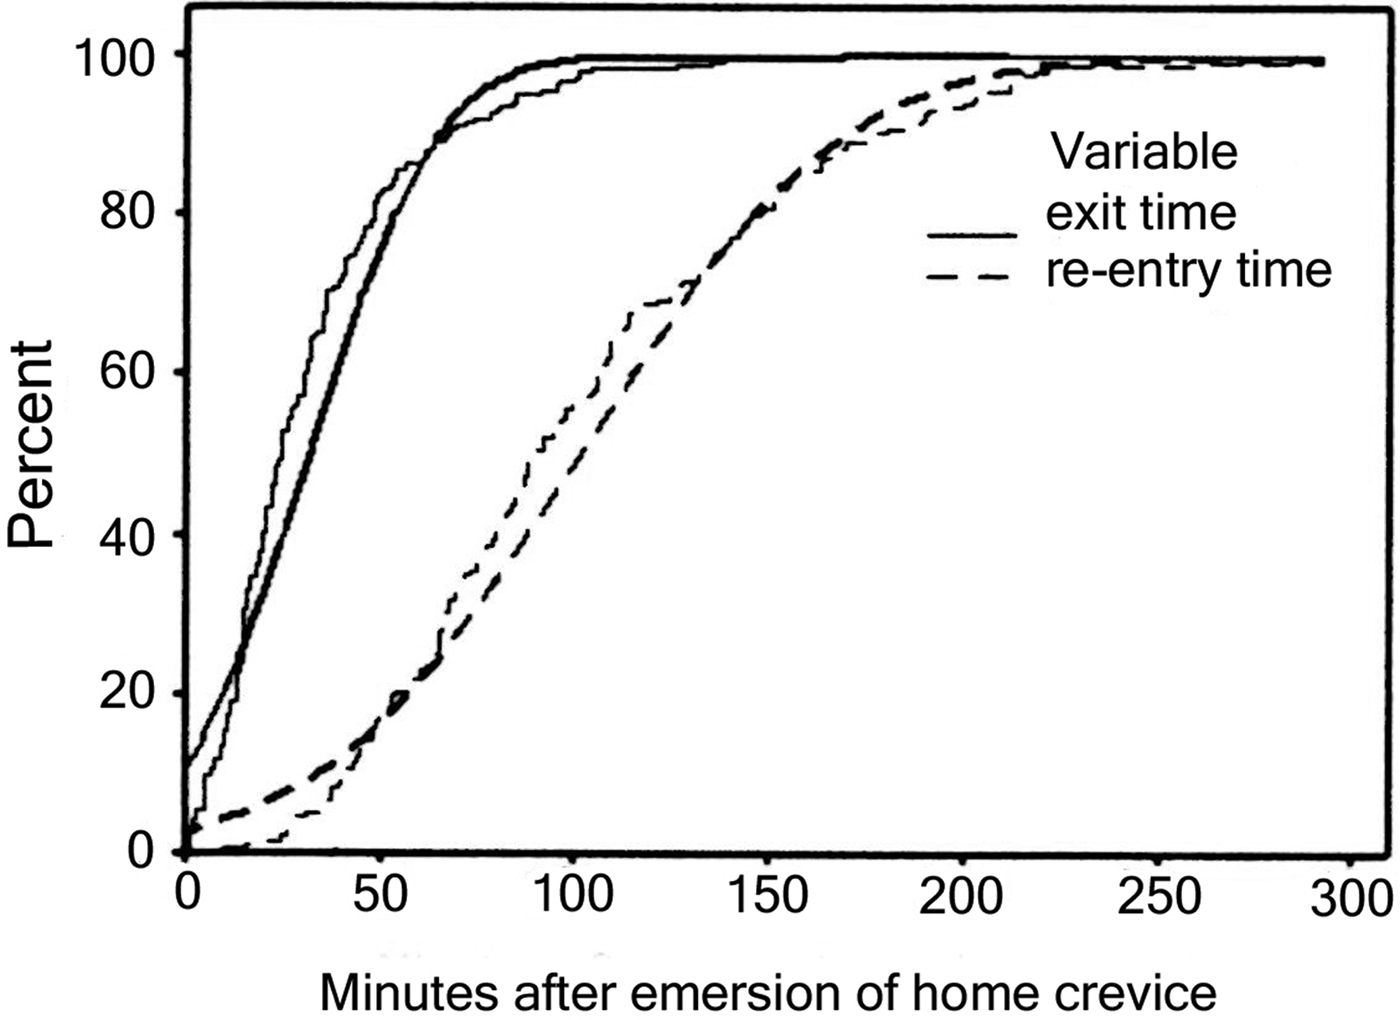
At RC1, the exit time (the time of emergence expressed as number of minutes after tidal emersion of the crevice) of O. celtica individuals ranged from 1 min to 135 min. However, most emerged within 30 min of tidal emersion. Emerged individuals usually re-entered their home crevice before the time of low tide, which was about 195 min after the crevice was first exposed to air and about 195 min before the crevice was immersed by the incoming tide (Figure 4).
Empirical Cumulative Distribution Function (CDF) graph comparing the distribution of exit times and re-entry times of 193 tracks made by Onchidella celtica individuals emerging from RC1 between 12 May and 6 August. Fitted normal CDF plots (smooth lines) are shown alongside the empirical CDF plots (jagged lines).

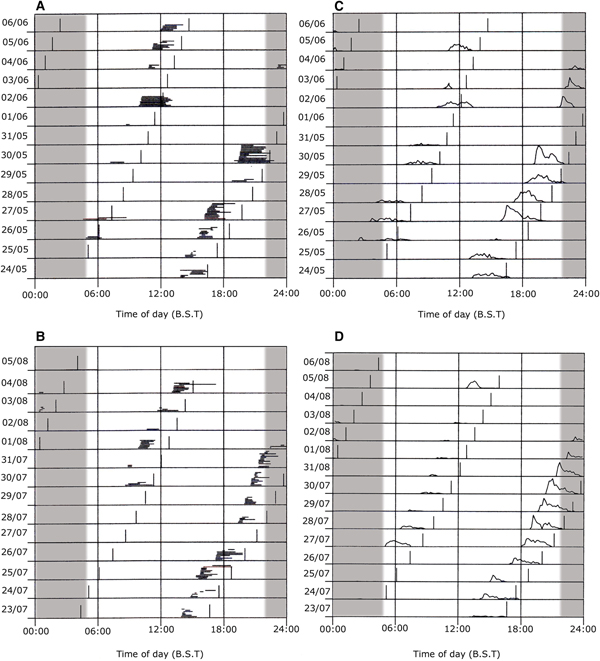
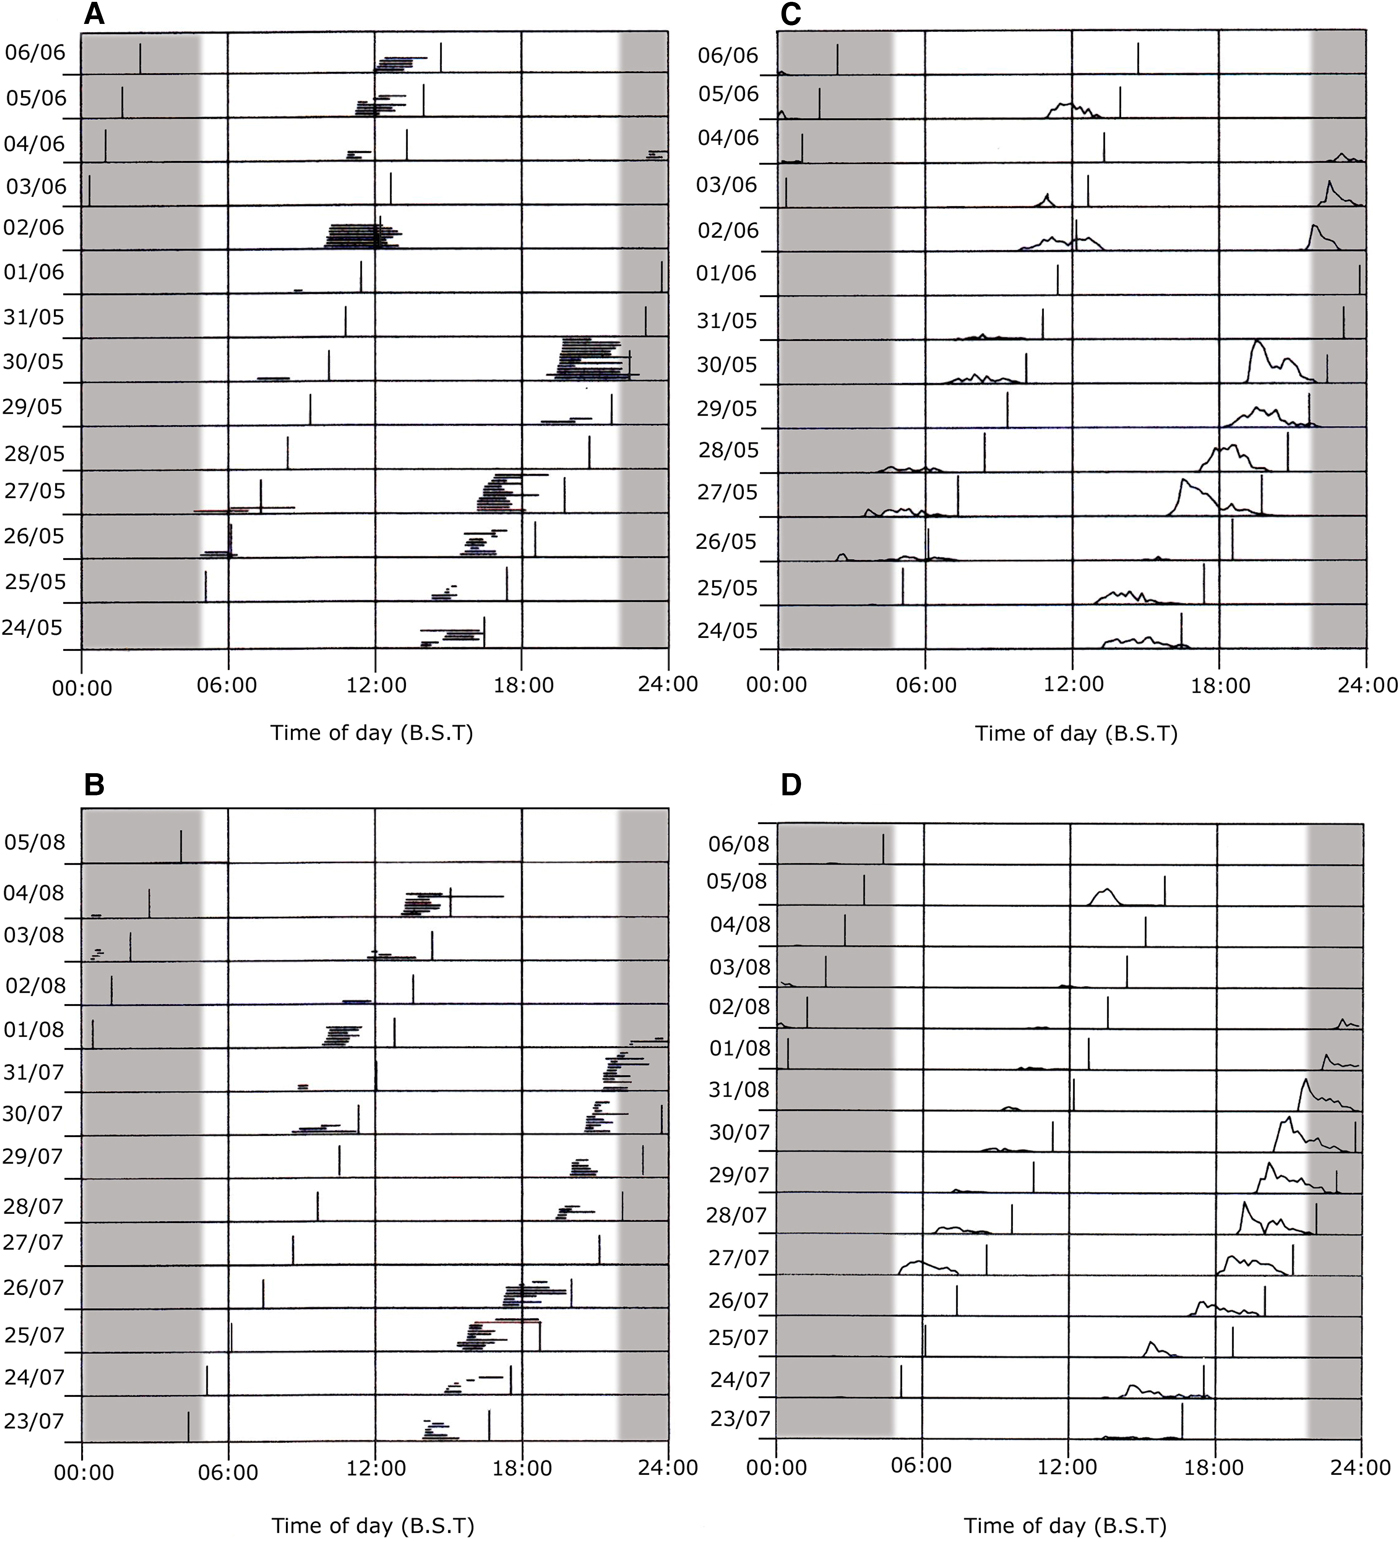
Although exit times varied greatly from one tide to the next, there was greater synchronicity during a single tide. Typically, during periods of high emergence, the number of animals on the open rock increased sharply soon after the crevice was exposed to air by the ebbing tide, and then decreased slowly as the animals completed their foraging and returned to the crevice (Figure 5C, D).
Time of day and foraging activity of a population of Onchidella celtica during ebb tides at Polzeath. (A) for the group of O. celtica recorded at RC1 between 24 May and 6 June; (B) for the group of O. celtica recorded at RC1 between 23 July and 6 August; (C) for O. celtica recorded at RC2 24 May and 6 June; (D) for the group of O. celtica recorded at RC1 between 23 July and 6 August. Each horizontal line (____) in A and B shows the period of foraging activity of individuals. In C and D the number of individuals foraging at 10-min initervals during each observation period is plotted. The area shaded grey indicates the approximate period of twilight and darkness, from sunset to sunrise. The unshaded area indicates the approximate period of daylight, from sunrise to sunset. The staggered vertical lines show the time of low tide. BST, British Summer Time. Solar noon was at 13:17 h–13:18 h between 24 May–6 June; and at 13:26 h between 24 July–6 August.
Semi-lunar cycle
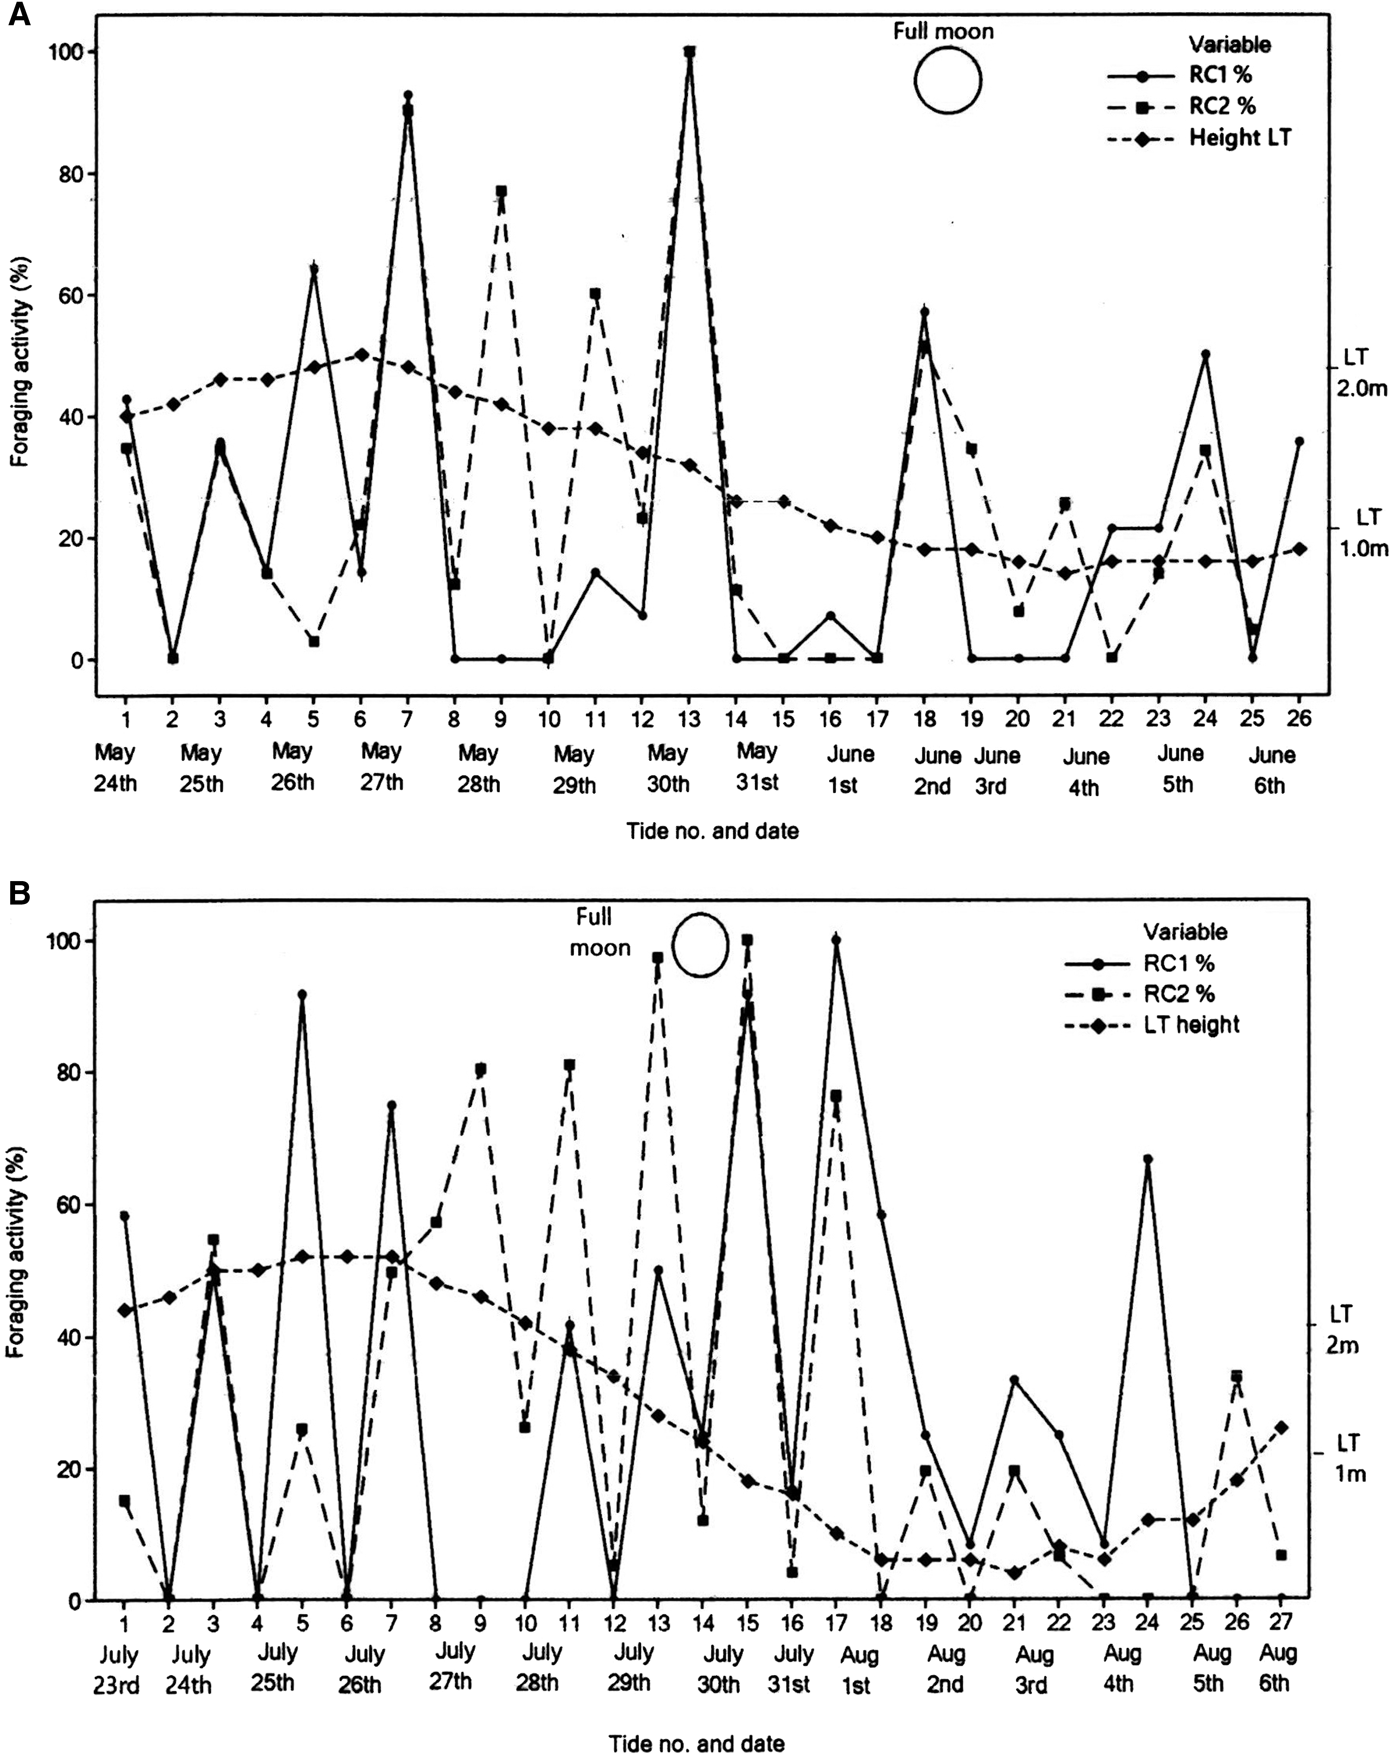
The proportion emerging (expressed as a percentage of the maximum number of O.celtica individuals recorded at any one time) varied from one ebb tide to the next (Figure 6). The maximum number observed at any one time was 15 for RC1 and 45 for RC2. Although the patterns of emergence of the populations of O. celtica at the two sites were similar, they are not identical: on some ebb tides, percentage emergence was high at one site and low at the other. The correlation between the numbers emerging at the two sites was significant and positive, but not strong (Spearman rho = 0.44; P-value = 0.001; N = 52). During any single period of tidal emersion, the maximum number of O. celtica individuals occurring on the open rock was usually only a small proportion of the total population. For RC1, the maximum had a mean of 3.6 (24% of the maximum number of 15 for all ebb tides). On 20 out of the 60 ebb tides studied, none emerged. The longest continuous period of non-emergence was three consecutive tides. For RC2, the maximum number of O. celtica individuals observed during a single ebb tide had a mean of 13.3 (29% of the maximum number of 45 for all ebb tides). On seven out of 52 ebb tides studied, no O. celtica individuals were observed in the 0.5 × 0.5 m observation area.
Foraging activity of Onchidella celtica at Polzeath: (A) for 26 consecutive ebb tides (numbered 1–26 on the x-axis) from 12 May to 6 June (full moon 2 June); (B) for 27 consecutive ebb tides (numbered 1–27 on the x-axis) from 23 July to 6 August 2015 (full moon 31 July). Foraging activity is expressed as a percentage of the maximum number of O. celtica recorded at any one time during an emersion period in the 0.25 m2 quadrat at RC1 ( ; maximum = 15) and in the 0.25 m2 quadrat at RC2 (
 ; maximum = 45).

Tidal height
During the two semi-lunar periods, there was no significant correlation between tidal height at low tide and number of O. celtica individuals foraging at RC1 (Spearman rho = −0.04; P-value = 0.78; N = 52) or RC2 (Spearman rho = 0.09; P-value = 0.52; N = 52). Emergence varied greatly throughout the neap-spring tidal cycle with no clear pattern (Figure 6).
Weather
During the two semi-lunar periods, the number of individual O. celtica emerging at RC1 was not correlated significantly with wind speed (Spearman rho = −0.17; P-value = 0.23; N = 52), solar radiation (Spearman rho = 0.32; P-value = 0.02, N = 52) air pressure (Spearman rho = 0.21; P-value = 0.14; N = 52), relative humidity (Spearman rho = −0.0029; P-value = 0.98, N = 52) or air temperature (Spearman rho = 0.28; P-value = 0.05; N = 52). However, no O. celtica individuals emerged when temperatures were below 10.5°C. The number of tides during which rain coincided with emersion of the crevices was only seven out of 52; O. celtica individuals were observed foraging during three of these periods of precipitation.
Time of day
Estimates of foraging activity during consecutive tidal emersions of the two semi-lunar periods (Figure 5), indicate that foraging activity can take place during hours of darkness and light, but that highest levels of foraging activity tend to take place in the afternoon and evening ebb tides.
Surf height
The study area faces west exposing it to the full force of Atlantic swells. Waves breaking over the expansive area of flat sand can create surf heights exceeding 4.6 m. During the ebb tides of the two semi-lunar periods, the surf height just before the ebb tide exposed the home crevices to air, ranged from 0.3 m to ~3.7 m (4 August), with a mean of 1.6 m.
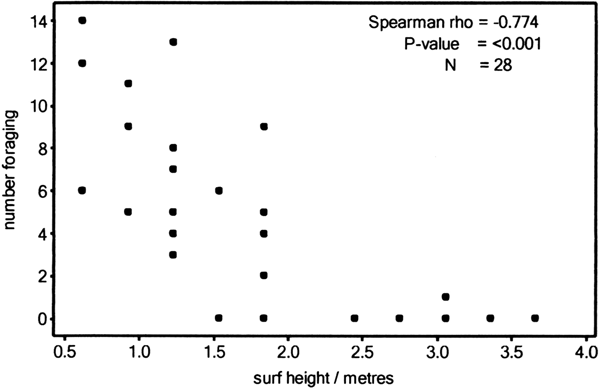
At RC1, the correlation between surf height and foraging activity is relatively weak when all 24 h of a day are considered (Spearman rho = −0.402; P-value = 0.003; N = 52). But when the relationship is tested only for times between 12 : 00 h and 23 : 59 h (Figure 7), the negative correlation is much stronger (Spearman rho = −0.774; P-value = <0.001; N = 28). At RC2, the negative correlation between numbers observed and surf height during the two semi-lunar periods is not significant when all 24 h of a day are considered (Spearman rho = −0.077, P-value = 0.5854; N = 52), and remains weak between 12:00−23:59 h (Spearman rho = −0.3; P-value = 0.104; N = 28).
Surf height and the foraging activity at RC1 for Onchidella celtica individuals that had exit times between 12:00 h and 23:59 h BST.

DISCUSSION
We show that O. celtica individuals longer than 5 mm are most likely to be found foraging outside their crevice refuge during an ebb tide between 30 min and 60 min after the home crevice has been first exposed to air. Such foraging can occur at most hours of the day and night but is more likely in the late afternoon or evening. Foraging is negatively correlated with surf height, suggesting that O. celtica is sensitive to the prolonged periods of alternating emersion and immersion that occur during an ebb tide when the surf is high. No other distinct temporal patterns of foraging activity were detected; there was no significant correlation between foraging outside the crevice and the state of the tide or the condition of the weather or the sea. This suggests that foraging outside the crevice is controlled by an interaction of several internal and external factors.
The lack of a significant correlation between foraging activity and the spring-neap tidal cycle contrasts markedly with results for Onchidella binneyi that inhabits the upper intertidal zone of rocky shores in the Gulf of California. Onchidella binneyi was inactive during neap tides, with activity increasing with intensity until it reaches its maximum at the lowest spring tide (Pepe & Pepe, Reference Pepe and Pepe1985).
Our conclusion that the foraging activity of O. celtica individuals outside the crevice is highly variable and not easy to predict has implications for anyone searching a shore for this species. It may not be found even on shores where it is abundant, especially if searches are carried out before noon. The risk of false negative results is especially important for surveys in which O. celtica is included as one of a suite of potential climate change indicator species (Simkanin, Reference Simkanin2004; Mieszkowska et al., Reference Mieszkowska, Leaper, Moore, Kendall, Burrows, Lear, Poloczanska, Hiscock, Moschella, Thompson, Herbert, Laffoley, Baxter, Southward and Hawkins2005).
The crevice habitat of O. celtica
Onchidella celtica spends most of its life taking refuge in a crevice. Morphologically, it is not well-adapted to foraging on intertidal rocks exposed to wave action: it has no shell, making it susceptible to desiccation stress during periods of emersion; it has only poor powers of adhesion, making it easily dislodged by water movements. It is readily removed from rocks with little force (personal observations, RMLK), with Tween (Reference Tween1987) reporting that its tenacity is so weak that it might be dislodged by strong gusts of wind. Taking refuge in a crevice is essential for its survival: humidity is high (Kensler, Reference Kensler1967) and, when in a crevice, O. celtica avoids extremes of temperature and dislodgement by tidal currents and waves. Taking refuge in a crevice also reduces the risk of predation, but this is probably not as important for O. celtica as some other crevice dwellers because its neurotoxin-secreting repugnatorial glands and leathery skin mean that it has few if any predators (Tween, Reference Tween1987; Abramson et al., Reference Abramson, Radic, Manker, Faulkner and Taylor1989; Pinchuck & Hodgson, Reference Pinchuck and Hodgson2010).
Onchidella celtica and foraging patterns
A triphasic pattern of foraging has been reported for patellid limpets (Hartnoll & Wright, Reference Hartnoll and Wright1977; Evans & Williams, Reference Evans and Williams1991; Davies et al., Reference Davies, Edwards and Williams2006), but less than 10% of O. celtica conformed to this pattern. The most distinctly triphasic tracks were made by mating individuals that moved little during the middle period of emergence when they were copulating and not feeding.
Santini et al. (Reference Santini, Ngan, Burrows, Chelazzi and Williams2014), using the intertidal grazing limpet Cellana grata, have developed a state dependent dynamic model for the temporal organization of foraging in a cyclic environment. The model has 24 parameters, including size of the grazer, food supply, and gut processing, alongside the energetic costs of foraging and mortality risks. These parameters are all likely to be relevant to the foraging activity of O. celtica, but there are insufficient data to use the model to predict foraging activity of O. celtica at Polzeath. Emergence from its crevice refuge has more than one function for O. celtica (i.e. to find and ingest food, and to find a mate). This makes onchidellid foraging difficult to model. Nevertheless, the tendency of O. celtica individuals to forage more towards the end of a daylight period suggests that food supply is a particularly important parameter. For grazers that feed on unlimited resources and, like O. celtica, forage for a restricted period each day it is more profitable to feed at the end of each daylight period when algal biomass is at its maximum than at the start of the daylight period when it is at its minimum (Little, Reference Little1989). Foraging towards the end of the day may also reduce desiccation stress by minimizing evaporative water loss.
The observation that foraging O. celtica individuals usually return to their home crevice before the time of low tide, and that they may remain in their refuge for prolonged periods, indicates that gut processing of food obtained after a foraging session is also important. Onchidella celtica does not secrete cellulase, therefore it requires long periods of inactivity to digest its mainly herbivorous diet (Fretter, Reference Fretter1943). When foraging, individuals may fill their gut with silica- and cellulose-rich material and return to their refuge to digest the material while at rest. Sand grains in the triturating gizzard are a key feature of the digestive tract (Fretter, Reference Fretter1943); they probably play an essential role in grinding the food and ripping apart silica cases of diatoms and thick cellulose cell walls of macroalgae.
The delay of emergence (or non-emergence) during periods of high surf, and re-entry usually before the time of low tide, indicate that minimizing the risk of dislodgement by tidal currents and waves as the tide retreats is an important factor in determining when O. celtica individuals forage. The negative correlation between foraging activity and surf height at RC1 is stronger than at RC2 probably because at RC1 the population of O. celtica occupies crevices on the sides of a gulley through which surf surges, whereas the population at RC2 occupies crevices on a rock face partly protected by an adjacent wave-cut platform.
Limitations of this study
Time-lapse photography of O. celtica individuals occurring outside crevices during periods of tidal emersion may not provide a complete record of its foraging activity. At Polzeath, individuals were recorded foraging around the margins of crevices without emerging fully, confirming observations made by Tween (Reference Tween1987) and Fretter (Reference Fretter1943). Foraging activity probably takes place within the crevice as well as around its margins; this was not observable in the present study.
It is assumed that O. celtica and other onchidellid species that take refuge in a crevice do not feed when immersed in seawater. This is because their lungs are unable to function under water and they depend on diffusion of gases through the mantle surface which, it is assumed, cannot meet the high metabolic demands of foraging (Fretter, Reference Fretter1943; Denny, Reference Denny1980; Pepe & Pepe, Reference Pepe and Pepe1985). However, personal observations (RMLK) of O. celtica individuals kept in an aquarium filled with fully saline seawater, show that they can move underwater and forage on material growing on the aquarium walls. Therefore, O. celtica individuals may forage in the refuge and around its margins when covered by tidal water, as well as when exposed to air. This suggestion is supported by the observation that some onchidellid guts are partially filled with food when they first emerge from a crevice (Tween, Reference Tween1987).
In our study, weather data pertained to the whole of Polzeath. There are no data available for the microclimate in and around the home crevice. As in the pulmonate Siphonaria pectinata (Ocana & Emson, Reference Ocana and Emson1999), it is likely that the local environmental conditions (especially humidity and temperature) experienced by O. celtica individuals play a much more significant role in controlling foraging than the wider environmental conditions.
Our results are limited to only one rocky shore. It is likely that, as with other intertidal gastropods (Hawkins & Hartnoll, Reference Hawkins and Hartnoll1983; Little, Reference Little1989; Evans & Williams, Reference Evans and Williams1991; Santini et al., Reference Santini, Thompson, Tendi, Hawkins and Hartnoll2004; Santini et al., Reference Santini, Ngan and Williams2011), populations of O. celtica on different shores will exhibit different temporal patterns of foraging activity. Further investigations are therefore required before any generalizations about the temporal patterns of foraging activity of O. celtica can be made.
ACKNOWLEDGEMENTS
RMLK would like to thank Dr Simon D. Rundle and Dr Oliver Tills of Plymouth University for their help in the planning stages of this study, and to Dr Oliver Tills for showing RMLK how to use Fiji software to track the movements of O. celtica.
FINANCIAL SUPPORT
This research received no specific grant from any funding agency, commercial or not-for-profit sectors.