1 Introduction
Spreading of a liquid droplet over a flat or curved surface is a common phenomenon in nature and technology, which is relevant to many practical applications ranging from spreading of droplets, lubricants and coatings to microfluidic devices, inkjet printing and the extraction of oil from sandstone by injecting water or gas (Bonn et al.
Reference Bonn, Eggers, Indekeu, Meunier and Rolley2013; Snoeijer & Andreotti Reference Snoeijer and Andreotti2013). Droplet spreading over an ambient solid surface is complicated and not well understood, because it involves the motion of a contact line (CL) at the edge of the spreading droplet. A moving CL between the liquid interface and solid surface is incompatible with the no-slip boundary condition and would lead to unphysical infinite dissipation (Dussan & Davis Reference Dussan and Davis1974). As a classical example of the moving CL problem, droplet spreading is an outstanding problem in interfacial dynamics and has been with us for many years (de Gennes Reference de Gennes1985; Leger & Joanny Reference Leger and Joanny1992; Decker & Garoff Reference Decker and Garoff1997; Quéré Reference Quéré2008; Bonn et al.
Reference Bonn, Eggers, Indekeu, Meunier and Rolley2013; Snoeijer & Andreotti Reference Snoeijer and Andreotti2013; Ramiasa et al.
Reference Ramiasa, Ralston, Fetzer and Sedev2014). The CL dynamics is known to be extremely sensitive to the physical roughness and/or chemical heterogeneity on the solid surface, which cause the dynamic contact angle
 $\unicode[STIX]{x1D703}$
between the liquid and solid surfaces to depend on the direction of fluid motion (Leger & Joanny Reference Leger and Joanny1992), with the advancing contact angle
 $\unicode[STIX]{x1D703}_{a}$
being larger than the receding angle
 $\unicode[STIX]{x1D703}_{r}$
.
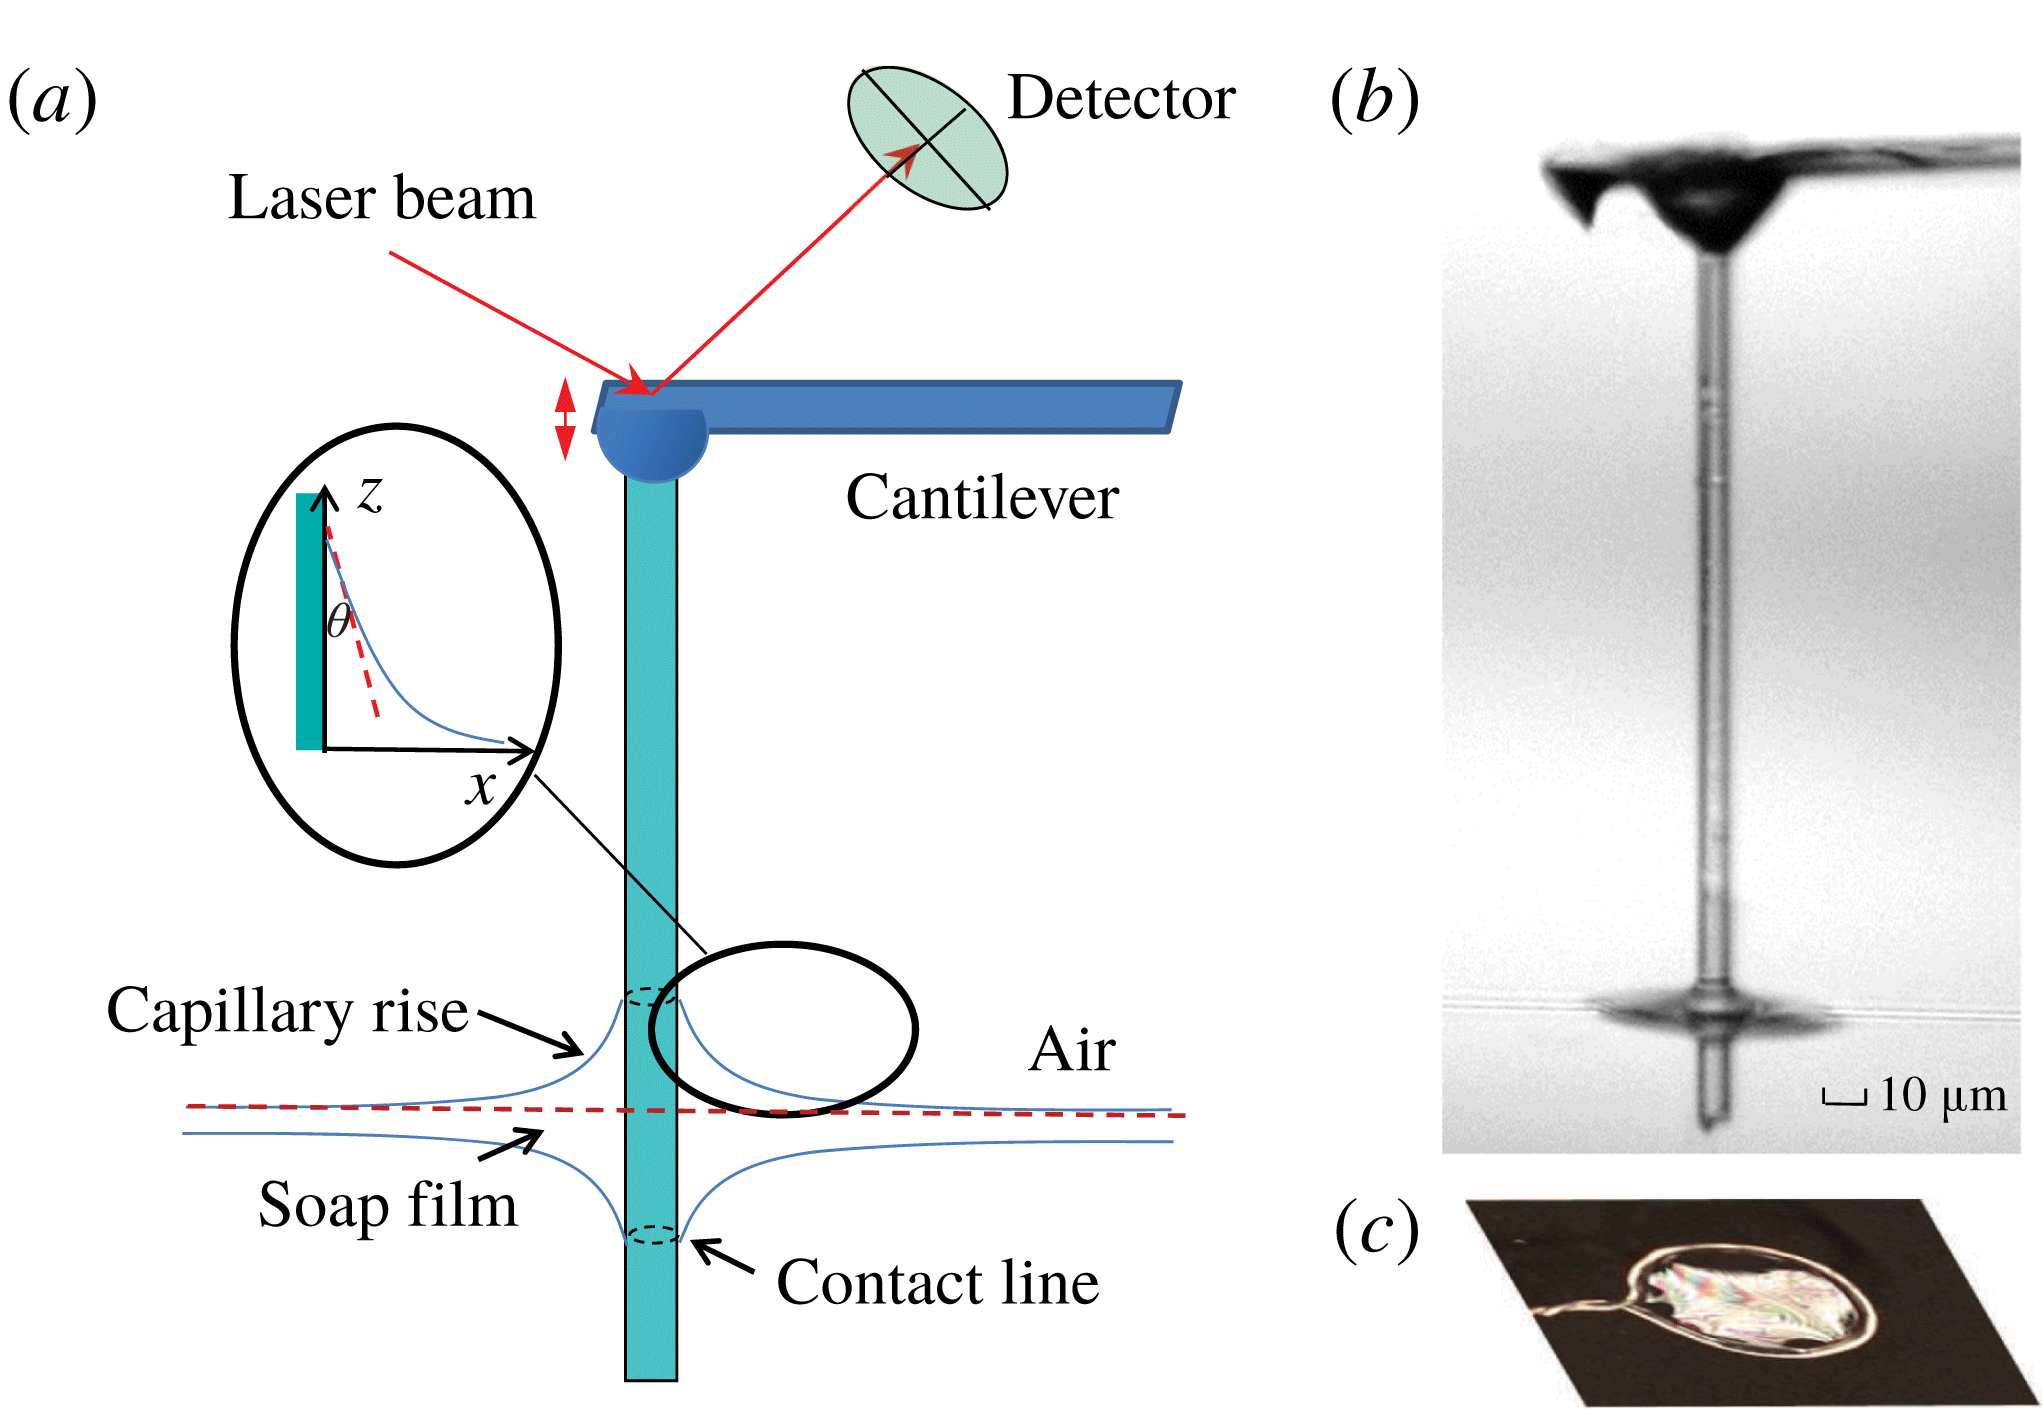
(a) Sketch of the atomic force microscopy (AFM)-based hanging fibre probe intersecting a thin soap film. The dashed circles on the fibre surface show the two contact lines formed on each side of the soap film. Inset shows the geometry near the contact line and the coordinate system used in the experiment. (b) A microscope picture of a glass fibre of diameter
 $d=8~\unicode[STIX]{x03BC}\text{m}$
and length
 ${\sim}300~\unicode[STIX]{x03BC}\text{m}$
intersecting a thin soap film. (c) A metal ring of diameter 1 cm is used to support a soap film.

The dynamics of spreading of a wetting liquid on an ambient solid surface is a relaxation process for the liquid interface to reach its equilibrium shape. In addition to the difficulty involved in the solution of a moving CL at the edge of the advancing liquid, the behaviour of the liquid in the vicinity of the CL presents further complications. The hydrodynamic friction coefficient per unit length,
 $\unicode[STIX]{x1D709}_{in}/S$
, in the wedge-shaped region away from the CL (see the inset of figure 1
a) has the form (de Gennes, Brochard-Wyart & Quéré Reference de Gennes, Brochard-Wyart and Quéré2004)
 $$\begin{eqnarray}\unicode[STIX]{x1D709}_{in}/S\simeq \frac{3\ln \unicode[STIX]{x1D700}}{\unicode[STIX]{x1D703}}\unicode[STIX]{x1D702}\equiv \unicode[STIX]{x1D6FC}_{in}\unicode[STIX]{x1D702},\end{eqnarray}$$
for liquids with a small contact angle
 $\unicode[STIX]{x1D703}$
. In the above,
 $S$
is the contact line length,
 $\unicode[STIX]{x1D702}$
is the fluid viscosity and
 $\unicode[STIX]{x1D700}\simeq R/a$
is a cutoff parameter with
 $R$
being a characteristic length of the system and
 $a$
(
 ${\sim}1~\text{nm}$
) being a microscopic cutoff length to avoid the dissipation divergence of the moving CL. For the problem of droplet spreading,
 $R$
would be the radius of the droplet and
 $S=2\unicode[STIX]{x03C0}R$
. The value of
 $\unicode[STIX]{x1D6FC}_{in}$
in (1.1) is
 $\unicode[STIX]{x1D6FC}_{in}\simeq 27.6/\unicode[STIX]{x1D703}$
(for
 $\unicode[STIX]{x1D700}\simeq 10^{4}$
), which is very large for liquids with small
 $\unicode[STIX]{x1D703}$
and even becomes divergent when
 $\unicode[STIX]{x1D703}\rightarrow 0$
.
For liquid drops of radius
 $R$
smaller than the capillary length
 $\unicode[STIX]{x1D706}_{c}=(\unicode[STIX]{x1D6FE}/\unicode[STIX]{x1D70C}g)^{1/2}$
, which is a measure of importance of the liquid–air interfacial tension
 $\unicode[STIX]{x1D6FE}$
relative to the gravitational force
 $\unicode[STIX]{x1D70C}g$
, the effect of gravity can be ignored and liquid spreading is driven primarily by the imbalanced interfacial force per unit length normal to the CL (Snoeijer & Andreotti Reference Snoeijer and Andreotti2013; Wang et al.
Reference Wang, Guo, Chen and Tong2016),
 $$\begin{eqnarray}F_{d}=\unicode[STIX]{x1D6FE}(\cos \unicode[STIX]{x1D703}-\cos \unicode[STIX]{x1D703}_{eq})\simeq \frac{\unicode[STIX]{x1D6FE}}{2}\unicode[STIX]{x1D703}^{2}.\end{eqnarray}$$
The last equality in (1.2) is obtained by assuming that the dynamic contact angle
 $\unicode[STIX]{x1D703}$
is small and equilibrium contact angle
 $\unicode[STIX]{x1D703}_{eq}=0$
. For a water–air interface with
 $\unicode[STIX]{x1D6FE}\simeq 73~\text{mN}~\text{m}^{-1}$
, liquid density
 $\unicode[STIX]{x1D70C}=10^{3}~\text{kg}~\text{m}^{-3}$
and gravitational acceleration
 $g=9.8~\text{m}~\text{s}^{-2}$
, we have
 $\unicode[STIX]{x1D706}_{c}\simeq 2.7~\text{mm}$
. In the simple case when the solid surface is smooth and homogeneous so that CL pinning can be ignored, the approach to equilibrium is determined by a balance between the capillary force given in (1.2) and viscous dissipation given in (1.1). This force balance gives rise to a power-law relaxation as manifested by Tanner’s law,
 $R(t)\sim t^{m}$
, for the viscous spreading of small liquid drops of radius
 $R(t)$
as a function of time
 $t$
(Tanner Reference Tanner1979; de Gennes et al.
Reference de Gennes, Brochard-Wyart and Quéré2004). The power-law exponent
 $m=1/10$
was observed in various spreading experiments (Bonn et al.
Reference Bonn, Eggers, Indekeu, Meunier and Rolley2013).
For many ambient solid surfaces of interest, however, they are not homogeneous and the motion of a CL is often pinned by the physical roughness and/or chemical inhomogeneity on the solid surface. As a result, the relaxation of the liquid interface to its equilibrium shape is no longer determined by the viscous dissipation near the edge of the advancing liquid (Pagonabarraga Reference Pagonabarraga2012). Instead, the relaxation is accomplished by activated hopping of the CL over a complex potential landscape generated by nano-scale surface heterogeneities (Kaz et al.
Reference Kaz, McGorty, Mani, Brenner and Manoharan2012; Guan et al.
Reference Guan, Wang, Charlaix and Tong2016a
,Reference Guan, Wang, Charlaix and Tong
b
). In this case, the CL was found to relax logarithmically in time
 $t$
(i.e. go as
 $\ln (\unicode[STIX]{x1D6E4}t)$
) at the long-time limit. The relaxation rate
 $\unicode[STIX]{x1D6E4}$
is determined by the barrier crossing dynamics with
 $\unicode[STIX]{x1D6E4}\sim k_{0}\exp (-E_{b}/k_{B}T)$
, where
 $E_{b}$
is the energy barrier height,
 $k_{B}T$
is the thermal energy of the system and
 $k_{0}$
is a typical attempt frequency.
In this paper, we consider a different scenario of the CL relaxation, which also leads to a logarithmic time dependence. As shown in figure 1(a), when a thin glass fibre of diameter
 $d\;({\sim}2~\unicode[STIX]{x03BC}\text{m})$
intersects a free-standing soap film, the liquid (water) in the soap film wets the fibre surface and two soap film menisci develop with two advancing CLs moving in the opposite directions along the fibre. When the film thickness
 $\ell \gg d$
(thick film limit), the fluid flow toward the fibre is not confined very much by the soap film so that the film meniscus can develop quickly. It was shown by Clanet & Quéré (Reference Clanet and Quéré2002) that the rising time for a liquid–air interface to creep along a vertical fibre and reach its equilibrium shape scales as
 $\unicode[STIX]{x1D6E4}_{0}^{-1}$
with
 $\unicode[STIX]{x1D6E4}_{0}=\unicode[STIX]{x1D6FE}/[\unicode[STIX]{x1D702}(d/2)]$
being the interface relaxation rate. Because the capillary speed
 $\unicode[STIX]{x1D6FE}/\unicode[STIX]{x1D702}$
is very fast (
 ${\sim}23~\text{m}~\text{s}^{-1}$
for an interface with
 $\unicode[STIX]{x1D6FE}=23~\text{mN}~\text{m}^{-1}$
and
 $\unicode[STIX]{x1D702}=1~\text{cP}$
), it only takes a few microseconds for the interface to reach its equilibrium shape. The meniscus of the liquid interface around a stationary micron-sized fibre has zero mean curvature when the gravity effect is ignored and is governed by the second-order differential equation (de Gennes et al.
Reference de Gennes, Brochard-Wyart and Quéré2004)
 $$\begin{eqnarray}\frac{1}{R_{1}}+\frac{1}{R_{2}}=0,\end{eqnarray}$$
where
 $R_{1}$
and
 $R_{2}$
are the two principle radii of curvature at any point on the interface.
Equation (1.3) admits the following solution (James Reference James1974; Lo Reference Lo1983; de Gennes et al. Reference de Gennes, Brochard-Wyart and Quéré2004)
 $$\begin{eqnarray}x(z)+d/2=b\cosh \left[\frac{z}{b}-\ln \left(\frac{2\unicode[STIX]{x1D706}_{c}}{b}\right)\right],\end{eqnarray}$$
where
 $z$
is the meniscus height,
 $x$
is its radial location and
 $b=(d/2)\cos \unicode[STIX]{x1D703}_{eq}$
. Here we use a coordinate system with
 $x=0$
at the fibre surface and
 $z=0$
at the unperturbed liquid–air interface, as shown in the inset of figure 1(a). Equation (1.4) was obtained under the two boundary conditions (de Gennes et al.
Reference de Gennes, Brochard-Wyart and Quéré2004):
 $\cot \unicode[STIX]{x1D703}_{eq}=\unicode[STIX]{x2202}z(x,t)/\unicode[STIX]{x2202}x$
at
 $x=0$
and
 $z\simeq 0$
at
 $x=\unicode[STIX]{x1D706}_{c}$
. For a thin fibre with its diameter
 $d$
(
 ${\sim}2~\unicode[STIX]{x03BC}\text{m}$
) being much smaller than the capillary length
 $\unicode[STIX]{x1D706}_{c}$
(
 ${\sim}2~\text{mm}$
), the capillary force due to curvature is so dominant that gravity can be neglected when
 $x<\unicode[STIX]{x1D706}_{c}$
. The capillary length
 $\unicode[STIX]{x1D706}_{c}$
thus sets a natural cutoff length of the horizontal extent of the meniscus. The height of capillary rise,
 $h_{eq}\equiv z(x=0)$
, on the fibre surface can be obtained by inverting (1.4) (Wang et al.
Reference Wang, Guo, Chen and Tong2016)
 $$\begin{eqnarray}h_{eq}=\frac{d\cos \unicode[STIX]{x1D703}_{eq}}{2}\ln \left[\frac{4\unicode[STIX]{x1D706}_{c}}{d(1+\sin \unicode[STIX]{x1D703}_{eq})}\right].\end{eqnarray}$$
At this meniscus height, the capillary force is balanced by the weight of the wetting liquid and the interface remains at equilibrium. For
 $\unicode[STIX]{x1D703}_{eq}\simeq 0$
, we have
 $h_{eq}\simeq (d/2)\ln (4000)\simeq 4.15d$
. This value of
 $h_{eq}$
is much smaller than the lateral extent of the meniscus (
 ${\sim}\unicode[STIX]{x1D706}_{c}$
). For large values of
 $x$
, the meniscus height
 $z(x)$
decreases to a very small value. For example, when
 $x=0.7\unicode[STIX]{x1D706}_{c}$
, we have
 $z\simeq 0.043h_{eq}$
. For
 $x=0.8\unicode[STIX]{x1D706}_{c}$
,
 $z\simeq 0.027h_{eq}$
. These results indicate that the error introduced by constraining the horizontal extent of the meniscus to
 $x\lesssim \unicode[STIX]{x1D706}_{c}$
is small and thus the approximate solution given in (1.4) provides an adequate and convenient analytical expression for the analysis of the experimental result.
Our study to be presented below focuses on the other limit when the film thickness
 $\ell$
becomes smaller than the fibre diameter
 $d$
. In this thin film limit, we find that the motion of the CL is slowed down significantly by a factor of approximately
 $10^{-4}$
. We shall show that such a slow dynamics of spreading is caused by the strong confinement effect of the liquid in the thin soap film, and that the rise of the CL along the fibre in this case goes as a logarithmic function of fibre creeping time
 $t$
. In this paper, we first report our systematic measurements of the height of capillary rise
 $h(t)$
along the glass fibre and the viscous friction coefficient
 $\unicode[STIX]{x1D709}(t)$
felt by the glass fibre in contact with a soap film, both as a function of fibre creeping time
 $t$
. We then present a theoretical analysis for the phenomena based on the Onsager variational principle (Doi Reference Doi2011, Reference Doi2013). The experimental results are well explained by this theory and a detailed comparison between the experiment and theory is given in the final part of the paper.
2 Experiment
2.1 Preparation of soap films
The experimental apparatus and procedures used in this experiment are similar to those described previously (Guo et al.
Reference Guo, Lee, Sheng and Tong2015), and here we only mention some key points. The soap solution is prepared by mixing a commercial detergent (Ultra Joy dishwashing liquid) with a solution of glycerine and deionized water of resistivity
 $18~\text{M}\unicode[STIX]{x03A9}~\text{cm}$
(purified by a Barnstead three-column e-pure system). For all the solutions used in the experiment, the concentration of the detergent is kept at 1 wt%. The viscosity
 $\unicode[STIX]{x1D702}$
of the soap solution thus depends only on the amount of glycerine in the aqueous solution and is not affected much by the detergent. By varying the mass concentration of glycerine from 20 to 65 wt%, the viscosity
 $\unicode[STIX]{x1D702}$
of the soap solution changes from 1.65 to 13.7 cP.
A glass pipette containing the soap solution is used to blow soap bubbles, which are then transferred to a supporting substrate for optical imaging and AFM measurement. A metal ring of diameter 1 cm is used to support the soap film, as shown in figure 1. The liquid in the soap film drains very slowly along the metal ring to a plastic container placed at the bottom (not shown). It is found that the initial value of the soap film thickness
 $\ell$
can vary from micrometres to tens of nanometres, depending on the film viscosity
 $\unicode[STIX]{x1D702}$
. Soap films with a higher viscosity tend to be thicker initially.
The film thickness
 $\ell$
is measured using a UV-visible spectrophotometer (Perkin Elmer, Lambda 20), following a standard procedure (Huibers & Shah Reference Huibers and Shah1997). When a laser beam passes through a transparent film, the amplitude of the transmitted light is determined by the interference effect between the reflected beams from the two film-air interfaces. From the measured transmission spectrum, one can determine the film thickness
 $\ell$
. The minimum value of
 $\ell$
measurable by this spectrophotometer is 35 nm. Typically, the soap film can last for approximately an hour before it bursts. At the final stage of draining, the soap film becomes a Newton black film with a thickness of several nanometres (Poulin et al.
Reference Poulin, Nallet, Cabane and Bibette1996). To speed up the draining process, one may use a filter paper to touch the soap film for 4–5 s and soak the liquid away. A soap film with
 $\ell \lesssim 100~\text{nm}$
can be prepared in this way without much waiting time. Previously, we measured the film thickness
 $\ell$
at different draining times using the spectrophotometer (Guo et al.
Reference Guo, Lee, Sheng and Tong2015). With the same procedure, we measure the time dependence of
 $\ell$
in this experiment and use it as a guideline to estimate the initial value of the film thickness
 $\ell$
.
2.2 Optical imaging of soap film meniscus along a fibre
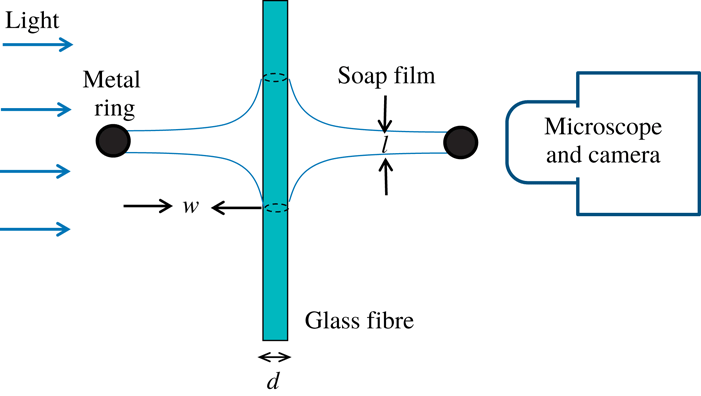
Side view of the optical imaging set-up. The two black solid circles indicate the metal ring used to support the soap film. The radius of the soap film is
 $w(\simeq 0.5~\text{cm})$
and its thickness is
 $\ell$
. The vertical glass fibre intersecting the soap film has a diameter
 $d$
in the range of
 $4{-}20~\unicode[STIX]{x03BC}\text{m}$
. The dashed circles on the surface of the glass fibre show the two contact lines formed on each side of the soap film.

Figure 2 shows a homemade optical imaging set-up for the study of temporal evolution of soap film meniscus along a thin glass fibre. An LCD light source (Schott KL2500) is used for bright field illumination. A plasma-cleaned glass fibre of diameter
 $d$
in the range of
 $4{-}20~\unicode[STIX]{x03BC}\text{m}$
is held vertically with a three-dimensional micromanipulator and pierces through the soap film with a penetration tip (
 ${\sim}40~\unicode[STIX]{x03BC}\text{m}$
) below the soap film. This penetration tip is long enough for the soap film meniscus to develop on each side of the soap film. A pinhole of 2 mm in diameter is placed between the light source and the film meniscus to collimate the light beam and allow a clear observation of the film meniscus under a stereo-microscope (Leica MZ16 with
 $\times$
57.5 magnification). The images of a growing film meniscus are recorded by a CCD camera (Photometrics CoolSNAP EZ) with a spatial resolution
 $1392\times 1040$
. A movie recording of the microscope images is typically taken at the sampling rate of 0.5 frames per second (f.p.s.) and is controlled by the
 $\unicode[STIX]{x1D707}$
Manager software.
2.3 Operation of the ‘long needle’ atomic force microscope
In the experiment, we use a recently developed hanging fibre probe (Xiong et al.
Reference Xiong, Guo, Xu, Sheng and Tong2009; Guo et al.
Reference Guo, Xiong, Xu, Sheng and Tong2014) based on atomic force microscopy (AFM) to measure the change of the friction coefficient
 $\unicode[STIX]{x1D709}(t)$
, when a soap film creeps along the hanging fibre probe. As shown in figure 1(b), the ‘long needle’ AFM consists of a vertical glass fibre of diameter
 $d$
in the range of
 $0.4{-}4~\unicode[STIX]{x03BC}\text{m}$
and length
 $100{-}300~\unicode[STIX]{x03BC}\text{m}$
, which is glued onto the front end of a rectangular cantilever beam. The AFM cantilever is mounted on a piezoelectric tube scanner to provide vertical motion with accuracy down to nanometres. The other end of the fibre is in contact with the soap film. The intersection between the soap film and the fibre surface forms two circular contact lines, as shown by the two dashed lines in figure 1(a). The assembly and calibration of the hanging fibre probe have been described elsewhere (Xiong et al.
Reference Xiong, Guo, Xu, Sheng and Tong2009; Guo et al.
Reference Guo, Xiong, Xu, Sheng and Tong2014).
The hanging fibre probe can measure two important properties of the CL. First, it acts as an accurate force sensor capable of measuring the capillary force (Guan et al. Reference Guan, Wang, Charlaix and Tong2016a ,Reference Guan, Wang, Charlaix and Tong b ; Wang et al. Reference Wang, Guo, Chen and Tong2016),
 $$\begin{eqnarray}f=-\unicode[STIX]{x03C0}d\unicode[STIX]{x1D6FE}\cos \unicode[STIX]{x1D703},\end{eqnarray}$$
acting on the CL of length
 $\unicode[STIX]{x03C0}d$
, which is formed on the fibre surface with a single liquid interface of surface tension
 $\unicode[STIX]{x1D6FE}$
and contact angle
 $\unicode[STIX]{x1D703}$
. Here the sign of
 $f$
is defined as
 $f\leqslant 0$
for
 $\unicode[STIX]{x1D703}\leqslant 90^{\circ }$
and
 $f>0$
for
 $\unicode[STIX]{x1D703}>90^{\circ }$
. With an accurate calibration of the cantilever, the AFM can measure the capillary force down to
 ${\sim}10~\text{pN}$
at an accuracy of 0.2 %.
Second, the hanging fibre probe is a high-quality mechanical resonator and its vertical displacement
 $z(t)$
(
 $\equiv$
vertical deflection of the AFM cantilever) is well described by the Langevin equation (Ma, Jimenez & Rajagopalan Reference Ma, Jimenez and Rajagopalan2000; Xiong et al.
Reference Xiong, Guo, Xu, Sheng and Tong2009):
 $$\begin{eqnarray}m\frac{\unicode[STIX]{x2202}^{2}z}{\unicode[STIX]{x2202}t^{2}}+\unicode[STIX]{x1D709}\frac{\unicode[STIX]{x2202}z}{\unicode[STIX]{x2202}t}+kz=f_{B}(t),\end{eqnarray}$$
where
 $m$
is the effective mass of the modified cantilever,
 $\unicode[STIX]{x1D709}\unicode[STIX]{x2202}z/\unicode[STIX]{x2202}t$
is the drag force on the fibre with
 $\unicode[STIX]{x1D709}$
being the friction coefficient,
 $kz(t)$
is the elastic force due to the bending of the cantilever with a spring constant
 $k$
and
 $f_{B}(t)$
is the random Brownian force due to thermal fluctuations of the surrounding fluid. While
 $f_{B}(t)$
has a zero mean, its root-mean-square (r.m.s.) value,
 $\langle f_{B}^{2}\rangle =2k_{B}T\unicode[STIX]{x1D709}$
, is a non-zero quantity with
 $k_{B}T$
being the thermal energy of the system (Reif Reference Reif1985).
The quantity measured in the experiment is the power spectrum of the vertical deflections of the cantilever,
 $|z(\unicode[STIX]{x1D714})|^{2}$
(or equivalently
 $|z(f)|^{2}$
), which has an analytical form (Ma et al.
Reference Ma, Jimenez and Rajagopalan2000; Xiong et al.
Reference Xiong, Guo, Xu, Sheng and Tong2009)
 $$\begin{eqnarray}|z(\unicode[STIX]{x1D714})|^{2}=\frac{2k_{B}T\unicode[STIX]{x1D709}/m^{2}}{(\unicode[STIX]{x1D714}^{2}-\unicode[STIX]{x1D714}_{0}^{2})^{2}+(\unicode[STIX]{x1D714}\unicode[STIX]{x1D709}/m)^{2}},\end{eqnarray}$$
where
 $\unicode[STIX]{x1D714}=2\unicode[STIX]{x03C0}f$
is the angular frequency and
 $\unicode[STIX]{x1D714}_{0}=(k/m)^{1/2}$
(
 ${\sim}600~\text{kHz}$
) is the resonant frequency of the system. Being operated at a resonant state, the hanging fibre amplifies the fluctuation spectrum and thus can accurately detect minute changes of the friction coefficient
 $\unicode[STIX]{x1D709}(t)$
caused by the viscous damping in the soap film.
Measurements of
 $|z(f)|^{2}$
are conducted using an AFM (MFP-3D, Asylum Research Inc.) operated under the thermal power spectral density (PSD) mode. Typically,
 $|z(f)|^{2}$
is taken with a frequency resolution of 152 Hz and the averaging time for each
 $|z(f)|^{2}$
is set for approximately 1 min. To determine the absolute value of
 $|z(f)|^{2}$
, the output voltage signal from the position-sensitive detector is calibrated against known values of the cantilever deflection. The experimental uncertainties of the measured
 $|z(f)|^{2}$
can be kept at the level of 5–10 %. The hanging fibre probe has been thoroughly tested in recent experiments (Xiong et al.
Reference Xiong, Guo, Xu, Sheng and Tong2009; Guo et al.
Reference Guo, Gao, Xiong, Wang, Wang, Sheng and Tong2013, Reference Guo, Xiong, Xu, Sheng and Tong2014). It was found that the measured resonant power spectrum
 $|z(\unicode[STIX]{x1D714})|^{2}$
is well described by (2.3), and the fitted values of
 $k$
,
 $m$
and
 $\unicode[STIX]{x1D709}$
are in good agreement with the expected values for a sub-millimetre-sized silicon cantilever together with a hanging fibre probe in contact with a liquid interface: the value of
 $m$
is of the order of
 $10^{8}~\text{g}$
and the value of
 $k$
is
 ${\sim}10~\text{N}~\text{m}^{-1}$
. More experimental details about how to obtain the value of
 $\unicode[STIX]{x1D709}$
at the liquid–air interfaces have been reported elsewhere (Guo et al.
Reference Guo, Gao, Xiong, Wang, Wang, Sheng and Tong2013, Reference Guo, Xiong, Xu, Sheng and Tong2014). More recently, this technique was used to measure the friction coefficient
 $\unicode[STIX]{x1D709}_{c}$
of a fluctuating CL at equilibrium for a soap film (Guo et al.
Reference Guo, Lee, Sheng and Tong2015). These results thus demonstrated that the use of the hanging fibre probe to measure the friction coefficient
 $\unicode[STIX]{x1D709}$
works.
2.4 AFM measurements of the soap film thickness
 $\ell$
and the height of capillary rise
$h$


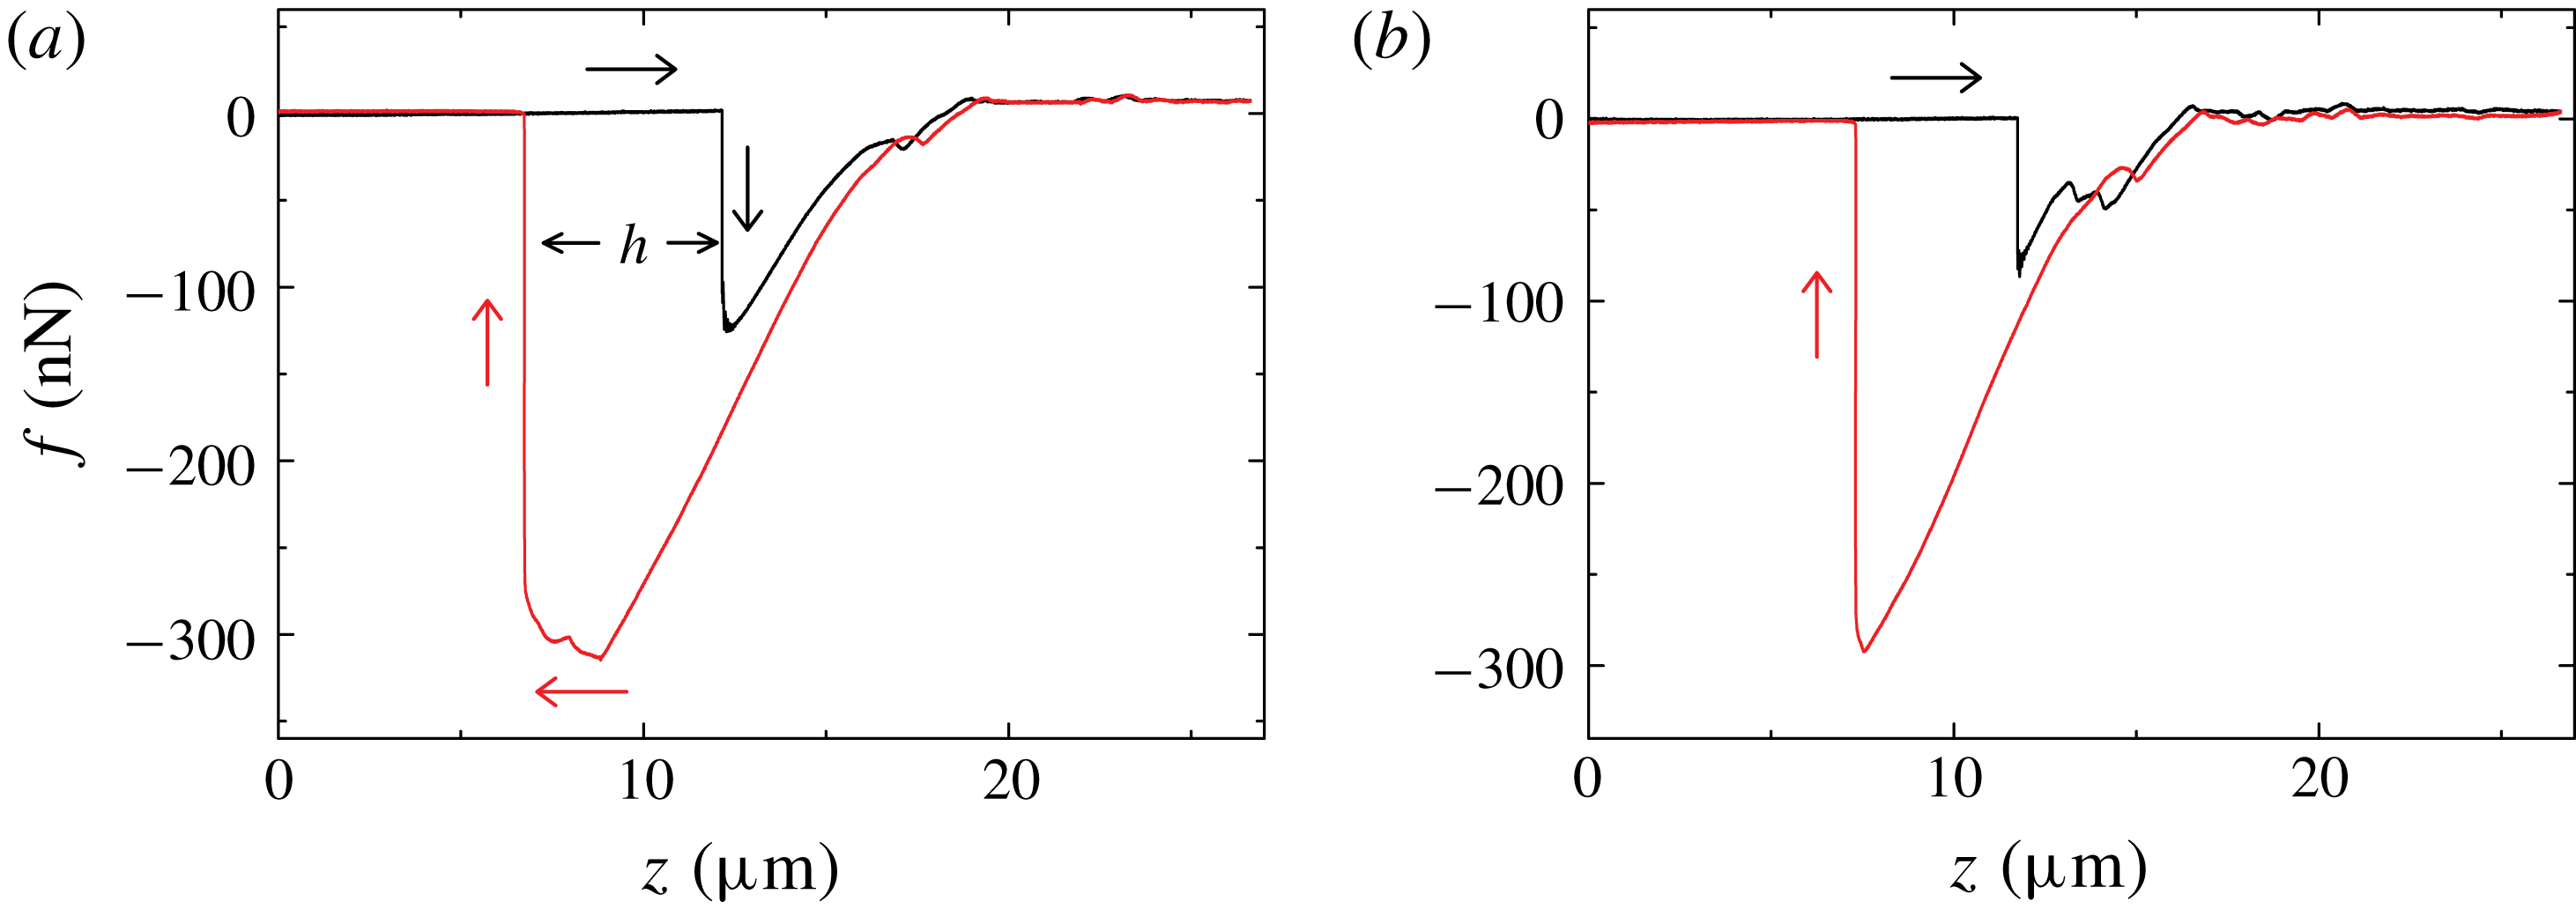
Variations of the measured capillary force
 $f$
when a glass fibre of diameter
 $d=2.6~\unicode[STIX]{x03BC}\text{m}$
pierces through (a) a thick soap film with thickness
 $\ell \sim 1~\unicode[STIX]{x03BC}\text{m}$
and (b) a thinner soap film with
 $\ell <35~\text{nm}$
. The black curves (
 $\rightarrow$
) show how the measured
 $f$
changes when the glass fibre is pushed downward at a constant speed
 $U=10~\unicode[STIX]{x03BC}\text{m}~\text{s}^{-1}$
. The red curves (
 $\leftarrow$
) show how the measured
 $f$
changes when the glass fibre is pulled upward at the same speed.

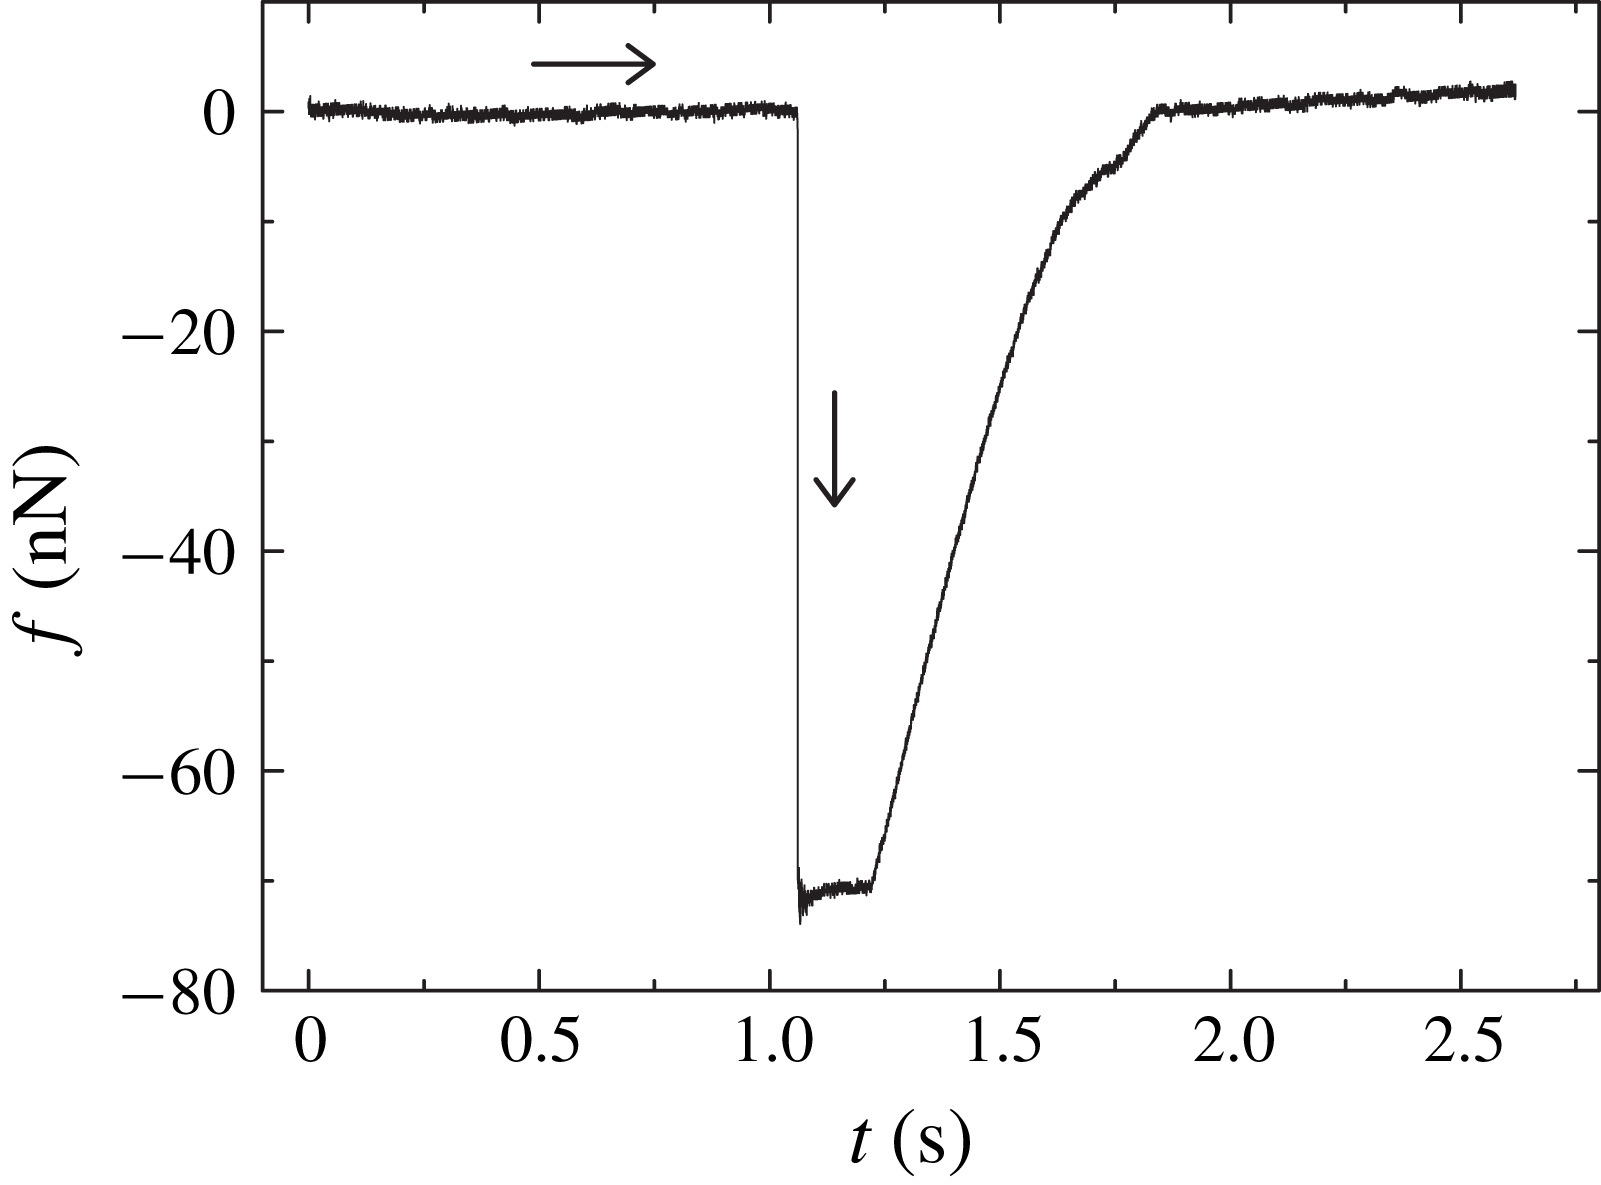
Figure 3(a) shows a typical evolution curve of the measured capillary force
 $f$
, when the hanging fibre probe pierces through a soap film. The black curve (
 $\rightarrow$
) shows how the measured
 $f$
changes when the glass fibre is pushed downward at a constant speed
 $U=10~\unicode[STIX]{x03BC}\text{m}~\text{s}^{-1}$
. Once the fibre tip touches the upper surface of the soap film at
 $z\simeq 12.3~\unicode[STIX]{x03BC}\text{m}$
, a capillary force,
 $f\simeq -125.4~\text{nN}$
, is detected. The minus sign indicates that the capillary force pulls down the fibre (
 $\unicode[STIX]{x1D703}<90^{\circ }$
). In a previous experiment (Guo et al.
Reference Guo, Lee, Sheng and Tong2015), we found that when the soap film is thick enough (
 $\ell \geqslant 1.6~\unicode[STIX]{x03BC}\text{m}$
), the measured
 $f$
can reach a plateau value before the fibre tip touches the lower surface of the soap film. This plateau value of
 $f$
agrees well with that obtained when the hanging fibre was in contact with a single liquid–air interface of the soap solution, of which the soap film is made. From the measured capillary force (see (2.1)), we found the contact angle
 $\unicode[STIX]{x1D703}\simeq 0^{\circ }$
and surface tension
 $\unicode[STIX]{x1D6FE}=23.2~\text{mN}~\text{m}^{-1}$
for all the soap solutions used on a clean glass fibre. In figure 3(a), however, no plateau region is observed for the measured
 $f$
in the advancing direction and only a short transient of
 $f$
is observed when the fibre tip pierces through the entire soap film. We therefore conclude that the film thickness in this case is smaller than
 $1.6~\unicode[STIX]{x03BC}\text{m}$
.
When the fibre tip touches the lower surface of the soap film at
 $z\simeq 12.3~\unicode[STIX]{x03BC}\text{m}$
, another CL forms on the fibre surface with an initial contact angle
 $\unicode[STIX]{x1D703}_{l}=90^{\circ }$
. Now the total force acting on the fibre is,
 $f=\unicode[STIX]{x03C0}d\unicode[STIX]{x1D6FE}(1-\cos \unicode[STIX]{x1D703}_{l})$
, which is a sum of two capillary forces of opposite signs. As the fibre further moves downward, the value of
 $\unicode[STIX]{x1D703}_{l}$
decreases and reaches its equilibrium value,
 $\unicode[STIX]{x1D703}_{l}\simeq 0^{\circ }$
, at
 $z\simeq 18.9~\unicode[STIX]{x03BC}\text{m}$
. Thus the total force is cancelled out and we have
 $f=0$
. This is shown in figure 3(a) for
 $z\geqslant 18.9~\unicode[STIX]{x03BC}\text{m}$
. In this case, the fibre is under zero external force, as if it is in air.
The red curve (
 $\leftarrow$
) in figure 3(a) shows how the measured
 $f$
changes when the glass fibre is pulled back upward at the same speed
 $U$
. The value of
 $f$
starts to decrease from zero when the fibre tip retracts back to the lower surface of the soap film at
 $z\simeq 18.9~\unicode[STIX]{x03BC}\text{m}$
. As the fibre further moves upward, the contact angle
 $\unicode[STIX]{x1D703}_{l}$
of the lower capillary rise changes continuously from
 $0^{\circ }$
to
 $90^{\circ }$
and finally the lower surface snaps off from the fibre tip. The maximum force measured is
 $f=\unicode[STIX]{x03C0}d\unicode[STIX]{x1D6FE}$
when only the upper surface of the soap film is in contact with the fibre at the contact angle
 $\unicode[STIX]{x1D703}\simeq 0^{\circ }$
. Before the fibre tip detaches from the soap film, the capillary force increases slightly and then drops quickly to zero. This round-off feature was also observed for a single liquid–air interface (Yazdanpanah et al.
Reference Yazdanpanah, Hosseini, Pabba, Berry, Dobrokhotov, Safir, Keynton and Cohn2008), indicating that the thick soap film used to obtain figure 3(a) shares some common properties of the liquid–air interface. The round-off feature is absent for a thin film as shown in figure 3(b). The distance
 $h(\simeq 5.4~\unicode[STIX]{x03BC}\text{m})$
between the black and red vertical lines in figure 3(a) gives the height of capillary rise of the soap film meniscus on the fibre surface. As will be shown below, the actual value of
 $h$
changes with the fibre creeping time after the fibre touches the soap film.
When the film thickness
 $\ell \ll 1~\unicode[STIX]{x03BC}\text{m}$
, as shown in figure 3(b), the transient region of the measured
 $f$
in the advancing direction becomes even shorter. In this case, one can still get a good estimate of the height of capillary rise
 $h$
. While the capillary force measurements shown in figure 3 cannot provide an accurate real-time measurement of
 $\ell$
, they nevertheless can tell us whether the soap film is in the thick film regime (
 $\ell \sim 1~\unicode[STIX]{x03BC}\text{m}$
) or in the thin film regime (
 $\ell \sim 10~\text{nm}$
).
3 Experimental results
3.1 Temporal evolution of soap film meniscus along a fibre
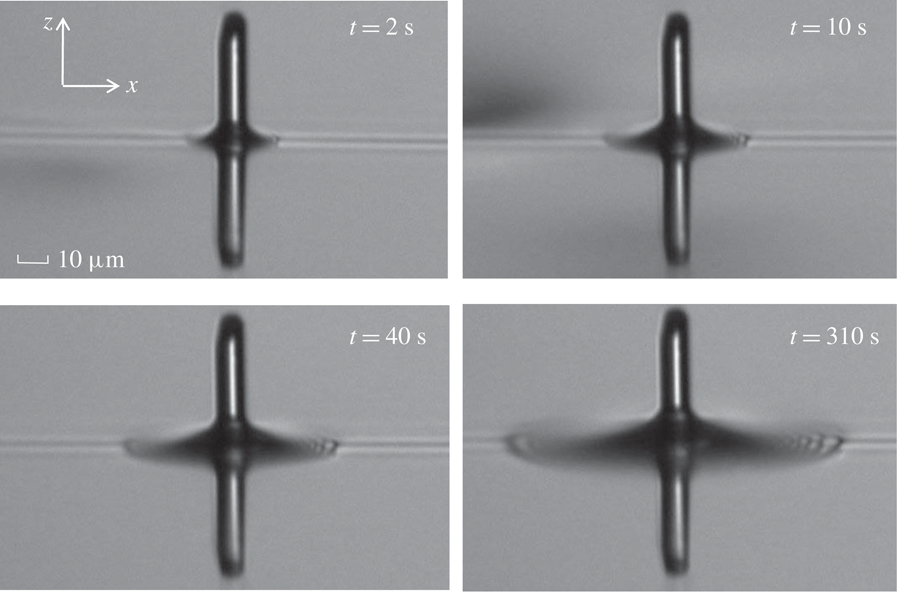
Microscope images of the soap film meniscus in the vicinity of a vertical glass fibre of diameter
 $d=9~\unicode[STIX]{x03BC}\text{m}$
. The images are taken at different times after the fibre tip pierces through the soap film from below (
 $t=0$
). The glass fibre is kept stationary intersecting the soap film during the entire movie taking. The measurements are made for a soap film with viscosity
 $\unicode[STIX]{x1D702}=1.65~\text{cP}$
and its thickness is estimated to be
 $\ell \sim 100~\text{nm}$
. The scale bar for all the images is
 $10~\unicode[STIX]{x03BC}\text{m}$
.

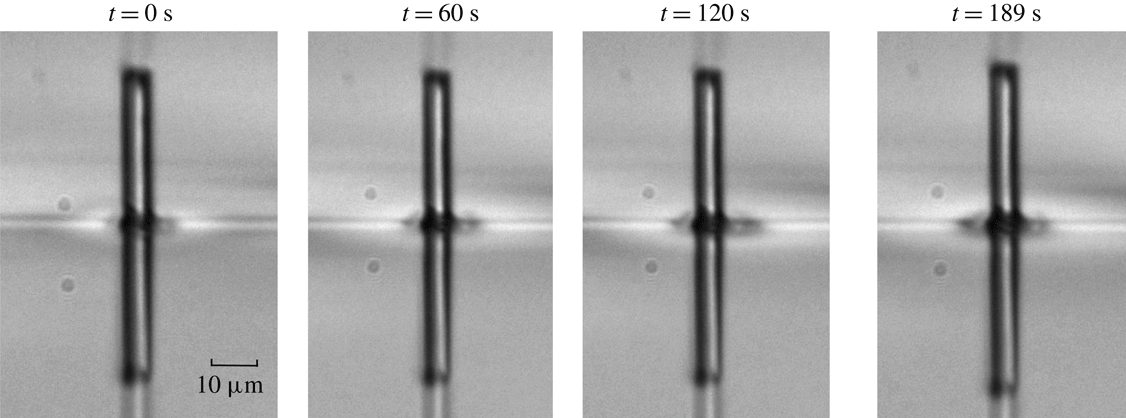
Figure 4 shows how the soap film meniscus in the vicinity of a vertical glass fibre evolves after the fibre tip pierces through the soap film from below (
 $t=0$
). Hereafter, we refer to this time as the fibre creeping time
 $t$
. The movie recording is typically taken at the sampling rate of 0.5 f.p.s., and here we only show some representative images at different fibre creeping times. The thin horizontal line in the middle of the image shows the film-air interface. The portion of the fibre above the interface is the penetration tip. Below the interface, there is a reflection image of the penetration tip by the soap film. Two capillary rises form around the fibre surface and they are symmetrically aligned on the two sides of the soap film, so that the resulting capillary force acting on the fibre is zero when the two capillary rises are fully developed (see figure 3). The two capillary rises change the reflection of light, forming a dark region surrounding the fibre as observed under a microscope. It is seen from figure 4 that this dark region grows with the fibre creeping time
 $t$
, indicating that the soap film meniscus in the vicinity of the vertical fibre rises slowly with
 $t$
. This meniscus growth is accomplished by an inward-going flow within the soap film toward the fibre, which then creeps along the vertical fibre in both directions.
Recorded time evolution of the measured capillary force
 $f(t)$
when a glass fibre of diameter
 $d=1.1~\unicode[STIX]{x03BC}\text{m}$
pierces through a soap film with thickness
 $\ell =1.6~\unicode[STIX]{x03BC}\text{m}$
. The curve (
 $\rightarrow$
) shows how the measured
 $f(t)$
changes with time
 $t$
when the glass fibre is pushed downward at a constant speed
 $U=10~\unicode[STIX]{x03BC}\text{m}~\text{s}^{-1}$
(data were partially adopted from Guo et al.
Reference Guo, Lee, Sheng and Tong2015).

It is found that such a creeping flow depends sensitively on the film thickness
 $\ell$
. Figure 5 shows how the measured capillary force
 $f(t)$
changes with time
 $t$
, when a glass fibre is pushed downward at a constant speed
 $U=10~\unicode[STIX]{x03BC}\text{m}~\text{s}^{-1}$
and pierces through a soap film with thickness
 $\ell (=1.6~\unicode[STIX]{x03BC}\text{m})$
being larger than the fibre diameter
 $d(=1.1~\unicode[STIX]{x03BC}\text{m})$
. It is seen that when the fibre tip touches the upper surface of the soap film at
 $t\simeq 1.12~\text{s}$
, the measured
 $f(t)$
rises quickly (with a rising time less than
 $100~\unicode[STIX]{x03BC}\text{s}$
) and is maintained at a plateau value of
 $f_{0}\simeq 70~\text{nN}$
until the fibre tip touches the lower surface of the soap film at
 $t\simeq 1.28~\text{s}$
. The minus sign in figure 5 indicates that the capillary force pulls down the fibre. The obtained plateau value
 $f_{0}$
agrees well with the expected equilibrium value,
 $\unicode[STIX]{x03C0}d\unicode[STIX]{x1D6FE}\cos \unicode[STIX]{x1D703}_{eq}$
, where the values of the equilibrium contact angle
 $\unicode[STIX]{x1D703}_{eq}\simeq 0^{\circ }$
and surface tension
 $\unicode[STIX]{x1D6FE}=23.2~\text{mN}~\text{m}^{-1}$
were obtained separately from the soap solution from which the soap film is made (Guo et al.
Reference Guo, Lee, Sheng and Tong2015). Because the capillary height
 $h(t)$
needs to reach its equilibrium value
 $h_{eq}(\simeq 4d)$
in order for
 $f_{0}$
to reach its equilibrium value, we conclude from figure 5 that for
 $\ell >d$
,
 $h(t)$
reaches its equilibrium value
 $h_{eq}$
as quickly as
 $f(t)$
does. The creeping speed of the capillary rise in this thick film regime is expected to be the same as that for an unconfined liquid–air interface (Clanet & Quéré Reference Clanet and Quéré2002).
Microscope images of the soap film meniscus in the vicinity of a vertical glass fibre of diameter
 $d=6~\unicode[STIX]{x03BC}\text{m}$
. The images are taken at different times after the fibre tip pierces through the soap film from below (
 $t=0$
). The glass fibre is kept stationary intersecting the soap film during the entire movie taking. The measurements are made for a soap film with viscosity
 $\unicode[STIX]{x1D702}=1.65~\text{cP}$
and its thickness is estimated to be
 $\ell <10~\text{nm}$
(Newton black film). The scale bar for all the images is
 $10~\unicode[STIX]{x03BC}\text{m}$
.

When the film thickness is reduced to the range
 $10~\text{nm}\lesssim \ell \lesssim d$
, we observe the time dependence of the capillary rise formation, as shown in figure 4. The meniscus growth rate in this intermediate regime is so slow that one can record the dynamics at a sampling rate of 0.5 f.p.s. When the film thickness is further reduced to the range
 $\ell \lesssim 10~\text{nm}$
, the soap film becomes a Newton black film (Poulin et al.
Reference Poulin, Nallet, Cabane and Bibette1996). In this case, the volume of liquid in the capillary rise region is small and does not change much during the experimental time (
 $t<200~\text{s}$
). Figure 6 shows a time lapse of the soap film meniscus at this thin film limit with
 $\ell \lesssim 10~\text{nm}$
. No significant change is observed among the microscope images taken at different fibre creeping times.
Magnified and contrast enhanced image of the soap film meniscus near a vertical glass fibre. The original image is taken from figure 4 at
 $t=10~\text{s}$
. Red crosses show the meniscus profile of the soap film, which is detected by the edge of the contrast difference in the image. A typical error in determining the meniscus location is approximately 1 pixel (
 $\simeq 0.24~\unicode[STIX]{x03BC}\text{m}$
). The horizontal line at the lower-right corner in connection with the red crosses is the undisturbed film-air interface. Also shown is the coordinate system used for the image analysis of the meniscus profile (see text for more details).

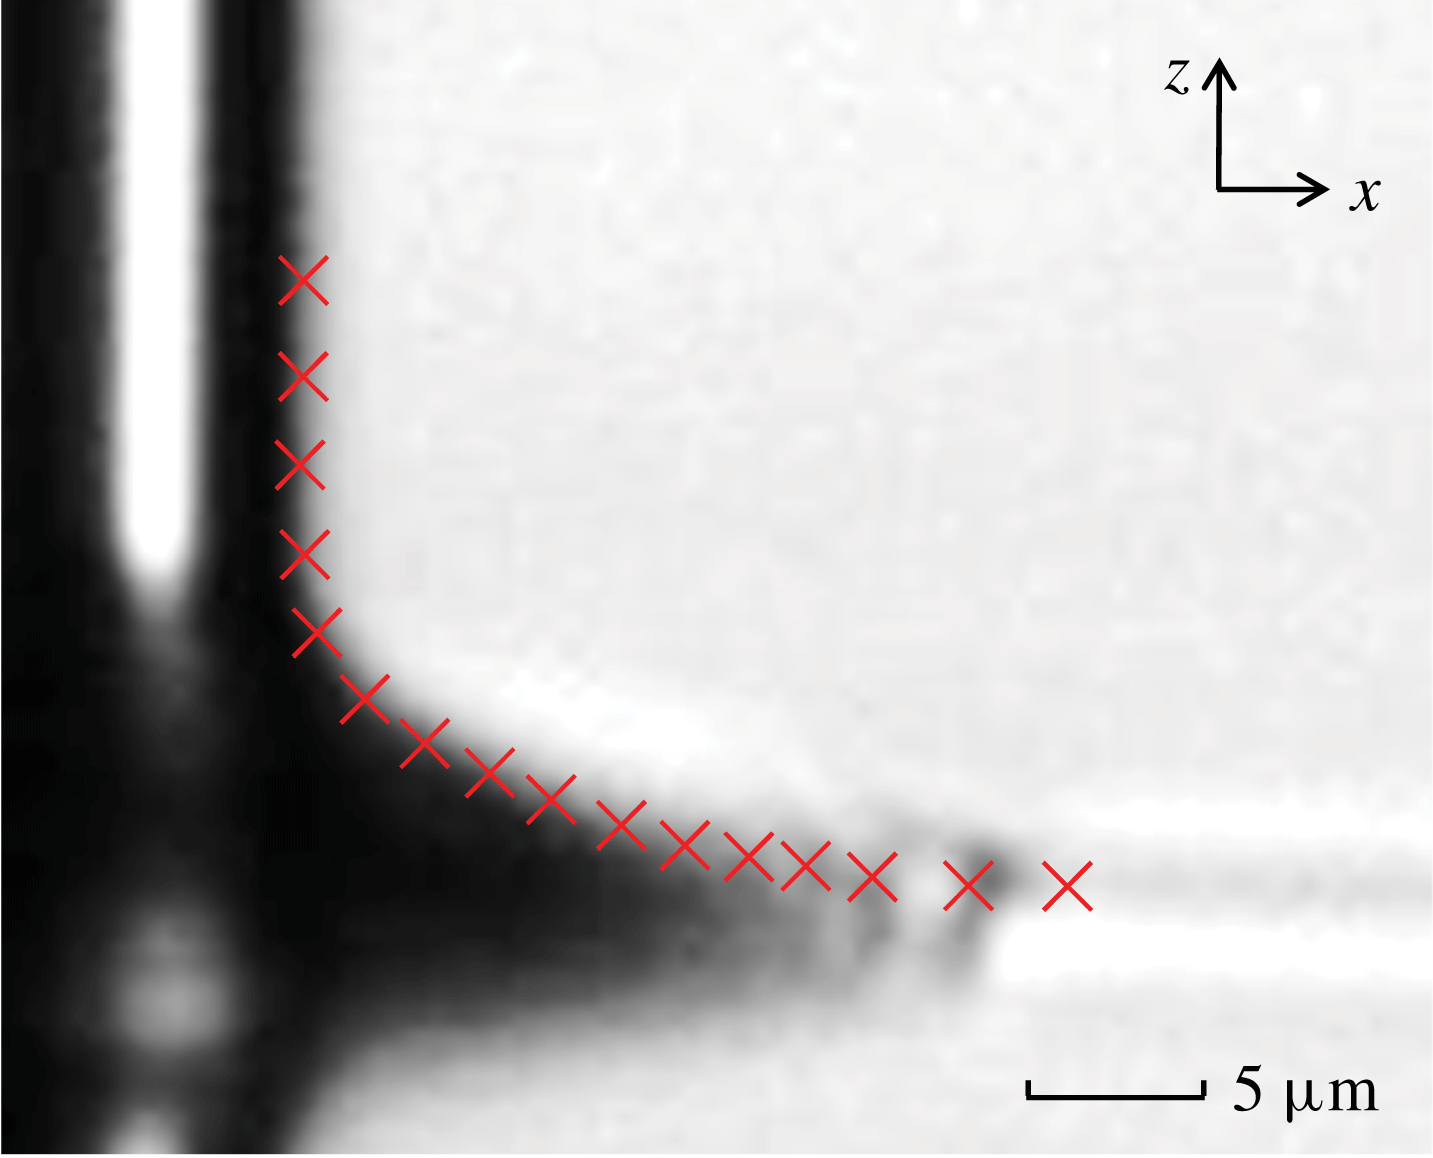
The captured images as shown in figure 4 are further analysed to locate the edge of the contrast difference using the ImageJ software, from which we obtain the profile of the soap film meniscus near the glass fibre. Figure 7 shows an example, in which the red crosses are used to mark the meniscus profile. In the image analysis, the meniscus profile is extended both vertically along the
 $+z$
direction to include part of the glass fibre and horizontally along the
 $+x$
direction to include part of the unperturbed film-air interface. A typical error in determining the meniscus location is approximately 1 pixel (
 $\simeq 0.24~\unicode[STIX]{x03BC}\text{m}$
).
(a) Obtained meniscus profile
 $z(x,t)$
as a function of distance
 $x$
away from the fibre surface at
 $t=12~\text{s}$
. The numerical data of the meniscus profile are obtained from the image analysis as shown in figure 7. Both the
 $z$
- and
 $x$
-axes are normalized by the fibre diameter (
 $d=9~\unicode[STIX]{x03BC}\text{m}$
). The solid line shows a fit of (3.2) to the data points with two fitting parameters: the height of capillary rise
 $h=1.12d$
and contact angle
 $\unicode[STIX]{x1D703}=0^{\circ }$
. The junction point
 $x_{c}$
between the meniscus and horizontal level is marked with an arrow. (b) Variations of the meniscus profile
 $z(x,t)$
at different fibre creeping times from
 $t=2~\text{s}$
to
 $t=350~\text{s}$
. The solid lines show the fits of (3.2) to different sets of data with
 $h(t)$
and
 $\unicode[STIX]{x1D703}(t)$
as two fitting parameters. The data points used in the fittings are in the range
 $x\leqslant x_{c}(t)$
.

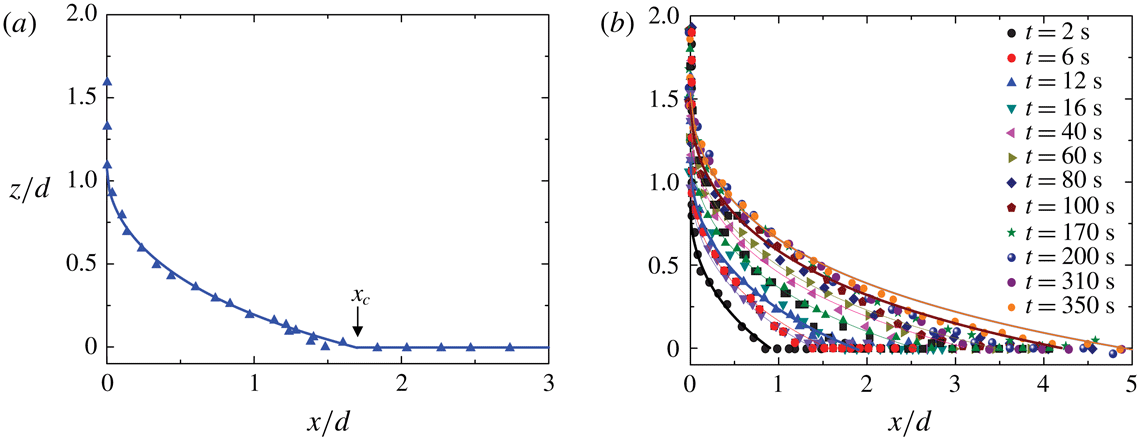
Figure 8(a) shows an example of the resulting meniscus profile
 $z(x,t)$
of the soap film as a function of distance
 $x$
away from the fibre surface. In the plot, both the vertical axis
 $z$
and horizontal axis
 $x$
are normalized by the fibre diameter
 $d(=9~\unicode[STIX]{x03BC}\text{m})$
. It is seen from figure 4 and more clearly from figure 8(a) that the meniscus profile has a finite vertical extent
 $h(t)$
along the fibre surface and a finite horizontal extent
 $x_{c}(t)$
, as marked in figure 8(a), along the unperturbed liquid–air interface; both increase with the fibre creeping time
 $t$
. For
 $x\leqslant x_{c}(t)$
and at a given time
 $t$
, the obtained
 $z(x,t)$
can be fitted to the general solution of (1.3)
 $$\begin{eqnarray}x(z)+d/2=b(t)\cosh \left[\frac{z-h(t)}{b(t)}\right],\end{eqnarray}$$
where
 $h(t)$
and
 $b(t)$
are two integration constants, which need to be determined from the boundary conditions. In the above,
 $h(t)$
represents the height of capillary rise on the fibre surface, i.e.
 $h(t)=z(0,t)$
, and
 $b(t)=(d/2)\cos \unicode[STIX]{x1D703}(t)$
with
 $\unicode[STIX]{x1D703}(t)$
being the contact angle at the fibre surface with
 $\cot \unicode[STIX]{x1D703}(t)=\unicode[STIX]{x2202}z(x,t)/\unicode[STIX]{x2202}x$
at
 $x=0$
.
As mentioned in the introduction, in (1.4) the two integration constants,
 $h$
and
 $\unicode[STIX]{x1D703}$
, were determined by the two boundary conditions at equilibrium (
 $t\rightarrow \infty$
). It is seen from figures 4 and 8 that before the soap film meniscus reaches its equilibrium shape, the boundary conditions of the meniscus profile change with time
 $t$
and thus we choose the commonly used
 $h(t)$
and
 $\unicode[STIX]{x1D703}(t)$
(instead of
 $h(t)$
and
 $x_{c}(t)$
) as two time-dependent fitting parameters. To show this more clearly, we write the inverted form of (3.1) as
 $$\begin{eqnarray}\frac{z(x,t)}{(d/2)\cos \unicode[STIX]{x1D703}(t)}=\frac{h(t)}{(d/2)\cos \unicode[STIX]{x1D703}(t)}-\ln \left(\frac{x+d/2}{(d/2)\cos \unicode[STIX]{x1D703}(t)}+\left[\left(\frac{x+d/2}{(d/2)\cos \unicode[STIX]{x1D703}(t)}\right)^{2}-1\right]^{1/2}\right).\vphantom{\mathop{\sum }_{\mathop{\sum }_{s}um}}\end{eqnarray}$$
The time dependence of
 $h(t)$
and
 $\unicode[STIX]{x1D703}(t)$
is obtained by fitting the experimental curves obtained at different
 $t$
to (3.2). When
 $h(t)$
and
 $\unicode[STIX]{x1D703}(t)$
reach their equilibrium values
 $h_{eq}$
and
 $\unicode[STIX]{x1D703}_{eq}$
, respectively,
 $z(x,t)$
in (3.2) becomes the equilibrium profile. Because (3.1) has only two integration constants, the time dependence of
 $x_{c}(t)$
is intrinsically linked to that of
 $h(t)$
. The solid line in figure 8(a) shows a fit of (3.2) to the data points with
 $h(t)$
and
 $\unicode[STIX]{x1D703}(t)$
as two fitting parameters. As mentioned above, the image analysis of the meniscus profile included a part of the fibre surface along the vertical
 $+z$
direction and a part of the unperturbed film-air interface along the horizontal
 $+x$
direction (with
 $x>x_{c}(t)$
). Therefore, both ends of the meniscus profile are not included in the fitting. It is seen that the measured
 $z(x,t)$
with
 $x\leqslant x_{c}(t)$
is well described by (3.2) at a fixed time
 $t$
. For
 $x>x_{c}(t)$
,
 $z=0$
and a horizontal line is drawn in figure 8(a).
Figure 8(b) shows how the meniscus profile
 $z(x,t)$
evolves with the fibre creeping time
 $t$
. It is seen that as
 $t$
increases, the soap film creeps along the vertical glass fibre with both the height and volume of the capillary rise increasing slowly with
 $t$
. All of the meniscus profiles with
 $x\leqslant x_{c}(t)$
at different creeping times are found to be well described by (3.2) (solid lines), indicating that the soap film meniscus is in a quasi-equilibrium state satisfying the governing equation, equation (1.3), at any given time. This is because the creeping flow is slow compared with the ‘instantaneous’ change of the meniscus shape, which is determined by the balance of local Laplace pressure. There are two time-dependent fitting parameters in (3.2). It is found that all of the meniscus profiles can be fit with a common contact angle
 $\unicode[STIX]{x1D703}=0^{\circ }\pm 20^{\circ }$
. The fitted value of
 $\unicode[STIX]{x1D703}$
agrees with that obtained from the direct AFM measurement of the capillary force, as discussed in § 2.4. It has a relatively larger error, because
 $\cos \unicode[STIX]{x1D703}$
in (3.2) is not very sensitive to small changes of
 $\unicode[STIX]{x1D703}$
when
 $\unicode[STIX]{x1D703}$
is close to zero. The temporal evolution of the soap film meniscus is then uniquely determined by (3.2) with the time-varying height of capillary rise
 $h(t)$
as the only fitting parameter. The initial value of
 $h(t)$
is
 $h_{0}\simeq 0.85d$
at
 $t_{0}=2~\text{s}$
, which is the earliest time at which we can measure the meniscus profile. As mentioned above, the change of
 $h(t)$
with
 $t$
is spontaneous as the soap film slowly creeps along the glass fibre.
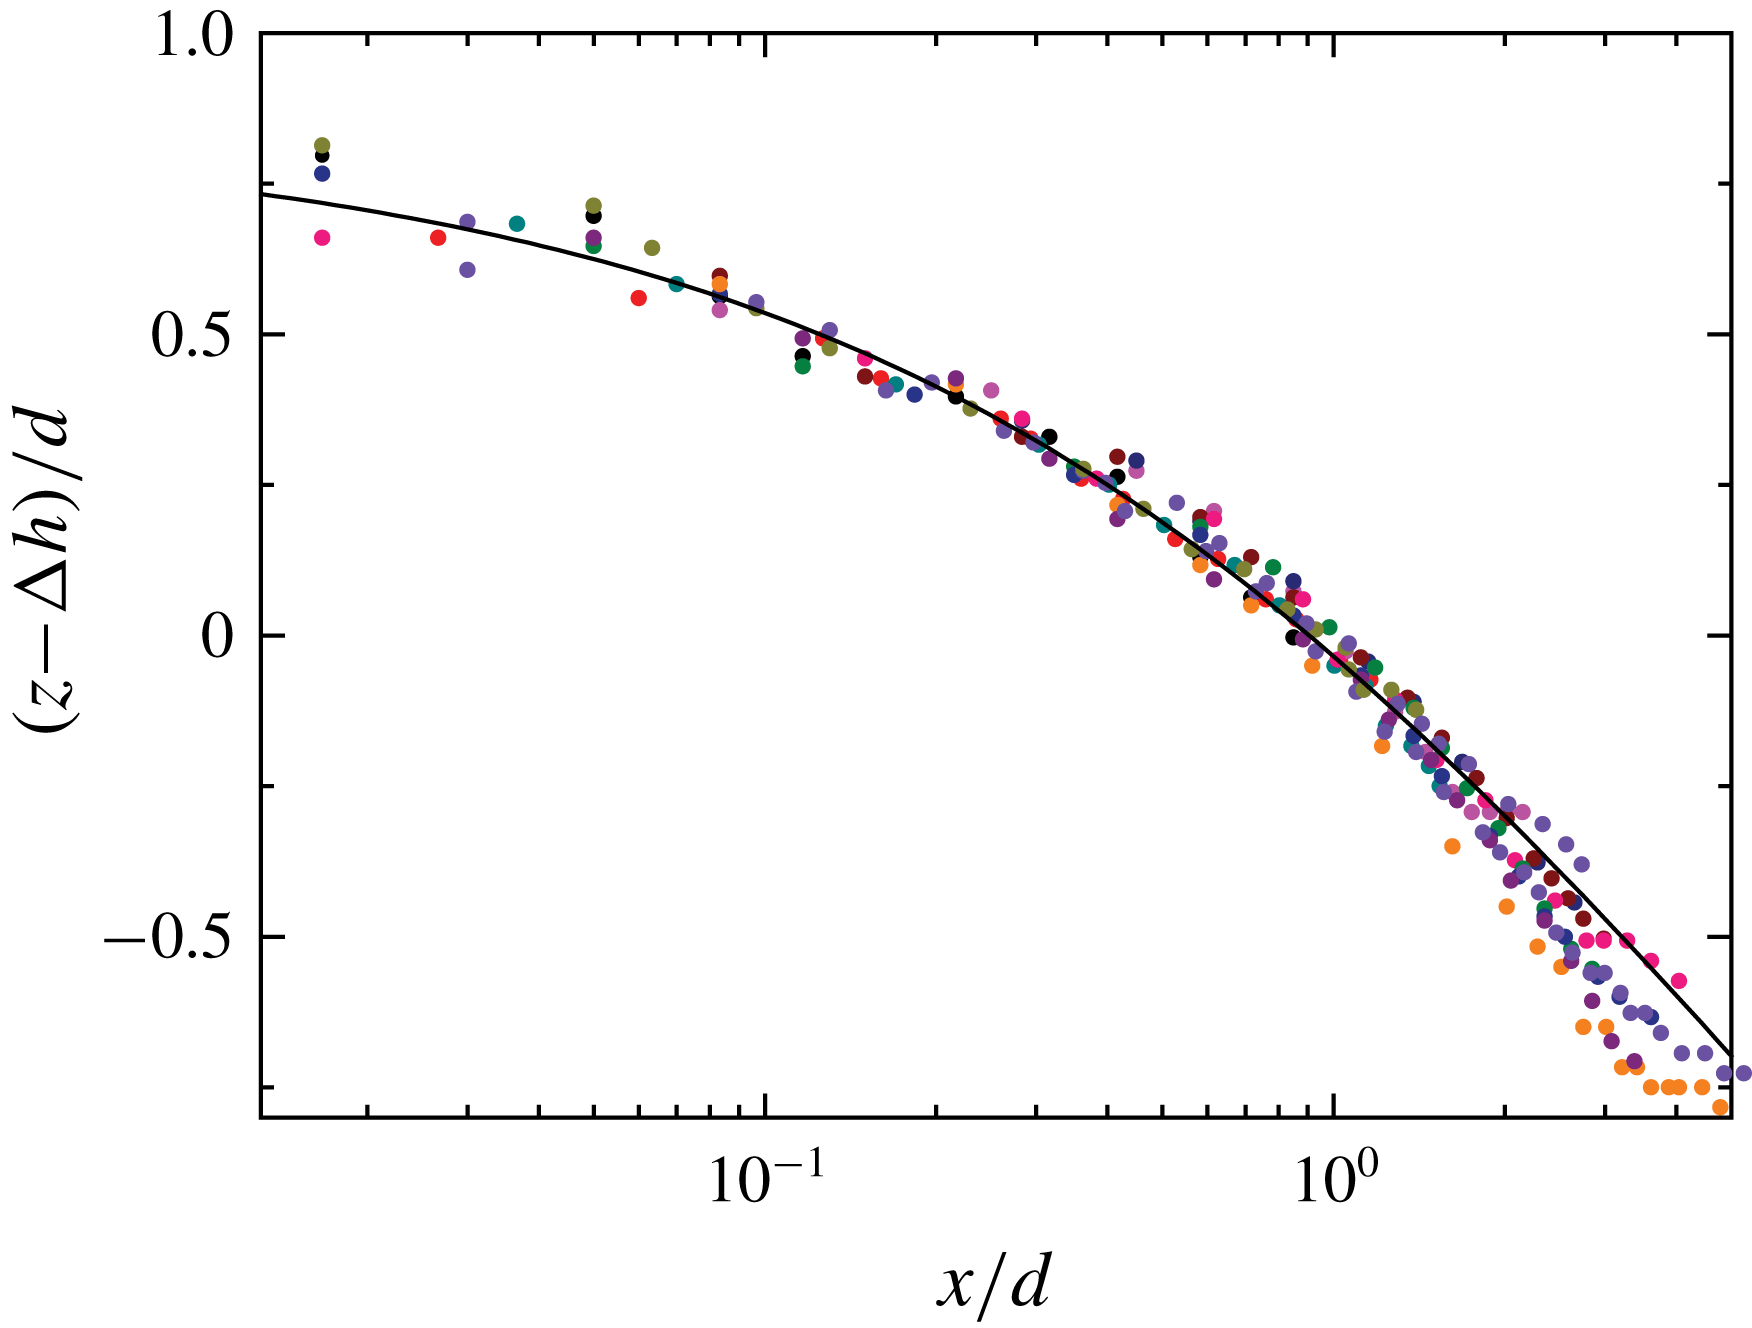
Scaling plot of the measured meniscus profile,
 $z(x,t)-\unicode[STIX]{x0394}h(t)$
, as a function of distance
 $x$
away from the fibre surface. Both the vertical and horizontal axes are normalized by the fibre diameter
 $d(=9~\unicode[STIX]{x03BC}\text{m})$
. Black circles show the unshifted meniscus profile with
 $\unicode[STIX]{x0394}h=0$
at
 $t_{0}=2~\text{s}$
. The solid line shows a fit of (3.2) to all the data points with
 $\unicode[STIX]{x1D703}=0^{\circ }$
and
 $h(t)=h_{0}=0.85d$
. The colour code used for other sets of data is the same as that used in figure 8.

As shown in (3.2),
 $h(t)$
is simply an offset value of
 $z$
when
 $x=0$
. To determine the value of
 $h(t)$
more accurately, we vertically shift the meniscus profiles
 $z(x,t)$
obtained at different
 $t$
by an amount
 $\unicode[STIX]{x0394}h(t)$
, so that all of the measured meniscus profiles overlap with that obtained at
 $t_{0}=2~\text{s}$
, which is not shifted (
 $\unicode[STIX]{x0394}h=0$
). Indeed, after the subtraction of the vertical shift
 $\unicode[STIX]{x0394}h(t)$
, all of the data sets collapse on to a master curve, as shown in figure 9. In the plot, those data points on the fibre surface with
 $x=0$
and those at the undisturbed soap film interface with
 $z=0$
are not included. The solid line shows a fit of (3.2) to all the data points with
 $\unicode[STIX]{x1D703}=0^{\circ }$
and
 $h(t)=h_{0}=0.85d$
. Figure 9 thus demonstrates that the meniscus profile
 $z(x,t)$
of the soap film at any given time
 $t$
can indeed be described by a quasi-equilibrium shape with zero curvature as shown in (3.2). This is attributed to the slowness of the film evolution. The time dependence of
 $h(t)$
is then accurately determined by
 $$\begin{eqnarray}h(t)=h_{0}+\unicode[STIX]{x0394}h(t),\end{eqnarray}$$
where
 $h_{0}$
is the value of
 $h(t)$
at the initial time
 $t_{0}$
. For the soap film shown in figure 9, we find
 $h_{0}=0.85d$
.
Obtained height of capillary rise
 $h(t)$
as a function of fibre creeping time
 $t$
for two soap film systems. The black circles are obtained for a soap film with thickness
 $\ell$
in the range 100–50 nm and fibre diameter
 $d=9~\unicode[STIX]{x03BC}\text{m}$
. The red triangles are obtained for a soap film with thickness
 $\ell$
in the range 50–20 nm and fibre diameter
 $d=6~\unicode[STIX]{x03BC}\text{m}$
. In the plot,
 $h(t)$
is normalized by the fibre diameter
 $d$
. The error bars show the experimental uncertainty of the measurements. The solid lines show the fits of (4.27) to the two sets of data with
 $c_{0}=4.0$
and
 $\unicode[STIX]{x1D6E4}=0.9$
for the black curve and
 $c_{0}=1.8$
and
 $\unicode[STIX]{x1D6E4}=0.05$
for the red curve.

Figure 10 shows how the measured
 $h(t)$
varies with
 $t$
. Two sets of data with different values of
 $\ell$
and
 $d$
are presented. The black circles are obtained for a soap film with thickness
 $\ell$
in the range 100–50 nm, and the red triangles are obtained for a soap film with thickness
 $\ell$
in the range 50–20 nm. It is seen that the measured
 $h(t)$
is a monotonically increasing function of
 $t$
from its initial value
 $h_{0}$
to its final value. The initial height
 $h_{0}$
is found to increase with the film thickness
 $\ell$
. This finding confirms that the slow evolution of
 $h(t)$
is caused by the confinement of the creeping flow inside the thin soap film; the higher the degree of confinement is, the slower the meniscus profile evolves.
As observed by Quéré (Reference Quéré2008), when the meniscus spreads faster in the horizontal direction than in the vertical direction, the junction between the meniscus and unperturbed horizontal interface is smooth. When the spreading speeds along the horizontal and vertical directions are similar, this junction is no longer smooth. The physics near the junction point
 $x_{c}$
, as marked in figure 8(a), can be complicated. For example, a depression wave was observed near the junction point at a liquid–air interface (Quéré Reference Quéré2008). This becomes even more complicated for a thin soap film with two symmetrically aligned interfaces present. The depression waves from the two interfaces may interfere with each other near the junction point. As shown in figure 4, wave-like patterns are indeed observed near the junction point at late times.
Because the focus of the present study is on the meniscus profile near the thin fibre, we use a smooth function with a finite horizontal extent
 $x\leqslant x_{c}(t)$
, i.e. equation (3.2), to fit the measured meniscus profiles. This equation is also used in the theoretical analysis to be given below (see (4.4) below). Such a treatment ignores the complications near the junction point and is found to be an adequate approximation to describe the measured
 $z(x,t)$
near the fibre. The meniscus profile near the junction point also suffers experimental uncertainties, especially at late times. As shown in figure 4, the image contrast of the soap film meniscus decreases with increasing
 $t$
(see, e.g. the panel at
 $t=310~\text{s}$
). These complications from the theory and experiment cause deviations of the measured
 $z(x,t)$
from (3.2), which are visible in figure 8(b) for the curve fitting to the orange circles at
 $t=350~\text{s}$
and also in figure 9. Consequently, the obtained values of
 $h(t)$
at the late stage suffer relatively larger errors. The wave-like patterns observed near
 $x_{c}(t)$
may introduce additional viscous damping to the inward-going flow inside the soap film, and thus the growth rates of the creeping flow along the fibre and corresponding
 $h(t)$
are reduced.
Nevertheless, the two data sets shown in figure 10 show a smooth and continuous increase over a time span of almost three decades. At the very late stage, the soap film meniscus is expected to reach its equilibrium height
 $h_{eq}$
. The value of
 $h_{eq}$
is given in (1.5). For a soap film system with surface tension
 $\unicode[STIX]{x1D6FE}=23.2~\text{mN}~\text{m}^{-1}$
, liquid density
 $\unicode[STIX]{x1D70C}=10^{3}~\text{kg}~\text{m}^{-3}$
, contact angle
 $\unicode[STIX]{x1D703}=0^{\circ }$
and
 $d=5~\unicode[STIX]{x03BC}\text{m}$
, we find
 $h_{eq}\simeq 3.6d$
. Clearly, the two sets of data shown in figure 10 have not reached their asymptotic height yet.
3.2 Temporal evolution of fibre dissipation
Variations of the measured power spectrum
 $|z(f)|^{2}$
for a soap film at two different fibre creeping times:
 $t=120~\text{s}$
(black triangles) and
 $t=2520~\text{s}$
(red circles). The measurements are made when the hanging fibre probe of diameter
 $d=2.6~\unicode[STIX]{x03BC}\text{m}$
is kept stationary intersecting the soap film of viscosity
 $\unicode[STIX]{x1D702}=1.65~\text{cP}$
and thickness
 $\ell \sim 50~\text{nm}$
. The solid lines show the fits of (2.3) to the two sets of data with the fitting parameters,
 $\unicode[STIX]{x1D709}=2.75\times 10^{-7}~\text{Ns}~\text{m}^{-1}$
,
 $k=31.62~\text{N}~\text{m}^{-1}$
and
 $m=5.10\times 10^{-8}~\text{g}$
for the black triangles and
 $\unicode[STIX]{x1D709}=2.97\times 10^{-6}~\text{Ns}~\text{m}^{-1}$
,
 $k=31.57~\text{N}~\text{m}^{-1}$
and
 $m=5.26\times 10^{-8}~\text{g}$
for the red circles.

To further study the development of the meniscus profile of soap films along a thin fibre, we use the ‘long needle’ AFM to measure the power spectrum
 $|z(f)|^{2}$
for soap films at different fibre creeping times
 $t$
. Figure 11 shows how the measured
 $|z(f)|^{2}$
changes with
 $t$
. In the measurement, the hanging fibre is kept still after it pierces through a soap film. It is found that the resonant peak changes continuously with increasing
 $t$
; the frequency peak broadens while the peak height decreases and peak position shifts to lower frequencies. Figure 11 shows the changes of the measured
 $|z(f)|^{2}$
at two representative creeping times. The measured
 $|z(f)|^{2}$
is well described by (2.3) (solid lines) with spring constant
 $k$
, mass
 $m$
and friction coefficient
 $\unicode[STIX]{x1D709}$
as three fitting parameters. It is found that the fitted values of
 $k$
and
 $m$
remain approximately constant for different creeping times but the fitted value of
 $\unicode[STIX]{x1D709}$
changes sensitively with
 $t$
. From the measured
 $|z(f)|^{2}$
at different
 $t$
, we obtain
 $\unicode[STIX]{x1D709}(t)$
as a function of
 $t$
. Similarly, we also measure
 $|z(f)|^{2}$
when the fibre is in air and obtain the corresponding friction coefficient
 $\unicode[STIX]{x1D709}_{a}$
, which is independent of
 $t$
.
By integrating (2.3), one finds that the mean-square value of soap film fluctuations is given by the equipartition theorem,
 $k\langle z^{2}(t)\rangle _{t}=k_{B}T$
. For
 $k=31.6~\text{N}~\text{m}^{-1}$
, we have
 $\langle z^{2}(t)\rangle _{t}^{1/2}\simeq 1.14\times 10^{-2}~\text{nm}$
. The corresponding drag force is
 $f_{d}\simeq \unicode[STIX]{x1D709}\unicode[STIX]{x1D714}_{0}\langle z^{2}(t)\rangle _{t}^{1/2}\simeq 26.2~\text{pN}$
and the capillary number
 $Ca\simeq \unicode[STIX]{x1D702}\unicode[STIX]{x1D714}_{0}\langle z^{2}(t)\rangle _{t}^{1/2}/\unicode[STIX]{x1D6FE}\simeq 6.27\times 10^{-7}$
for the soap film with
 $\unicode[STIX]{x1D6FE}=23.2~\text{mN}~\text{m}^{-1}$
,
 $\unicode[STIX]{x1D709}=2.97\times 10^{-6}~\text{Ns}~\text{m}^{-1}$
,
 $\unicode[STIX]{x1D714}_{0}=2\unicode[STIX]{x03C0}\times 123~\text{kHz}$
and
 $\unicode[STIX]{x1D702}=1.65~\text{cP}$
. These numbers reveal the tremendous sensitivity of the technique useful for the study of soap film dissipation.
Obtained net friction coefficient
 $\unicode[STIX]{x0394}\unicode[STIX]{x1D709}(t)$
as a function of fibre creeping time
 $t$
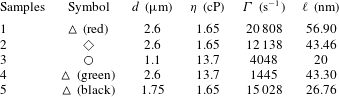
for five samples with different fibre diameters
 $d$
and soap film viscosities
 $\unicode[STIX]{x1D702}$
:
 $d=2.6~\unicode[STIX]{x03BC}\text{m}$
and
 $\unicode[STIX]{x1D702}=1.65~\text{cP}$
(red triangles);
 $d=2.6~\unicode[STIX]{x03BC}\text{m}$
and
 $\unicode[STIX]{x1D702}=1.65~\text{cP}$
(blue diamonds);
 $d=1.1~\unicode[STIX]{x03BC}\text{m}$
and
 $\unicode[STIX]{x1D702}=13.7~\text{cP}$
(red circles);
 $d=2.6~\unicode[STIX]{x03BC}\text{m}$
and
 $\unicode[STIX]{x1D702}=13.7~\text{cP}$
(green triangles);
 $d=1.75~\unicode[STIX]{x03BC}\text{m}$
and
 $\unicode[STIX]{x1D702}=1.65~\text{cP}$
(black triangles). The film thickness
 $\ell$
of the five samples is discussed in the text.

Figure 12 shows the obtained net friction coefficient
 $\unicode[STIX]{x0394}\unicode[STIX]{x1D709}(t)\equiv \unicode[STIX]{x1D709}(t)-\unicode[STIX]{x1D709}_{a}$
as a function of
 $t$
for five samples with different values of
 $d$
and
 $\unicode[STIX]{x1D702}$
. All the data sets reveal a general trend that the obtained
 $\unicode[STIX]{x0394}\unicode[STIX]{x1D709}(t)$
increases with
 $t$
for more than two decades of time span. It is found that the rate of increase of
 $\unicode[STIX]{x0394}\unicode[STIX]{x1D709}(t)$
depends sensitively on the film thickness
 $\ell$
. For thick films with
 $\ell \sim 1~\unicode[STIX]{x03BC}\text{m}$
(red triangles and red circles), their rate of increase is much faster than that of thinner films with
 $\ell \sim 100~~\text{nm}$
(black and green triangles and blue diamonds). Here we estimate the value of
 $\ell$
based on the AFM force-curve measurements as shown in figure 3.
In a previous experiment (Guo et al.
Reference Guo, Lee, Sheng and Tong2015), it was found that the net friction coefficient
 $\unicode[STIX]{x0394}\unicode[STIX]{x1D709}(t)$
contains two contributions:
 $$\begin{eqnarray}\unicode[STIX]{x0394}\unicode[STIX]{x1D709}(t)=\unicode[STIX]{x1D709}_{c}+\unicode[STIX]{x1D709}_{s}(t).\end{eqnarray}$$
The first term
 $\unicode[STIX]{x1D709}_{c}$
is the contribution from the two (fluctuating) CLs, which is independent of
 $t$
. The measured
 $\unicode[STIX]{x1D709}_{c}$
in the thin film limit (
 $\ell \sim 10~\text{nm}$
) was found to have a scaling form (Guo et al.
Reference Guo, Lee, Sheng and Tong2015),
 $$\begin{eqnarray}\unicode[STIX]{x1D709}_{c}=2\unicode[STIX]{x1D6FC}\unicode[STIX]{x03C0}d\unicode[STIX]{x1D702},\end{eqnarray}$$
where
 $\unicode[STIX]{x1D6FC}=1.1\pm 0.3$
is a numerical coefficient independent of the contact angle
 $\unicode[STIX]{x1D703}$
. The factor of 2 accounts for the two CLs formed on the fibre surface. The second term
 $\unicode[STIX]{x1D709}_{s}(t)$
in (3.4) is the side wall contribution from the fluid in contact with the hanging fibre. As the soap film creeps along the vertical fibre,
 $h(t)$
increases and so does the contact area between the fluid and fibre. As a result,
 $\unicode[STIX]{x1D709}_{s}(t)$
increases with
 $h(t)$
. This explains the observed time dependence of the measured
 $\unicode[STIX]{x0394}\unicode[STIX]{x1D709}(t)$
in figure 12 and the faster increase of
 $\unicode[STIX]{x0394}\unicode[STIX]{x1D709}(t)$
associated with the thicker films. It is also found that for sufficiently large values of
 $t$
,
 $\unicode[STIX]{x1D709}_{s}(t)$
becomes the dominant term in the measured
 $\unicode[STIX]{x0394}\unicode[STIX]{x1D709}(t)$
.
4 Theoretical analysis
The above experimental results suggest that the slow creeping flow along the vertical glass fibre is driven by the capillary force between the soap film and fibre surface. This creeping flow is strongly influenced by the confinement effects on viscous dissipation in the thin soap film. With these observations, we now carry out a theoretical analysis of the scaling properties of the creeping flow.
4.1 The Onsager principle applied to capillary rise
The flow inside the soap film is in the Stokesian regime, as its Reynolds number is small. The basic set of equations for Stokesian hydrodynamics can be derived from the Onsager variational principle (Doi Reference Doi2011, Reference Doi2013). The main ideas are outlined as follows.
From the experimental observations, we find the meniscus profile can be described by two variables, the height of capillary rise
 $h(t)$
and contact angle
 $\unicode[STIX]{x1D703}(t)$
. The time evolution of the system, described by the time derivatives
 ${\dot{h}}$
and
 $\dot{\unicode[STIX]{x1D703}}$
, is determined by the minimum condition of the function
 $$\begin{eqnarray}{\mathcal{R}}(h,\unicode[STIX]{x1D703},{\dot{h}},\dot{\unicode[STIX]{x1D703}})=\unicode[STIX]{x1D6F7}(h,\unicode[STIX]{x1D703},{\dot{h}},\dot{\unicode[STIX]{x1D703}})+\frac{\unicode[STIX]{x2202}A}{\unicode[STIX]{x2202}h}{\dot{h}}+\frac{\unicode[STIX]{x2202}A}{\unicode[STIX]{x2202}\unicode[STIX]{x1D703}}\dot{\unicode[STIX]{x1D703}},\end{eqnarray}$$
where
 $A(h,\unicode[STIX]{x1D703})$
is the free energy of the system, and
 $\unicode[STIX]{x1D6F7}(h,\unicode[STIX]{x1D703},{\dot{h}},\dot{\unicode[STIX]{x1D703}})$
is the free-energy dissipation function, which is defined as one half of the rate of free-energy dissipation in the fluid when the meniscus evolves at rates
 ${\dot{h}}$
and
 $\dot{\unicode[STIX]{x1D703}}$
. Since the fluid flow obeys the Stokesian dynamics,
 $\unicode[STIX]{x1D6F7}$
is a quadratic function of
 ${\dot{h}}$
and
 $\dot{\unicode[STIX]{x1D703}}$
in the linear response regime.
The minimum condition of (4.1),
 $$\begin{eqnarray}\left.\begin{array}{@{}c@{}}{\displaystyle \frac{\unicode[STIX]{x2202}\unicode[STIX]{x1D6F7}}{\unicode[STIX]{x2202}{\dot{h}}}}+{\displaystyle \frac{\unicode[STIX]{x2202}A}{\unicode[STIX]{x2202}h}}=0,\\ {\displaystyle \frac{\unicode[STIX]{x2202}\unicode[STIX]{x1D6F7}}{\unicode[STIX]{x2202}\dot{\unicode[STIX]{x1D703}}}}+{\displaystyle \frac{\unicode[STIX]{x2202}A}{\unicode[STIX]{x2202}\unicode[STIX]{x1D703}}}=0,\end{array}\right\}\end{eqnarray}$$
represents the force balance between two kinds of forces, the hydrodynamic frictional force
 $\unicode[STIX]{x2202}\unicode[STIX]{x1D6F7}/\unicode[STIX]{x2202}{\dot{h}}$
(or
 $\unicode[STIX]{x2202}\unicode[STIX]{x1D6F7}/\unicode[STIX]{x2202}\dot{\unicode[STIX]{x1D703}}$
) and reversible force
 $f_{1}=-\unicode[STIX]{x2202}A/\unicode[STIX]{x2202}h$
(or
 $f_{2}=-\unicode[STIX]{x2202}A/\unicode[STIX]{x2202}\unicode[STIX]{x1D703}$
) in the generalized coordinates. The above variational principle can be derived directly from the basic equations of Stokesian hydrodynamics. It can also be regarded as a special form of the Onsager variational principle, which governs the time evolution of non-equilibrium systems characterized by a set of slow variables in the linear response regime (Doi Reference Doi2011, Reference Doi2013). This method as an analysis tool has been applied recently to a range of problems (Doi Reference Doi2015; Di, Xu & Doi Reference Di, Xu and Doi2016; Man & Doi Reference Man and Doi2016; Xu, Di & Doi Reference Xu, Di and Doi2016).
Cylindrical coordinate system
 $(r,\unicode[STIX]{x1D719},\hat{z})$
used in the theoretical analysis of the soap film dynamics. The origin of the coordinate system is taken at the intersection of the fibre axis and mid-plane of the soap film of thickness
 $\ell$
. The total free-energy dissipation
 $\unicode[STIX]{x1D6F7}$
in the soap film contains three contributions,
 $\unicode[STIX]{x1D6F7}=\unicode[STIX]{x1D6F7}_{in}+\unicode[STIX]{x1D6F7}_{mid}+\unicode[STIX]{x1D6F7}_{out}$
, where
 $\unicode[STIX]{x1D6F7}_{in}$
is from the inner region (
 $r_{0}<r\leqslant r_{1}$
),
 $\unicode[STIX]{x1D6F7}_{mid}$
is from the middle region (
 $r_{1}<r\leqslant r_{c}$
) and
 $\unicode[STIX]{x1D6F7}_{out}$
is from the outer region (
 $r>r_{c}$
).

We now use (4.2) to derive the dynamic equations of
 $h(t)$
and
 $\unicode[STIX]{x1D703}(t)$
. For the convenience of theoretical treatment, we use a cylindrical coordinate system
 $(r,\unicode[STIX]{x1D719},\hat{z})$
, as shown in figure 13. The soap film is symmetric with respect to the vertical
 $\hat{z}$
axis. The cylindrical coordinates
 $(r,\hat{z})$
used here are related to the coordinates
 $(x,z)$
used in the previous sections through
 $r=r_{0}+x$
and
 $\hat{z}=\ell /2+z$
. Here
 $r_{0}=d/2$
is the radius of the fibre and
 $\ell$
is the thickness of the soap film.
The meniscus profile is described by a function
 $\hat{z}=\hat{z}(r)$
. We assume that
 $\hat{z}(r)$
is still given by (3.2), but a modification is needed. According to (3.2),
 $\hat{z}$
decreases continuously with increasing
 $r$
, but in reality,
 $\hat{z}(r)$
is limited by the film thickness
 $\ell$
. We thus assume that the meniscus profile is governed by the following equation
 $$\begin{eqnarray}\hat{z}(r;t)=\left\{\begin{array}{@{}ll@{}}H(r;t),\quad & r\leqslant r_{c}(t),\\ \ell /2,\quad & r>r_{c}(t),\end{array}\right.\end{eqnarray}$$
where
 $H(r;t)$
is given by
 $$\begin{eqnarray}H(r;t)=\frac{\ell }{2}+h(t)-r_{0}\cos \unicode[STIX]{x1D703}(t)\ln \left[\frac{r+[r^{2}-r_{0}^{2}\cos ^{2}\unicode[STIX]{x1D703}(t)]^{1/2}}{r_{0}\cos \unicode[STIX]{x1D703}(t)}\right].\end{eqnarray}$$
Equation (4.4) is the same as (3.2) and is written in the coordinate system shown in figure 13. As mentioned above, equation (3.2) is the general solution of (1.3) with two integration constants,
 $h(t)$
and
 $\unicode[STIX]{x1D703}(t)$
, to be determined by the boundary conditions of the meniscus. The horizontal cutoff length
 $r_{c}(t)$
in (4.3) is determined by
 $$\begin{eqnarray}H(r_{c}(t);t)=\frac{\ell }{2}.\end{eqnarray}$$
By comparing figures 8(a) and 13, we have
 $r_{c}=r_{0}+x_{c}$
.
Figure 8(a) shows an example of the resulting meniscus profile
 $z(x,t)$
of the soap film as a function of distance
 $x$
away from the fibre surface. In the plot, both the vertical axis
 $z$
and horizontal axis
 $x$
are normalized by the fibre diameter
 $d(=9~\unicode[STIX]{x03BC}\text{m})$
. It is seen from figure 4 and more clearly from figure 8(a) that the meniscus profile has a finite vertical extent
 $h(t)$
along the fibre surface and a finite horizontal extent
 $x_{c}(t)$
, as marked in figure 8(a),
Since the change in
 $\ell$
is small in the experiment, we consider
 $\ell$
as a constant in our analysis. For the convenience of later analysis, the meniscus profile is also represented by
 $r$
as a function of
 $\hat{z}$
, given by
 $$\begin{eqnarray}r=R(\hat{z})=r_{0}\cos \unicode[STIX]{x1D703}(t)\cosh \left[\frac{h(t)+\ell /2-\hat{z}}{r_{0}\cos \unicode[STIX]{x1D703}(t)}\right],\end{eqnarray}$$
for
 $r\leqslant r_{c}(t)$
.
4.2 Temporal evolution of the height of capillary rise
$h(t)$

To derive the governing equations of
 $h(t)$
and
 $\unicode[STIX]{x1D703}(t)$
with the Onsager principle, we need to calculate the free energy
 $A$
and free-energy dissipation function
 $\unicode[STIX]{x1D6F7}$
of the system. In this section, we briefly present our calculations with more details given in appendices A–C.
We first consider the free energy
 $A$
. Since the vertical length scale of the system is much smaller than the capillary length
 $\unicode[STIX]{x1D706}_{c}$
, one can ignore the gravitational energy and calculate the free energy
 $A$
of the system as a sum of the interfacial energy between the fibre and liquid, denoted by
 $A_{fibre}$
, and the surface energy of the liquid film, denoted by
 $A_{film}$
. They are given by the function
 $H(r)$
as
 $$\begin{eqnarray}\displaystyle & \displaystyle A_{fibre}\simeq -2\unicode[STIX]{x03C0}\unicode[STIX]{x1D6FE}r_{0}\tilde{h}, & \displaystyle\end{eqnarray}$$
 $$\begin{eqnarray}\displaystyle & \displaystyle A_{film}=\unicode[STIX]{x03C0}\unicode[STIX]{x1D6FE}\left(2\int _{r_{0}}^{r_{c}}\sqrt{1+(\unicode[STIX]{x2202}_{r}H)^{2}}r\,\text{d}r-r_{c}^{2}\right), & \displaystyle\end{eqnarray}$$
where
 $\tilde{h}=H(r_{0})=h+\ell /2-r_{0}\cos \unicode[STIX]{x1D703}\ln [(1+\sin \unicode[STIX]{x1D703})/\cos \unicode[STIX]{x1D703}]$
. In the above equations, we have assumed that the fibre is completely wetted by the fluid with the contact angle
 $\unicode[STIX]{x1D703}\approx 0$
.
As the contact angle
 $\unicode[STIX]{x1D703}$
in the experiment is small, we can compute the energies by ignoring higher-order contributions of
 $\unicode[STIX]{x1D703}$
. The details are given in appendix B. For
 $A_{fibre}$
, we have
 $$\begin{eqnarray}A_{fibre}\approx -2\unicode[STIX]{x03C0}\unicode[STIX]{x1D6FE}r_{0}\left(h+\frac{\ell }{2}\right).\end{eqnarray}$$
For
 $A_{film}$
, we have
 $$\begin{eqnarray}A_{film}\approx \unicode[STIX]{x03C0}\unicode[STIX]{x1D6FE}\left(r_{0}^{2}\ln \frac{r_{c}}{r_{0}}-r_{0}^{2}\right).\end{eqnarray}$$
Using the relation between
 $h$
and
 $r_{c}$
(see (A 4) in appendix A), we have
 $$\begin{eqnarray}A_{film}\approx \unicode[STIX]{x03C0}\unicode[STIX]{x1D6FE}r_{0}(h-r_{0}\ln 2-r_{0}).\end{eqnarray}$$
Therefore, the reversible force
 $f_{1}$
is given by
 $$\begin{eqnarray}f_{1}=-\frac{\unicode[STIX]{x2202}A}{\unicode[STIX]{x2202}h}=-\frac{\unicode[STIX]{x2202}A_{film}}{\unicode[STIX]{x2202}h}-\frac{\unicode[STIX]{x2202}A_{fibre}}{\unicode[STIX]{x2202}h}\approx \unicode[STIX]{x03C0}r_{0}\unicode[STIX]{x1D6FE}.\end{eqnarray}$$
It is interesting to note that
 $\unicode[STIX]{x2202}A_{fibre}/\unicode[STIX]{x2202}h\approx -2\unicode[STIX]{x2202}A_{film}/\unicode[STIX]{x2202}h$
, so that the resulting generalized (capillary) force
 $f_{1}$
is a half of the local capillary force
 $f\simeq 2\unicode[STIX]{x03C0}r_{0}\unicode[STIX]{x1D6FE}$
(see (2.1)) acting on the CL without including the effect of the free-energy penalty owing to the area increase of the liquid–air interface.
Next we consider the free-energy dissipation function
 $\unicode[STIX]{x1D6F7}$
. As shown in figure 13, the total free-energy dissipation in the soap film contains three contributions,
 $\unicode[STIX]{x1D6F7}=\unicode[STIX]{x1D6F7}_{in}+\unicode[STIX]{x1D6F7}_{mid}+\unicode[STIX]{x1D6F7}_{out}$
, where
 $\unicode[STIX]{x1D6F7}_{in}$
is from the inner region (
 $r_{0}<r\leqslant r_{1}$
),
 $\unicode[STIX]{x1D6F7}_{mid}$
is from the middle region (
 $r_{1}<r\leqslant r_{c}$
) and
 $\unicode[STIX]{x1D6F7}_{out}$
is from the outer region (
 $r>r_{c}$
). Here
 $r_{1}$
is of the same order of magnitude as
 $r_{0}$
, but the final result is not affected by the choice of
 $r_{1}$
, as will be shown below. In the inner region (
 $r_{0}<r\leqslant r_{1}$
), the free-energy dissipation arises mainly from the flow near the CL. When the CL moves at velocity
 ${\dot{h}}$
, the dissipation function
 $\unicode[STIX]{x1D6F7}_{in}$
in the inner region has the form (de Gennes et al.
Reference de Gennes, Brochard-Wyart and Quéré2004)
 $$\begin{eqnarray}\unicode[STIX]{x1D6F7}_{in}\approx \frac{1}{2}\unicode[STIX]{x1D709}_{in}{\dot{h}}^{2}=\frac{3\unicode[STIX]{x03C0}r_{0}\unicode[STIX]{x1D702}\ln \unicode[STIX]{x1D700}}{\unicode[STIX]{x1D703}}{\dot{h}}^{2},\end{eqnarray}$$
where
 $\unicode[STIX]{x1D709}_{in}$
is given in (1.1).
In the outer region (
 $r>r_{c}$
), the soap film has a constant thickness
 $\ell$
. The fluid velocity is determined by the total inward flux
 $\tilde{a}$
flowing across any circular section of the soap film with a constant
 $r$
. The flux
 $\tilde{a}$
is related to the change of the fluid volume
 $V_{meni}$
in the region
 $r\leqslant r_{c}$
:
 $$\begin{eqnarray}\tilde{a}=\frac{\text{d}V_{meni}}{\text{d}t}.\end{eqnarray}$$
Direct computation leads to
 $$\begin{eqnarray}\tilde{a}=\unicode[STIX]{x03C0}r_{0}r_{c}{\dot{r}}_{c}\approx \unicode[STIX]{x03C0}r_{c}^{2}{\dot{h}},\end{eqnarray}$$
with more details given in appendix C. Then the radial velocity of the fluid is given by
 $$\begin{eqnarray}u_{r}=\frac{\tilde{a}}{2\unicode[STIX]{x03C0}r(\ell /2)}=\frac{r_{c}^{2}{\dot{h}}}{r\ell }.\end{eqnarray}$$
The free-energy dissipation function in the outer region is given by
 $$\begin{eqnarray}\unicode[STIX]{x1D6F7}_{out}=2\unicode[STIX]{x03C0}\unicode[STIX]{x1D702}\int _{r_{c}}^{R_{\infty }}\left[(\unicode[STIX]{x2202}_{r}u_{r})^{2}+\left(\frac{u_{r}}{r}\right)^{2}\right]\frac{\ell }{2}r\,\text{d}r\approx \frac{\unicode[STIX]{x03C0}r_{c}^{2}\unicode[STIX]{x1D702}}{\ell }{\dot{h}}^{2},\end{eqnarray}$$
where
 $R_{\infty }$
is the outer radius of the soap film, which is assumed to be much larger than
 $r_{c}$
.
In the middle region (
 $r_{1}<r\leqslant r_{c}$
), the radial velocity
 $u_{r}$
is determined by the equation for volume conservation:
 $$\begin{eqnarray}\frac{\unicode[STIX]{x2202}H}{\unicode[STIX]{x2202}t}=-\frac{1}{r}\frac{\unicode[STIX]{x2202}}{\unicode[STIX]{x2202}r}(rH(r)u_{r}),\end{eqnarray}$$
in which
 $u_{r}$
satisfies the boundary condition
 $$\begin{eqnarray}u_{r}(r_{c})=\frac{\tilde{a}}{2\unicode[STIX]{x03C0}r_{c}(\ell /2)}=\frac{r_{c}{\dot{h}}}{\ell }.\end{eqnarray}$$
Integrating (4.18) leads to
 $$\begin{eqnarray}u_{r}=\frac{1}{rH(r)}\left(\frac{r_{c}^{2}{\dot{h}}}{2}+\int _{r}^{r_{c}}r\frac{\unicode[STIX]{x2202}H}{\unicode[STIX]{x2202}t}\,\text{d}r\right)=\frac{{\dot{h}}}{rH}\left(r_{c}^{2}-\frac{r^{2}}{2}\right),\end{eqnarray}$$
with the help of the relation
 $\unicode[STIX]{x2202}H/\unicode[STIX]{x2202}t\approx {\dot{h}}$
(see (A 2) in appendix A). Then the dissipation function in the middle region is obtained as
 $$\begin{eqnarray}\unicode[STIX]{x1D6F7}_{mid}=2\unicode[STIX]{x03C0}\unicode[STIX]{x1D702}\int _{r_{1}}^{r_{c}}\left[(\unicode[STIX]{x2202}_{r}u_{r})^{2}+\left(\frac{u_{r}}{r}\right)^{2}\right]H(r)r\,\text{d}r\approx \frac{\unicode[STIX]{x03C0}\unicode[STIX]{x1D702}r_{0}r_{c}^{2}}{\ell ^{2}}{\dot{h}}^{2},\end{eqnarray}$$
with more details given in appendix C.
Combining the above dissipation functions, we have the total free-energy dissipation function
 $$\begin{eqnarray}\unicode[STIX]{x1D6F7}=\frac{3\unicode[STIX]{x03C0}r_{0}\unicode[STIX]{x1D702}\ln \unicode[STIX]{x1D700}}{\unicode[STIX]{x1D703}}{\dot{h}}^{2}+\unicode[STIX]{x03C0}r_{0}\unicode[STIX]{x1D702}\left(\frac{r_{c}^{2}}{\ell ^{2}}\right){\dot{h}}^{2}+\unicode[STIX]{x03C0}r_{c}\unicode[STIX]{x1D702}\left(\frac{r_{c}}{\ell }\right){\dot{h}}^{2}.\end{eqnarray}$$
Since
 $\ell$
is very small, it is assumed that
 $(\ell /r_{c})^{2}\ll \unicode[STIX]{x1D703}\ll 1$
. Then the leading order of the dissipation function is
 $$\begin{eqnarray}\unicode[STIX]{x1D6F7}\simeq \frac{\unicode[STIX]{x03C0}r_{0}\unicode[STIX]{x1D702}r_{c}^{2}}{\ell ^{2}}{\dot{h}}^{2},\end{eqnarray}$$
from the middle region (
 $r_{1}<r\leqslant r_{c}$
).
Using (4.2), (4.12) and (4.23), we have
 $$\begin{eqnarray}\frac{2r_{c}^{2}}{\ell ^{2}}{\dot{h}}=\frac{\unicode[STIX]{x1D6FE}}{\unicode[STIX]{x1D702}},\end{eqnarray}$$
with
 ${\dot{h}}$
being smaller than the capillary speed
 $\unicode[STIX]{x1D6FE}/\unicode[STIX]{x1D702}$
by a factor of
 $(\ell /r_{c})^{2}\ll 1$
. Using
 $r_{c}\approx r_{0}\cosh (h/r_{0})$
(see (A 7) in appendix A), we have
 $$\begin{eqnarray}r_{c}^{2}\approx r_{0}^{2}\cosh ^{2}(h/r_{0})\approx (r_{0}^{2}/4)\exp (2h/r_{0}).\end{eqnarray}$$
Equation (4.24) then becomes
 $$\begin{eqnarray}\frac{r_{0}^{2}}{\ell ^{2}}\exp \left(\frac{2h}{r_{0}}\right){\dot{h}}=\frac{2\unicode[STIX]{x1D6FE}}{\unicode[STIX]{x1D702}},\end{eqnarray}$$
and its solution is given by
 $$\begin{eqnarray}h=\frac{r_{0}}{2}\ln (4\unicode[STIX]{x1D6E4}t+4c_{0}),\end{eqnarray}$$
where
 $\unicode[STIX]{x1D6E4}=(\unicode[STIX]{x1D6FE}/\unicode[STIX]{x1D702}r_{0})(\ell /r_{0})^{2}\equiv \unicode[STIX]{x1D6E4}_{0}(\ell /r_{0})^{2}$
is a rate coefficient and
 $c_{0}$
is a constant determined by the initial condition. Note that for thick films with
 $\ell >2r_{0}$
, the rate coefficient scales as
 $\unicode[STIX]{x1D6E4}_{0}=\unicode[STIX]{x1D6FE}/\unicode[STIX]{x1D702}r_{0}$
. For thin films considered here, the rate coefficient is reduced by a factor of
 $(\ell /r_{0})^{2}\ll 1$
, compared with that for thick films.
Equation (4.27) states that the height of capillary rise
 $h(t)$
for a thin liquid film increases logarithmically in time
 $t$
. This is much slower than the standard capillary rise for a bulk fluid, in which the height
 $h(t)$
increases as a power law of
 $t$
(Quéré, Di Meglio & Brochard-Wyart Reference Quéré, Di Meglio and Brochard-Wyart1988; Clanet & Quéré Reference Clanet and Quéré2002). The slow capillary rise of the thin film along a vertical fibre is caused by the fact that the liquid flow inside the soap film is subjected to a severe confinement over a large area (
 ${\sim}\unicode[STIX]{x03C0}r_{c}^{2}$
). This flow thus involves a large viscous dissipation in the middle region of the soap film, which slows down the capillary rise. For a bulk fluid without confinement, however, the viscous dissipation of the flow occurs mainly in the inner region near the CL, which is more localized and less dissipative.
The solid lines in figure 10 show the fits of (4.27) to the two sets of data obtained from two soap film systems. It is seen that the two data sets are well described by (4.27) with two fitting parameters,
 $c_{0}$
and
 $\unicode[STIX]{x1D6E4}$
. The black circles are fit with
 $c_{0}=4.0$
and
 $\unicode[STIX]{x1D6E4}=0.9$
(black line), and red triangles are fit with
 $c_{0}=1.8$
and
 $\unicode[STIX]{x1D6E4}=0.05$
(red line).
4.3 Friction on a hanging fibre
It is shown in (4.22) that the total free-energy dissipation
 $\unicode[STIX]{x1D6F7}$
in the soap film contains contributions from three regions. Correspondingly, the total friction coefficient
 $\unicode[STIX]{x1D709}_{tot}$
, which is defined by the equation
 $\unicode[STIX]{x1D6F7}\equiv (1/2)\unicode[STIX]{x1D709}_{tot}{\dot{h}}^{2}$
, can be written as
 $\unicode[STIX]{x1D709}_{tot}=\unicode[STIX]{x1D709}_{in}+\unicode[STIX]{x1D709}_{mid}+\unicode[STIX]{x1D709}_{out}$
, where
 $\unicode[STIX]{x1D709}_{in}$
,
 $\unicode[STIX]{x1D709}_{mid}$
and
 $\unicode[STIX]{x1D709}_{out}$
are, respectively, the contributions from the inner, middle and outer regions. From the above derivations, one can readily show that the dimensionless friction coefficient in the middle region goes as,
 $\unicode[STIX]{x1D709}_{mid}/(2\unicode[STIX]{x03C0}r_{0}\unicode[STIX]{x1D702})=(r_{c}/\ell )^{2}\simeq (\unicode[STIX]{x1D6FE}/r_{0}\unicode[STIX]{x1D702})t$
, for large values of
 $t$
. Similarly, in the outer region we find
 $\unicode[STIX]{x1D709}_{out}/(2\unicode[STIX]{x03C0}r_{0}\unicode[STIX]{x1D702})\simeq (\ell /r_{0})(\unicode[STIX]{x1D6FE}/r_{0}\unicode[STIX]{x1D702})t$
for large values of
 $t$
. For typical values of
 $\unicode[STIX]{x1D6FE}/r_{0}\unicode[STIX]{x1D702}\sim 10^{7}~\text{s}^{-1}$
(see introduction),
 $t\sim 100~\text{s}$
(see figure 12), and
 $\ell /r_{0}\sim 10^{-2}$
(see discussions on figure 14 below) used in the experiment, we find
 $\unicode[STIX]{x1D709}_{mid}/(2\unicode[STIX]{x03C0}r_{0}\unicode[STIX]{x1D702})\gtrsim 10^{9}$
and
 $\unicode[STIX]{x1D709}_{out}/(2\unicode[STIX]{x03C0}r_{0}\unicode[STIX]{x1D702})\gtrsim 10^{7}$
, which are too large to be excited by a vertically oscillating thin fibre (see figure 14 below). As a result, the hanging fibre probe only feels the viscous damping caused by the fluid in the inner region of the soap film, with which it has a direct contact. The measured friction coefficient
 $\unicode[STIX]{x1D709}_{s}$
, as shown in figure 12, is therefore directly related to the energy dissipation
 $\unicode[STIX]{x1D6F7}_{in}$
associated with the fluid motion near the CL, which is given by (4.13).
From (4.13), we have the relation
 $$\begin{eqnarray}\unicode[STIX]{x1D709}_{in}{\dot{h}}=2\frac{\unicode[STIX]{x2202}\unicode[STIX]{x1D6F7}_{in}}{\unicode[STIX]{x2202}{\dot{h}}},\end{eqnarray}$$
where the factor 2 accounts for the two menisci on the upper and lower sides of the soap film. The friction coefficient
 $\unicode[STIX]{x1D709}_{in}$
is given by
 $$\begin{eqnarray}\unicode[STIX]{x1D709}_{in}(t)=\frac{12\unicode[STIX]{x03C0}r_{0}\unicode[STIX]{x1D702}\ln \unicode[STIX]{x1D700}}{\unicode[STIX]{x1D703}(t)},\end{eqnarray}$$
where the time dependence of
 $\unicode[STIX]{x1D709}_{in}(t)$
results from the temporal evolution of the dynamic contact angle
 $\unicode[STIX]{x1D703}(t)$
. To calculate the temporal evolution of
 $\unicode[STIX]{x1D703}(t)$
using (4.2), one needs to consider higher-order terms (h.o.t.) to the free energy
 $A$
and dissipation function
 $\unicode[STIX]{x1D6F7}$
(i.e. beyond
 $\unicode[STIX]{x1D703}\approx 0$
).
Scaling plot of the normalized side wall friction coefficient
 $\unicode[STIX]{x1D709}_{s}/\unicode[STIX]{x03C0}d\unicode[STIX]{x1D702}$
as a function of the normalized fibre creeping time
 $\unicode[STIX]{x1D6E4}t$
for the five sets of data shown in figure 12. Here
 $\unicode[STIX]{x03C0}d$
is the contact length,
 $\unicode[STIX]{x1D702}$
is the soap fluid viscosity, and the colour code used is the same as that in figure 12. The solid line shows a fit of (4.38) to the data points with the fitting parameters
 $\unicode[STIX]{x1D716}=1.105$
,
 $c_{\unicode[STIX]{x1D703}0}=-0.118$
and
 $c_{0}=1.8$
.

The computation for the free energy
 $A$
is relatively easy (see (B 5) in appendix B). Using the formula for
 $A$
, we obtain
 $$\begin{eqnarray}f_{2}=-\frac{\unicode[STIX]{x2202}A}{\unicode[STIX]{x2202}\unicode[STIX]{x1D703}}\approx \unicode[STIX]{x03C0}\unicode[STIX]{x1D6FE}r_{0}^{2}\left(\frac{h}{r_{0}}-1\right)\unicode[STIX]{x1D703}-\unicode[STIX]{x03C0}\unicode[STIX]{x1D6FE}r_{0}^{2}\unicode[STIX]{x1D703}^{2}+\mathit{h.o.t}.\end{eqnarray}$$
The computation for the free-energy dissipation function
 $\unicode[STIX]{x1D6F7}$
, however, is more involved. In appendix C, we compute the higher-order contributions to the dissipation function and obtain (see (C 16))
 $$\begin{eqnarray}\unicode[STIX]{x1D6F7}\approx \frac{\unicode[STIX]{x03C0}\unicode[STIX]{x1D702}r_{0}r_{c}^{2}}{\ell ^{2}}({\dot{h}}+\unicode[STIX]{x1D6FC}r_{0}\unicode[STIX]{x1D703}\dot{\unicode[STIX]{x1D703}})^{2},\end{eqnarray}$$
where
 $\unicode[STIX]{x1D6FC}=h/r_{0}-\tanh (h/r_{0})\approx h/r_{0}-1$
. Using (4.2), (4.30) and (4.31), we have
 $$\begin{eqnarray}\frac{2\unicode[STIX]{x03C0}\unicode[STIX]{x1D702}\unicode[STIX]{x1D6FC}r_{0}^{2}r_{c}^{2}\unicode[STIX]{x1D703}}{\ell ^{2}}({\dot{h}}+\unicode[STIX]{x1D6FC}r_{0}\unicode[STIX]{x1D703}\dot{\unicode[STIX]{x1D703}})=\unicode[STIX]{x03C0}\unicode[STIX]{x1D6FE}r_{0}^{2}\left(\frac{h}{r_{0}}-1\right)\unicode[STIX]{x1D703}-\unicode[STIX]{x03C0}\unicode[STIX]{x1D6FE}r_{0}^{2}\unicode[STIX]{x1D703}^{2}.\end{eqnarray}$$
Using (4.24) for
 ${\dot{h}}$
, we find that the first-order terms in
 $\unicode[STIX]{x1D703}$
cancel out and (4.32) becomes
 $$\begin{eqnarray}\frac{2\unicode[STIX]{x1D702}r_{0}r_{c}^{2}}{\ell ^{2}}\left(\frac{h}{r_{0}}-1\right)^{2}\dot{\unicode[STIX]{x1D703}}=-\unicode[STIX]{x1D6FE}.\end{eqnarray}$$
Equivalently,
 $$\begin{eqnarray}\dot{\unicode[STIX]{x1D703}}=-\frac{\unicode[STIX]{x1D6FE}\ell ^{2}}{2\unicode[STIX]{x1D702}(h/r_{0}-1)^{2}r_{0}r_{c}^{2}}=-\frac{{\dot{h}}/r_{0}}{(h/r_{0}-1)^{2}},\end{eqnarray}$$
where (4.24) is used again. This leads to
 $$\begin{eqnarray}\unicode[STIX]{x1D703}(t)=c_{\unicode[STIX]{x1D703}0}+\frac{1}{h/r_{0}-1}=c_{\unicode[STIX]{x1D703}0}+\left(\frac{1}{2}\ln (4\unicode[STIX]{x1D6E4}t+4c_{0})-1\right)^{-1},\end{eqnarray}$$
where
 $c_{\unicode[STIX]{x1D703}0}$
is a constant to be determined by the initial value of
 $\unicode[STIX]{x1D703}$
, and the last equality of (4.35) is obtained using (4.27). From (4.29) and (4.35), we find
 $$\begin{eqnarray}\unicode[STIX]{x1D709}_{in}=\frac{12\unicode[STIX]{x03C0}r_{0}\unicode[STIX]{x1D702}\ln \unicode[STIX]{x1D700}}{c_{\unicode[STIX]{x1D703}0}+((1/2)\ln (4\unicode[STIX]{x1D6E4}t+4c_{0})-1)^{-1}}.\end{eqnarray}$$
We now compare the theoretical prediction with the experiment. According to (4.36), the normalized friction coefficient
 $\unicode[STIX]{x1D709}_{in}/(\unicode[STIX]{x03C0}d\unicode[STIX]{x1D702})$
is a universal function of
 $\unicode[STIX]{x1D6E4}t$
for all the soap film systems with different values of fibre diameter
 $d$
(
 $=2r_{0}$
), film viscosity
 $\unicode[STIX]{x1D702}$
, film thickness
 $\ell$
and surface tension
 $\unicode[STIX]{x1D6FE}$
. Figure 14 is a scaling plot of the experimental data shown in figure 12. In this plot, the vertical axis is the normalized side wall friction coefficient
 $\unicode[STIX]{x1D709}_{s}/(\unicode[STIX]{x03C0}d\unicode[STIX]{x1D702})$
, where
 $\unicode[STIX]{x1D709}_{s}(t)$
is defined as
 $$\begin{eqnarray}\unicode[STIX]{x1D709}_{s}(t)\equiv \unicode[STIX]{x0394}\unicode[STIX]{x1D709}(t)-\unicode[STIX]{x1D709}_{c}=\unicode[STIX]{x1D709}(t)-\unicode[STIX]{x1D709}_{a}-\unicode[STIX]{x1D709}_{c}.\end{eqnarray}$$
In the above,
 $\unicode[STIX]{x1D709}(t)$
is measured total friction coefficient,
 $\unicode[STIX]{x1D709}_{a}$
is the friction coefficient measured in air and
 $\unicode[STIX]{x1D709}_{c}$
is the friction coefficient of the two contact lines given in (3.5). The horizontal axis is the normalized fibre creeping time
 $\unicode[STIX]{x1D6E4}t$
with
 $\unicode[STIX]{x1D6E4}$
being the rate coefficient given in (4.27). From the AFM force measurement, we estimate the film thickness
 $\ell$
of the red circles to be approximately
 $\ell \simeq 20~\text{nm}$
. With this value of
 $\ell$
and the known values of
 $d$
,
 $\unicode[STIX]{x1D702}$
and
 $\unicode[STIX]{x1D6FE}$
, we calculate the value of
 $\unicode[STIX]{x1D6E4}$
for the red circles. For all other sets of data, we use
 $\unicode[STIX]{x1D6E4}$
(or equivalently
 $\ell$
) as a fitting variable to scale the data horizontally. It is seen from figure 14 that all the data sets can be collapsed on to a single master curve, once
 $\unicode[STIX]{x1D6E4}t$
is used as the scaling variable. The fitted values of
 $\unicode[STIX]{x1D6E4}$
and the corresponding values of
 $\ell$
are given in table 1. The obtained values of
 $\ell$
are all in the expected range of the film thickness.
Five soap film samples used in the experiment with different values of fibre diameter
 $d$
and soap film viscosity
 $\unicode[STIX]{x1D702}$
. The surface tension of all the soap films is
 $\unicode[STIX]{x1D6FE}=23.2~\text{mN}~\text{m}^{-1}$
. The obtained values of the fitting parameter
 $\unicode[STIX]{x1D6E4}$
used in the scaling plot shown in figure 14 and the corresponding values of the film thickness
 $\ell$
are listed in the fifth and sixth columns, respectively.

To further test the functional form of the obtained master curve in figure 14, we rewrite (4.36) as
 $$\begin{eqnarray}\frac{\unicode[STIX]{x1D709}_{in}}{2\unicode[STIX]{x03C0}r_{0}\unicode[STIX]{x1D702}}=\frac{6\ln \unicode[STIX]{x1D700}}{c_{\unicode[STIX]{x1D703}0}+((1/2)\ln [4(\unicode[STIX]{x1D6E4}t+c_{0})]-1)^{-1}}.\end{eqnarray}$$
The solid line in figure 14 shows a fit of (4.38) to the data points with
 $\unicode[STIX]{x1D700}$
,
 $c_{\unicode[STIX]{x1D703}0}$
and
 $c_{0}$
as three fitting parameters. It is seen that the experimental data are well described by (4.38). The fitted value of
 $c_{0}$
is of the order of unity and is much smaller than the values of
 $\unicode[STIX]{x1D6E4}t$
shown in figure 14. This is true even for the smallest value of
 $\unicode[STIX]{x1D6E4}t$
achieved in the experiment. Therefore, the effect of
 $c_{0}$
in the fitting to (4.38) is negligible. It is seen from (4.35) that
 $c_{\unicode[STIX]{x1D703}0}$
is related to the initial value of the contact angle and causes the value of
 $\unicode[STIX]{x1D709}_{in}$
to level off at short times, as shown in figure 14. From the fitted value of the parameters, we find
 $\unicode[STIX]{x1D703}(t)=0.011$
(or
 $0.63^{\circ }$
) when
 $\unicode[STIX]{x1D6E4}t=10^{7}$
. As shown in (1.1), the value of
 $\unicode[STIX]{x1D700}$
in the wedge-shaped region away from the CL is expected to be
 $\unicode[STIX]{x1D700}\simeq R/a$
(de Gennes et al.
Reference de Gennes, Brochard-Wyart and Quéré2004), where
 $R=r_{1}\simeq 2r_{0}$
is the upper cutoff length of the inner range and
 $a\;(\simeq 1~nm)$
is the lower cutoff length away from the moving CL. With the average value of fibre radius
 $r_{0}=1.065~\unicode[STIX]{x03BC}\text{m}$
from the five samples shown in table 1, we have
 $\unicode[STIX]{x1D709}_{in}/(2\unicode[STIX]{x03C0}r_{0}\unicode[STIX]{x1D702})\simeq 46/\unicode[STIX]{x1D703}(t)$
(
 $\simeq 4180$
when
 $\unicode[STIX]{x1D6E4}t=10^{7}$
), which is about 70 times larger than the measured value.
In deriving (4.38) (and (1.1)), one has assumed that there is a relative motion between the solid surface and liquid layer in the entire inner range until the distance
 $z$
away from the moving CL reaches the lower cutoff length
 $a\;(\simeq 1~\text{nm})$
. This assumption, however, is not valid for an oscillating fibre used in the experiment. When the fibre oscillates along its long axis with a angular frequency
 $\unicode[STIX]{x1D714}_{0}$
, the viscous shear wave can only penetrate into a thin fluid layer of thickness
 $\unicode[STIX]{x1D6FF}=(2\unicode[STIX]{x1D708}/\unicode[STIX]{x1D714}_{0})^{1/2}$
from the fibre surface (Landau & Lifshitz Reference Landau and Lifshitz1986), where
 $\unicode[STIX]{x1D708}=\unicode[STIX]{x1D702}/\unicode[STIX]{x1D70C}$
is the kinematic viscosity. This layer of fluid will oscillate in phase with the fibre, contributing only an added mass and no dissipation to the oscillating fibre. For liquids with
 $\unicode[STIX]{x1D702}\gtrsim 1~\text{cP}$
and
 $\unicode[STIX]{x1D714}_{0}\simeq 2\unicode[STIX]{x03C0}\times 120~\text{kHz}$
, we have
 $\unicode[STIX]{x1D6FF}\gtrsim 1.6~\unicode[STIX]{x03BC}\text{m}$
. Consequently, the cutoff length
 $a$
, above which the hydrodynamic friction becomes relevant, is increased considerably. If one sets
 $a=1.6~\unicode[STIX]{x03BC}\text{m}$
, the value of
 $\ln \unicode[STIX]{x1D700}$
in (4.38) becomes
 $\ln \unicode[STIX]{x1D700}\simeq \ln (2.13/1.6)\simeq 0.286$
, which is approximately 30 times smaller than the typical value of
 $\ln \unicode[STIX]{x1D700}$
with
 $a\simeq 1~\text{nm}$
. This estimated value of
 $\unicode[STIX]{x1D700}\simeq 1.33$
is very close to the fitted value of
 $\unicode[STIX]{x1D716}=1.105$
and thus explains the fitting results shown in figure 14. The above discussion suggests that the oscillatory Brownian motion of the glass fibre itself introduces a new lower cutoff length
 $a$
, which prevents the viscous dissipation from being divergent at the zero contact angle limit.
There is an additional frequency-dependent friction coefficient
 $\unicode[STIX]{x1D709}_{ac}$
, resulting from the vertical oscillation of the glass fibre at the angular frequency
 $\unicode[STIX]{x1D714}_{0}$
(Landau & Lifshitz Reference Landau and Lifshitz1986; Xiong et al.
Reference Xiong, Guo, Xu, Sheng and Tong2009). It was shown that
 $\unicode[STIX]{x1D709}_{ac}$
takes the form (Xiong et al.
Reference Xiong, Guo, Xu, Sheng and Tong2009; Guo et al.
Reference Guo, Gao, Xiong, Wang, Wang, Sheng and Tong2013)
 $$\begin{eqnarray}\unicode[STIX]{x1D709}_{ac}\simeq 2\unicode[STIX]{x03C0}\unicode[STIX]{x1D702}h\left(\frac{r_{0}}{\unicode[STIX]{x1D6FF}}\right)=\unicode[STIX]{x03C0}\unicode[STIX]{x1D702}r_{0}\left(\frac{r_{0}}{\unicode[STIX]{x1D6FF}}\right)\ln (4\unicode[STIX]{x1D6E4}t+4c_{0}),\end{eqnarray}$$
where (4.27) was used to obtain the second equality in (4.39). We compute the value of
 $\unicode[STIX]{x1D709}_{ac}$
with the experimental parameters given in table 1 and find it is approximately 10 times smaller than the frequency-independent friction coefficient
 $\unicode[STIX]{x1D709}_{in}$
given in (4.36). Therefore, the contribution from
 $\unicode[STIX]{x1D709}_{ac}$
is ignored in the fitting shown in figure 14.
5 Conclusion
We have carried out a combined experimental and theoretical study of the confinement effect of thin soap films on the dynamics of spreading along a vertical micron-sized glass fibre. In the experiment, we built an optical imaging system to monitor the development of the meniscus of a freely suspended soap film in the vicinity of the vertical glass fibre as a function of fibre creeping time
 $t$
after it pierces through the soap film at
 $t=0$
. For a thin soap film with its thickness
 $\ell$
being smaller than the fibre diameter
 $d$
, we find the soap film creeps slowly along the glass fibre during the entire observation time up to hours. The speed of the creeping flow along the glass fibre depends sensitively on the film thickness
 $\ell$
when it is in the thin film regime (
 $\ell \lesssim d$
). The shape of the evolving film meniscus is found to have a similar functional form as the equilibrium profile given in (3.2) with a time-dependent height of capillary rise
 $h(t)$
on the fibre surface. The slow dynamics of thin film spreading varies logarithmically with time
 $t$
(i.e. goes as
 $\ln (\unicode[STIX]{x1D6E4}t)$
) at the long-time limit, which is different from the power-law relaxation as described by Tanner’s law for spreading of an unconfined fluid near a moving CL. Such a logarithmic relaxation is also observed in the measured viscous friction coefficient
 $\unicode[STIX]{x1D709}_{s}(t)$
felt by the glass fibre in contact with a soap film, when the film creeps slowly along the glass fibre with a decreasing contact angle
 $\unicode[STIX]{x1D703}(t)$
.
To explain the observed time dependence of the height of capillary rise
 $h(t)$
and friction coefficient
 $\unicode[STIX]{x1D709}_{s}(t)$
of the soap film, we used the Onsager variational principle and obtained the equations of motion to describe the dynamics of two important parameters in thin film spreading, namely, the height of capillary rise
 $h(t)$
and contact angle
 $\unicode[STIX]{x1D703}(t)$
. The newly derived equations of motion provide the analytical solutions of
 $h(t)$
and
 $\unicode[STIX]{x1D703}(t)$
, which are found to be in good agreement with the experimental results. It is shown that the height of capillary rise
 $h(t)$
reaches its equilibrium value logarithmically in time
 $t$
at the long-time limit (i.e.
 $h(t)\sim \ln (\unicode[STIX]{x1D6E4}t)$
). The relaxation rate
 $\unicode[STIX]{x1D6E4}$
for a thin film is given by
 $\unicode[STIX]{x1D6E4}\simeq \unicode[STIX]{x1D6E4}_{0}[\ell /(d/2)]^{2}$
, where
 $\unicode[STIX]{x1D6E4}_{0}$
is the relaxation rate for spreading of an unconfined fluid along a fibre and the factor
 $[\ell /(d/2)]^{2}$
is caused by the confinement effect of the thin film. It is also shown that the normalized friction coefficient,
 $\unicode[STIX]{x1D709}_{s}/(\unicode[STIX]{x03C0}d\unicode[STIX]{x1D702})\sim 1/\unicode[STIX]{x1D703}(t)$
, is a universal function of
 $\unicode[STIX]{x1D6E4}t$
. Indeed, the values of
 $\unicode[STIX]{x1D709}_{s}/(\unicode[STIX]{x03C0}d\unicode[STIX]{x1D702})$
obtained under different experimental conditions, such as different values of fibre diameter
 $d$
, film viscosity
 $\unicode[STIX]{x1D702}$
, film thickness
 $\ell$
and surface tension
 $\unicode[STIX]{x1D6FE}$
, are found to collapse on to a master curve, once they are plotted as a scaling function of
 $\unicode[STIX]{x1D6E4}t$
, which was varied by more than three decades. The successful application of the Onsager variational principle to the problem of thin film spreading allows us to have a better understanding of the confinement effect of thin films on the dynamics of spreading along a fibre. Such an understanding is relevant to many industrial processes, such as development of liquid foams, drainage and drying of paints and foams, liquid wetting and wicking on nano-structured surfaces, capillary condensation on solid walls, coating on fibrous materials and multi-phase flow in porous media.
Acknowledgement
This work was supported in part by the Hong Kong Research Grants Council under grant nos. C6004-14G (T.Q. and P.T.), 16302816 (P.T.) and C1018-17G (T.Q.) and by the National Natural Science Foundation of China under project nos. 11571354 (X.X.), 91630208 (X.X.), 91641107 (Y.D.), 21434001 (M.D.) and 11421110001 (M.D.). M.D. also acknowledges support through the China Thousand Talents Program. S.G. and X.X. contributed equally to this work.
Appendix A. Approximation of some geometric parameters
Following the experimental observations, the meniscus profile is given by (4.4). We now derive approximations for some geometric parameters of the soap film with the assumption that
 $\unicode[STIX]{x1D703}$
is small. First, to the leading order, equation (4.4) can be written as
 $$\begin{eqnarray}\hat{z}=H(r,t)\approx h(t)+\frac{\ell }{2}-r_{0}\ln \left(\frac{r+\sqrt{r^{2}-r_{0}^{2}}}{r_{0}}\right).\end{eqnarray}$$
This implies that
 $$\begin{eqnarray}\frac{\unicode[STIX]{x2202}H}{\unicode[STIX]{x2202}t}\approx {\dot{h}},\end{eqnarray}$$
and
 $$\begin{eqnarray}\frac{\unicode[STIX]{x2202}H}{\unicode[STIX]{x2202}r}\approx -\frac{r_{0}}{r},\end{eqnarray}$$
when
 $r\gg r_{0}$
. Noticing that
 $H(r_{c})=\ell /2$
and
 $r_{c}\gg r_{0}$
, we have
 $$\begin{eqnarray}h(t)\approx r_{0}\ln \left(\frac{r_{c}+\sqrt{r_{c}^{2}-r_{0}^{2}}}{r_{0}}\right)\approx r_{0}\ln \left(\frac{2r_{c}}{r_{0}}\right)=r_{0}\left[\ln \left(\frac{r_{c}}{r_{0}}\right)+\ln 2\right].\end{eqnarray}$$
This equation implies that
 $$\begin{eqnarray}{\dot{h}}\approx \frac{r_{0}}{r_{c}}{\dot{r}}_{c},\quad \text{or equivalently,}\quad {\dot{r}}_{c}\approx \frac{r_{c}}{r_{0}}{\dot{h}}.\end{eqnarray}$$
Second, from (4.6), we have
 $$\begin{eqnarray}r=R(\hat{z})\approx r_{0}\cosh \left(\frac{h+\ell /2-\hat{z}}{r_{0}}\right).\end{eqnarray}$$
This equation implies that
 $$\begin{eqnarray}r_{c}=R\left(\frac{\ell }{2}\right)=r_{0}\cosh \left(\frac{h}{r_{0}}\right).\end{eqnarray}$$
It is easy to see that (A 4) and (A 7) are equivalent in the leading-order approximation.
Appendix B. Approximation of surface energies
The total surface energy of the system includes two parts, namely, the surface energy on the fibre
 $A_{fibre}$
and surface energy of the liquid film
 $A_{film}$
:
 $$\begin{eqnarray}\displaystyle & \displaystyle A_{fibre}=-2\unicode[STIX]{x03C0}\unicode[STIX]{x1D6FE}r_{0}\tilde{h}, & \displaystyle\end{eqnarray}$$
 $$\begin{eqnarray}\displaystyle & \displaystyle A_{film}=\unicode[STIX]{x03C0}\unicode[STIX]{x1D6FE}\left(2\int _{r_{0}}^{r_{c}}\sqrt{1+(\unicode[STIX]{x2202}_{r}H)^{2}}r\,\text{d}r-r_{c}^{2}\right). & \displaystyle\end{eqnarray}$$
Here
 $\tilde{h}=H(r_{0})=h+\ell /2-r_{0}\cos \unicode[STIX]{x1D703}\ln ((1+\sin \unicode[STIX]{x1D703})/\cos \unicode[STIX]{x1D703})$
. In
 $A_{fibre}$
, we ignore a constant term,
 $2\unicode[STIX]{x03C0}r_{0}\unicode[STIX]{x1D6FE}_{SV}L$
, with
 $\unicode[STIX]{x1D6FE}_{SV}$
and
 $L$
being, respectively, the surface energy density and total length of the fibre. In
 $A_{film}$
, we ignore a constant term,
 $\unicode[STIX]{x03C0}\unicode[STIX]{x1D6FE}R_{\infty }^{2}$
, with
 $R_{\infty }$
being the outer radius of the soap film.
Leading-order approximation. Suppose that
 $\unicode[STIX]{x1D703}$
and
 $\ell$
are small. We retain the leading-order term and ignore the higher-order terms. For
 $A_{fibre}$
, we have
 $$\begin{eqnarray}A_{fibre}=-2\unicode[STIX]{x03C0}\unicode[STIX]{x1D6FE}r_{0}\left(h+\frac{\ell }{2}-r_{0}\cos \unicode[STIX]{x1D703}\ln \frac{1+\sin \unicode[STIX]{x1D703}}{\cos \unicode[STIX]{x1D703}}\right)\approx -2\unicode[STIX]{x03C0}\unicode[STIX]{x1D6FE}r_{0}\left(h+\frac{\ell }{2}\right).\end{eqnarray}$$
For
 $A_{film}$
, we have
 $$\begin{eqnarray}\displaystyle A_{film} & = & \displaystyle \unicode[STIX]{x03C0}\unicode[STIX]{x1D6FE}\left(2\int _{r_{0}}^{r_{c}}\sqrt{1+(\unicode[STIX]{x2202}_{r}H)^{2}}r\,\text{d}r-r_{c}^{2}\right)\approx \unicode[STIX]{x03C0}\unicode[STIX]{x1D6FE}\left(2\int _{r_{0}}^{r_{c}}\left(1+\frac{(\unicode[STIX]{x2202}_{r}H)^{2}}{2}\right)r\,\text{d}r-r_{c}^{2}\right)\nonumber\\ \displaystyle & = & \displaystyle \unicode[STIX]{x03C0}\unicode[STIX]{x1D6FE}\left(\int _{r_{0}}^{r_{c}}(\unicode[STIX]{x2202}_{r}H)^{2}r\,\text{d}r-r_{0}^{2}\right)\approx \unicode[STIX]{x03C0}\unicode[STIX]{x1D6FE}\left(r_{0}^{2}\ln \frac{r_{c}}{r_{0}}-r_{0}^{2}\right).\end{eqnarray}$$
Here we used (A 3) to obtain the last equality.
Higher-order approximation. Further calculations are needed to compute the higher-order terms in the expression of the free energy. Direct calculations of the total surface energy
 $A=A_{fibre}+A_{film}$
give (see (B 1) and (B 2)),
 $$\begin{eqnarray}\displaystyle A & = & \displaystyle \unicode[STIX]{x03C0}\unicode[STIX]{x1D6FE}\left(r_{c}\sqrt{r_{c}^{2}-r_{0}^{2}\cos ^{2}\unicode[STIX]{x1D703}}-r_{c}^{2}+\left(h-\frac{\ell }{2}\right)r_{0}\cos \unicode[STIX]{x1D703}-2hr_{0}\right.\nonumber\\ \displaystyle & & \displaystyle +\left.r_{0}^{2}(2-\cos \unicode[STIX]{x1D703})\ln \frac{1+\cos \unicode[STIX]{x1D703}}{\sin \unicode[STIX]{x1D703}}-r_{0}^{2}\sin \unicode[STIX]{x1D703}\right).\end{eqnarray}$$
Since
 $\unicode[STIX]{x1D703}\ll 1$
and
 $\exp (h/r_{0})\gg 1$
, we have
 $$\begin{eqnarray}\displaystyle \frac{\unicode[STIX]{x2202}A}{\unicode[STIX]{x2202}\unicode[STIX]{x1D703}} & {\approx} & \displaystyle \unicode[STIX]{x03C0}\unicode[STIX]{x1D6FE}r_{0}^{2}\left(\frac{h}{r_{0}}-1\right)\left(\cosh \left(\frac{2h}{r_{0}}\right)-\sinh \left(\frac{2h}{r_{0}}\right)-1\right)\unicode[STIX]{x1D703}+\unicode[STIX]{x03C0}\unicode[STIX]{x1D6FE}r_{0}^{2}\unicode[STIX]{x1D703}^{2}+\mathit{h.o.t.}\nonumber\\ \displaystyle & {\approx} & \displaystyle -\unicode[STIX]{x03C0}\unicode[STIX]{x1D6FE}r_{0}^{2}\left(\frac{h}{r_{0}}-1\right)\unicode[STIX]{x1D703}+\unicode[STIX]{x03C0}\unicode[STIX]{x1D6FE}r_{0}^{2}\unicode[STIX]{x1D703}^{2}+\mathit{h.o.t.}\end{eqnarray}$$
Appendix C. Approximation of energy dissipation functions
Dissipation function in the outer region (
 $r>r_{c}$
). Since the thickness
 $\ell$
of the soap film does not change much, we know, by volume conservation, that the total inward flux at any circular section is constant and is given by
 $$\begin{eqnarray}\tilde{a}=\frac{\text{d}V_{meni}}{\text{d}t},\end{eqnarray}$$
where
 $V_{meni}$
denotes the volume of the liquid under the meniscus. Direct computations give
 $$\begin{eqnarray}V_{meni}=2\unicode[STIX]{x03C0}\int _{r_{0}}^{r_{c}}H(r)r\,\text{d}r=\frac{\unicode[STIX]{x03C0}}{2}\left(r_{0}r_{c}\sqrt{r_{c}^{2}-r_{0}^{2}}-r_{0}^{2}h+\ell \left(r_{c}^{2}-\frac{r_{0}^{2}}{2}\right)\right)\approx \frac{\unicode[STIX]{x03C0}}{2}r_{0}r_{c}^{2}.\end{eqnarray}$$
This leads to
 $$\begin{eqnarray}\tilde{a}=\unicode[STIX]{x03C0}r_{0}r_{c}{\dot{r}}_{c}\approx \unicode[STIX]{x03C0}r_{c}^{2}{\dot{h}},\end{eqnarray}$$
where we have used (A 5). The velocity in the
 $r$
direction is a function of
 $r$
and is given by
 $$\begin{eqnarray}u_{r}=\frac{\tilde{a}}{\unicode[STIX]{x03C0}r\ell }.\end{eqnarray}$$
The energy dissipation function in this region is given by
 $$\begin{eqnarray}\displaystyle \unicode[STIX]{x1D6F7}_{out} & = & \displaystyle 2\unicode[STIX]{x03C0}\unicode[STIX]{x1D702}\int _{r_{c}}^{R_{\infty }}\left((\unicode[STIX]{x2202}_{r}u_{r})^{2}+\left(\frac{u_{r}}{r}\right)^{2}\right)\frac{\ell }{2}r\,\text{d}r\nonumber\\ \displaystyle & = & \displaystyle 2\unicode[STIX]{x03C0}\unicode[STIX]{x1D702}\int _{r_{c}}^{R_{\infty }}\frac{\tilde{a}^{2}}{\unicode[STIX]{x03C0}^{2}r^{3}\ell }\,\text{d}r=\frac{\tilde{a}^{2}}{\unicode[STIX]{x03C0}r_{c}^{2}\ell }\approx \frac{\unicode[STIX]{x03C0}r_{c}^{2}\unicode[STIX]{x1D702}}{\ell }{\dot{h}}^{2},\end{eqnarray}$$
where
 $R_{\infty }$
is the outer radius of the soap film, which is assumed to be much larger than
 $r_{c}$
.
Dissipation function in the middle region (
 $r_{1}<r\leqslant r_{c}$
). We assume that the fluid velocity has a radial component
 $u_{r}(r)$
only. By volume conservation, we have
 $$\begin{eqnarray}\frac{\unicode[STIX]{x2202}H}{\unicode[STIX]{x2202}t}=-\frac{1}{r}\frac{\unicode[STIX]{x2202}}{\unicode[STIX]{x2202}r}(rH(r)u_{r}).\end{eqnarray}$$
Noticing the boundary condition
 $$\begin{eqnarray}u_{r}(r_{c})=\frac{\tilde{a}}{\unicode[STIX]{x03C0}r\ell }.\end{eqnarray}$$
Direct calculations give
 $$\begin{eqnarray}u_{r}=\frac{1}{rH(r)}\left(\frac{\tilde{a}}{2\unicode[STIX]{x03C0}}+\int _{r}^{r_{c}}r\frac{\unicode[STIX]{x2202}H}{\unicode[STIX]{x2202}t}\,\text{d}r\right)=\frac{{\dot{h}}}{rH}\left(r_{c}^{2}-\frac{r^{2}}{2}\right).\end{eqnarray}$$
Here we have used (A 2) and (C 3). This leads to
 $$\begin{eqnarray}\unicode[STIX]{x2202}_{r}u_{r}=-\frac{{\dot{h}}}{r^{2}H(r)}\left(r_{c}^{2}+\frac{r^{2}}{2}\right)+\frac{{\dot{h}}}{rH(r)^{2}}\left(r_{c}^{2}-\frac{r^{2}}{2}\right)\frac{r_{0}}{r}.\end{eqnarray}$$
Here we have used (A 3). Near the boundary
 $r=r_{c}$
, the height of the meniscus is close to
 $\ell /2$
, so that the
 $H(r)^{-2}$
term dominates. In the leading order, we have
 $$\begin{eqnarray}\unicode[STIX]{x2202}_{r}u_{r}\approx \frac{{\dot{h}}}{rH(r)^{2}}\left(r_{c}^{2}-\frac{r^{2}}{2}\right)\frac{r_{0}}{r}.\end{eqnarray}$$
Then the energy dissipation function in the leading order is given by
 $$\begin{eqnarray}\unicode[STIX]{x1D6F7}_{mid}=2\unicode[STIX]{x03C0}\unicode[STIX]{x1D702}\int _{r_{1}}^{r_{c}}rH(r)\left((\unicode[STIX]{x2202}_{r}u_{r})^{2}+\left(\frac{u_{r}}{r}\right)^{2}\right)\text{d}r\approx 2\unicode[STIX]{x03C0}\unicode[STIX]{x1D702}r_{0}^{2}{\dot{h}}^{2}\int _{r_{1}}^{r_{c}}\frac{(r_{c}^{2}-r^{2}/2)^{2}}{r^{3}H(r)^{3}}\,\text{d}r.\end{eqnarray}$$
We set
 $z=H(r)$
, using the relation
 $r\approx r_{0}\cosh (h-z/r_{0})$
and
 $r_{c}\approx r_{0}\cosh ((h-\ell /2)/r_{0})$
, and change the variable of integration, and finally we obtain
 $$\begin{eqnarray}\displaystyle \unicode[STIX]{x1D6F7}_{mid} & = & \displaystyle 2\unicode[STIX]{x03C0}\unicode[STIX]{x1D702}r_{c}^{2}r_{0}{\dot{h}}^{2}\int _{\ell /2}^{h_{1}}\frac{(\cosh ^{2}((h-\ell /2)/r_{0})-\cosh ^{2}((h-z)/r_{0})/2)^{2}}{z^{3}\cosh ^{2}((h-z)/r_{0})\cosh ^{2}((h-\ell /2)/r_{0})}\,\text{d}z\nonumber\\ \displaystyle & {\approx} & \displaystyle \frac{\unicode[STIX]{x03C0}\unicode[STIX]{x1D702}r_{0}r_{c}^{2}}{\ell ^{2}}{\dot{h}}^{2}.\end{eqnarray}$$
Higher-order approximation of the dissipation function. From the analysis in the previous section, we have shown that the energy dissipation is dominated by that in the middle region. Here we compute the higher-order terms of the energy dissipation function in the middle region. As in (C 2), the total volume in the inner and middle regions is given by
 $$\begin{eqnarray}V_{meni}\approx \frac{\unicode[STIX]{x03C0}}{2}r_{0}r_{c}^{2}=\frac{\unicode[STIX]{x03C0}r_{0}^{3}}{2}\cosh ^{2}\left(\frac{h-\ell /2}{r_{0}\cos \unicode[STIX]{x1D703}}\right).\end{eqnarray}$$
Here we have used the relation
 $r_{c}=r_{0}\cosh ((h-\ell /2)/r_{0}\cos \unicode[STIX]{x1D703})$
. Direct computations give the flux
 $$\begin{eqnarray}\tilde{a}=\frac{\text{d}V_{meni}}{\text{d}t}\approx \unicode[STIX]{x03C0}r_{c}^{2}({\dot{h}}+\unicode[STIX]{x1D6FC}r_{0}\unicode[STIX]{x1D703}\dot{\unicode[STIX]{x1D703}}),\end{eqnarray}$$
with
 $\unicode[STIX]{x1D6FC}=h/r_{0}-\tanh (h/r_{0})$
. This equation differs from (C 1) only by a higher-order term of
 $\unicode[STIX]{x1D703}$
. Similar analysis as in the previous section leads to
 $$\begin{eqnarray}\unicode[STIX]{x1D6F7}_{mid}=\frac{\unicode[STIX]{x03C0}\unicode[STIX]{x1D702}r_{0}r_{c}^{2}}{\ell ^{2}}({\dot{h}}+\unicode[STIX]{x1D6FC}r_{0}\unicode[STIX]{x1D703}\dot{\unicode[STIX]{x1D703}})^{2}.\end{eqnarray}$$
This implies that the total energy dissipation function,
 $$\begin{eqnarray}\unicode[STIX]{x1D6F7}\approx \unicode[STIX]{x1D6F7}_{mid}=\frac{\unicode[STIX]{x03C0}\unicode[STIX]{x1D702}r_{0}r_{c}^{2}}{\ell ^{2}}({\dot{h}}+\unicode[STIX]{x1D6FC}r_{0}\unicode[STIX]{x1D703}\dot{\unicode[STIX]{x1D703}})^{2}.\end{eqnarray}$$