INTRODUCTION
Urban centres worldwide produce sewage effluents in excess of 100 × 106 l per day. Large amounts of domestic and industrial wastes are disposed of in the oceans (Koop & Hutchings, Reference Koop and Hutchings1996). The treatment and disposal of such large volumes of liquid waste pose great problems near large urban centres where land for this purpose is scarce. One solution which is being used today and which is gaining in popularity is the disposal of raw or partially treated sewage through ocean outfalls. The waste waters discharged from outfall diffusers affect the water quality of coastal waters worldwide (Bothner et al., Reference Bothner, Casso, Rendigs and Lamothe2002). There is considerable public and scientific concern regarding possible effects of effluents on downstream water.
The effect of these outfalls on the marine ecosystem is assumed to be small but remains unknown, even though the technology of sewage treatment has been studied carefully and is comparatively well understood (Novitsky & Karl, Reference Novitsky and Karl1985). Environmental effects of sewage discharges, however, have rarely been studied with respect to plankton assemblages as biomarkers, and not from tropical or subtropical sites.
Large amounts of domestic and industrial wastes have historically been discharged to the subtropical site of Kaohsiung harbour (Taiwan), and adjacent coastal waters. Kaohsiung is the largest harbour in Taiwan and an important harbour in Asia. Lee & Fang (Reference Lee and Fang1997) recorded congeners with high chlorine values in Kaohsiung coastal waters (Lee et al., Reference Lee, Song and Fang2000), and they further recorded the highest concentration of hexachlorobutadiene (HCBD) in the T-Y outfall area in comparison to other outfall areas along the Kaohsiung coast. Phenols, oil and grease were recorded at higher concentrations than the limit criteria according to EPA (1996). Waters above the T-Y outfall area near Kaoshiung (Yang, Reference Yang1995) and phytoplankton assemblages and primary production seemed to be affected at outfall areas in southern Taiwan (Wang et al., Reference Wang, Cheng, Wu, Hsu, Wang and Li1990). Particulate pollutants may settle down to the seabed, and subsequently change the biogeochemistry of sediments (Turner, Reference Turner1994; Lee et al., Reference Lee, Fang and Hsieh1998; Servais et al., Reference Servais, Garnier, Demarteau, Brion and Billen1999). Hence, higher levels of copper and zinc have been reported from surface sediments in the T-Y outfall area (Lee et al., Reference Lee, Fang and Hsieh1998).
Chemical parameters considered in pollution studies may not be sufficient for the evaluation of an environmental situation since they do not provide an integrated view. Therefore, the examination of biological components, such as the composition of planktonic assemblages may provide a better insight into the changes of plankton communities due to pollution. Copepods have been used as suitable biomarkers in the marine environment (Hwung et al., Reference Hwung, Wen, Chen, Fu, Wen and Hwung1990; Ritterhoff & Zauke, Reference Ritterhoff and Zauke1997; Barka et al., Reference Barka, Pavillon and Amiard2001) because of their wide geographical distribution, their trophic position, their rapid turnover, huge biomass, potential role as indicators of effective metal concentrations (Barka et al., Reference Barka, Pavillon and Amiard2001; Hook & Fisher, Reference Hook and Fisher2001a & Reference Hook and Fisherb, Reference Hook and Fisher2002), and their great capacity to accumulate trace metals (Wang & Fisher, Reference Wang and Fisher1998; Kahle & Zauke, Reference Kahle and Zauke2003). No study is as yet available that investigates the effect of a marine outfall area on copepod assemblages in coastal waters of southern Taiwan.
It has been shown that land-based effluents impact the abundance and composition of plankton assemblages in coastal areas (Bianchi et al., Reference Bianchi, Acri, Bernardi, Berton, Boldrin, Camatti, Cassin and Comaschi2003; Cornils et al., Reference Cornils, Schnack-Schiel, Hagen, Dowidar, Stambler, Plahn and Richter2005) to a variable extent, via urban runoff or industrial effluents (Naes & Oug, Reference Naes and Oug1997), traffic exhaust and spillage of fuel (Wang et al., Reference Wang, Cheng, Wu, Hsu, Wang and Li1990; Barbara & Nancy, Reference Barbara and Nancy2002). Such effects may also mask the predicted seasonal succession of copepod communities (Arashkevich et al., Reference Arashkevich, Wassmann, Pasternak and Riser2002). Copepods are major components of marine zooplankton and play a central role in the transfer of nutrients and energy through marine food webs. Copepod abundances and species assemblages are affected by several hydrochemical parameters and physical forces (Paffenhöfer & Flagg, 2002; Bianchi et al., Reference Bianchi, Acri, Bernardi, Berton, Boldrin, Camatti, Cassin and Comaschi2003; Waniek, Reference Waniek2003; Hwang et al., Reference Hwang, Tu, Tseng, Fang, Souissi, Fang, Lo, Twan, Hsaio, Wu, Peng, Wei and Chen2004, Reference Hwang, Souissi, Tseng, Seuront, Schmitt, Fang, Peng, Wu, Hsiao, Twan, Wei, Kumar, Fang, Chen and Wong2006; Hwang & Wong, Reference Hwang and Wong2005). Planktonic copepods, in view of their short life cycle and dependence on movements of water masses, serve as appropriate models for the study of community structures and their temporal dynamics in pelagic systems (Paffenhöfer & Flagg, 2002). Information about the mesozooplankton and particularly about planktonic copepod abundance and distribution might provide background information for future monitoring, and will be useful for pollution control measures. Copepods may serve as indicator species of polluted areas, as some species are to be expected that adapt to different pollutants in different relative concentrations.
In the present study we investigate the spatial and temporal distribution of copepod abundances in the upper water column of the T-Y outfall area north-east of Kaohsiung harbour in the boundary waters of the north-eastern South China Sea and the Taiwan Strait. We take this subtropical site as an example to view changes before and after the outfall became operational.
MATERIALS AND METHODS
Study area
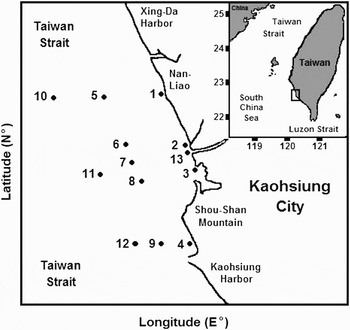
The T-Y outfall system is located in the boundary waters of the north-eastern South China Sea and the Taiwan Strait to the north of Kaohsiung city, off the estuarine water masses of the Dien-Pao River (Figure 1). It discharges industrial waste waters from two industrial parks, from a large petroleum refining plant and a petrochemical plant. Hydrodynamic, chemical and biological variables in the, Taiwan outfall area are extremely complex due to interacting effects of pollution, intensity of tidal inflow and outflow, and the current regime (Yang, Reference Yang1995; Yang et al., Reference Yang, Chang and Lo Huang2000; Liang et al., Reference Liang, Tang, Yang, Ko and Chuang2003). Average depth of the area is <30 m, whereas the depth of the diffuser pipe from the seawater surface is 19.5 m. We selected thirteen sampling stations (Figure 1) above the outfall area off the T-Y naval harbour between 22°37′51′′–25°45′49′′N and 120°9′5′′–121°14′52′′E.
Study area showing the location of sampling stations in the north-eastern South China Sea.

Field sampling and copepod analyses
Cruises were conducted in March, June, and September 2002, using a fishing vessel. Stations were numbered according to the sampling sequences in which the first sampling station (Station 1) was located at the Nan Liao coast and the last sampling station (Station 13) was located at the mouth of the Dien-Pao estuary. In all three cruises the sampling campaign was started and finished at the same time during daylight hours, and it was designed in such a way that a particular station could be sampled at the same time of the day. Invariably, all 13 stations were covered during each sampling cruise.
Various water parameters, for example temperature, dissolved oxygen (DO) and pH were measured on board, using a portable CTD instrument prior to zooplankton sampling. At each station the depth strata of CTD records were 5 m to the surface, which were also the depth strata of the horizontal tows for zooplankton sampling. Water samples were collected in metal-free Van Dorn bottles and stored at 4°C and then brought back to the laboratory for the analysis of biological oxygen demand (BOD5), lipids, mineral oils (Bligh & Dyer, Reference Bligh and Dyer1959), heavy metals (Pb, Cu) (Gonzalez et al., Reference Gonzalez, Pomares, Ramirez and Torres1999), and cyanide (CN) (Hung, Reference Hung1986; Pai & Yang, Reference Pai and Yang1990a, Reference Pai and Yangb). Standard procedures as provided in standard methods for water sampling and the examination of water quality (APHA, 1995; EPA, 1996) provided further analyses. Dissolved trace metals were extracted using the APDC-DDDC/Freon (ammonium pyrrolidine dithiocarbamate/diethyl diammonium dithiocarbamate) technique. Our chemical data were adapted from the Industry Development Bureau, Ministry of Economical Affairs, Taiwan (2002).
Zooplankton samples were taken with a zooplankton net of 45-cm mouth diameter and 333 µm mesh size. A flow meter (Hydrobios) was mounted at the centre of the mouth opening. The net was towed at the surface (2–5 m depth) for approximately 10 minutes at a vessel speed of 2 knots. Samples were preserved in 5% buffered seawater–formaldehyde immediately on board. In the laboratory, samples were split by a Folsom splitter until the subsample contained ≤500 specimens. Copepods were sorted and identified to species level using identification keys of Chen & Zhang (Reference Chen and Zhang1965), Chen et al. (Reference Chen, Zhang and Zhu1974, Reference Chen, Huang, Yin, Zhang and Tseng1996), Huys & Boxshall (Reference Huys and Boxshall1991), and Chihara & Murano (Reference Chihara and Murano1997). Original revised references were consulted when required.
Statistical analyses
Spatial and temporal variations in copepod assemblages were analysed using two factor analysis of variance without replication with stations and seasons as major factors. In order to reduce higher heteroscedaticity observed in the original species abundance data for copepods, a transformation power (λ = 0.983) was generated by regression coefficients that were estimated by maximizing the log likelihood function (Box & Cox, Reference Box and Cox1964). Accordingly, data were log (X + 1) transformed for statistical analyses. A Pearson's product moment correlation was used in order to estimate the correlation between copepod abundance with selected physicochemical properties of water.
A matrix of abundances, samples (39), and species (67) was computed using Bray–Curtis similarity coefficient NMDS ordination in order to obtain similarity coefficients between samples. Bray–Curtis distance measures were employed for the estimation of similarities of copepod community compositions among sampling cruises. NMDS is considered as one of the most robust ordination methods when dealing with zero–zero species density pairs (Gray et al., Reference Gray, Ashcan, Carr, Clarke, Paterson, Rosenberg and Warwick1988). The final stress (a measure of the goodness of fit between the data and the final ordination) was examined in relation to dimensionality to choose the least dimensions necessary to adequately describe the data. For each cruise, a non-metric cluster analysis was used in conjunction with the Bray–Curtis similarity index of copepod species x stations data. Similarity programs ANOSIM and SIMPER of the Plymouth Routine In Multivariate Ecological Research (PRIMER, version IV; Clarke & Gorley, Reference Clarke and Gorley1997) software package were used for cluster analyses. The identification of indicator species was done by using the IndVal method (Dufrêne & Legendre, Reference Dufrêne and Legendre1997). This index is obtained by multiplying 100 to the product of two independently computed values:

where (SPj, s) is the specificity and (FIj, s) is the fidelity of a species (s) toward a group of samples (j), and are given by:

where NI(j, s) is the mean abundance of species s across the samples pertaining to j, ΣNI(s) is the sum of the mean abundance of species s within the various groups in the partition, NS(j, s) is the number of samples in j where species s is present, and ΣNS(s) is the total number of samples in that group. The specificity of a species for a group is highest if a particular species is found only in a particular group, whereas the fidelity of a species to a group is highest if the species is present in all samples of the group considered. In order to evaluate copepod assemblages for the whole sampling period, the analysis of indicator species was applied to each sampling cruise separately. The Shannon–Wiener diversity index was used to estimate the species diversity, and Pielou's evenness was used to measure the relative abundance of species during each season.
RESULTS
Hydrographic parameters
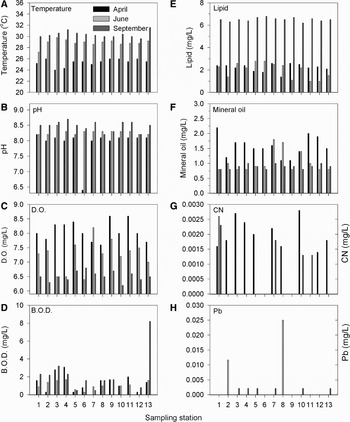
Water temperature recorded above the T-Y outfall area during three cruises averaged 28.2°C and ranged from 25.4°C in March, to 30.4°C in September 2002 (Figure 2A). In all three sampling cruises the seawater was alkaline with a minimum pH value of 7.9 in March and a maximum in September of 8.5 (Figure 2B). The differences in the values recorded for temperature, pH, dissolved oxygen (DO), total lipid and mineral oil were significant (one-way ANOVA, P < 0.01; Figure 2A–D) among seasons but not among sampling stations. The BOD values recorded in different cruises ranged from 0.45 to 4.2 mg l−1, but did not differ significantly between seasons. Significant seasonal variations were recorded for DO, lipid, and mineral oil in each case with the highest value in March and the lowest in September (Figure 2A–F). The presence of cyanide in the water column was detected in all three cruises, ranging from 1.4 to 2.8 µg l−1 (Figure 2G), whereas a detectable amount of lead was recorded only in June and September samples ranging from 2.1 to 25 µg l−1 (Figure 2H). The overall average of BOD values, lipid and mineral oil concentrations in the water-column showed significant spatial variation. The BOD values recorded at Stations 5, 7, 10 and 12 (nearshore stations) were significantly less than at the coastal Stations 3, 4 and 13 (onshore stations) (Fisher's PLSD tests, P < 0.05; Figure 2D). In September, Station 13, near the mouth of the Dien-Pao estuary, recorded extremely higher BOD values (8.2 mg l−1).
Seasonal variations in water quality parameters: temperature (A); pH (B); DO (C); BOD (D); lipid (E); mineral oil (F); CN (G); Pb (H) concentration in surface waters over the Tso-Ying marine outfall area in the north-eastern South China Sea during March, June and September 2002.

Copepod abundance and species composition
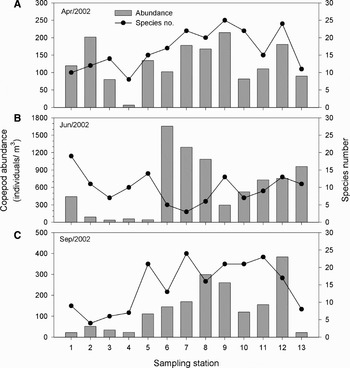
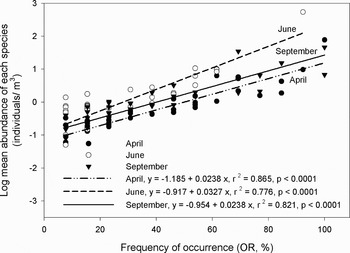
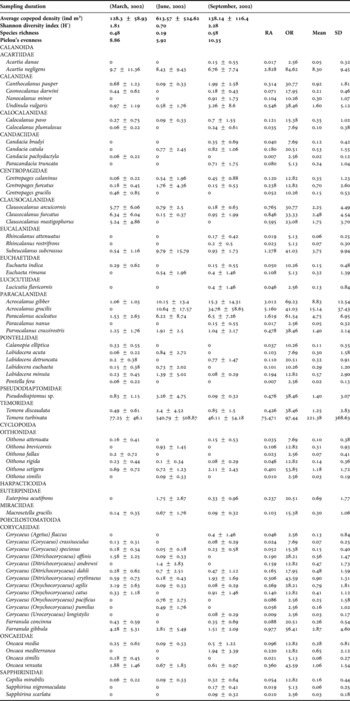
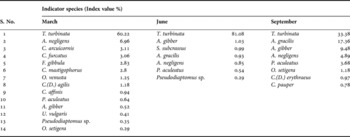
From 39 samples, we identified 66 copepod species belonging to 31 genera and 19 families: 37 species of Calanoida, 6 species of Cyclopoida, 2 species of Harpacticoida, and 21 species of Poecilostomatoida (Table 1). Mean copepod abundance from all stations ranged from a minimum of 9.4 (individuals m−3) in March at Station 4 to a maximum of 1685 (individuals m−3) in June at Station 6. Calanoids were the most dominant group representing 95.7% of the total copepod abundance, followed by the Poecilostomatoida, representing a 3.3% fraction of the total copepod abundance (Table 1). Cyclopoids were frequently found during all three cruises, but were mainly represented by oithonid copepods with <1% of the total copepod abundance. Pelagic harpacticoids were rarely found in the samples and represented about 2% of the total copepod abundance. The total copepod abundance was significantly higher in the June samples (P = 0.001, one-way ANOVA, Figure 3), whereas the March and September samples did not differ significantly. Significant seasonal variation in total copepod abundance was mainly due to the Calanoida (one-way ANOVA, P = 0.034,) and pelagic Harpacticoida (one-way ANOVA, P = 0.043), as the cyclopoid and poecilostomatoid abundance did not differ significantly among seasons. Integrating all three sampling cruises, copepods were dominated by Temora turbinata which occurred in >97% samples with a relative abundance of 75.5% and was followed by Acrocalanus gracilis and A. gibber with a relative abundance of 5.2% and 3.0% respectively. The most abundant species were found more frequently in all the cruises (Figure 4). Species that occurred in all three cruises and could be found in >60% of the samples included Temora turbinata, Acartia negligens, Acrocalanus gibber and Paracalanus aculeatus (Table 1). Other species showed a more seasonal occurrence. The most indicative species in all three cruises was Temora turbinata with the highest indicator value in June (81.08%) and the lowest in September (33.38%). Other species showed a less than 20% index value.
The total copepod abundance and number of species recorded at 13 stations over the Tso-Ying marine outfall area in the north-eastern South China Sea during March, June and September 2002.

Relationship between log mean abundance and frequency of occurrence (%) of 66 copepod species recorded over the Tso-Ying marine outfall area in the north-eastern margin of the South China Sea.

Copepod species, average density (individuals m−3), relative abundance (RA, %), frequency of occurrence (OR, %), Shannon–Wiener diversity index (H′) and Pielou's evenness (J′) recorded during March, June and September 2002 over the Tso-Ying marine outfall area in the boundary waters between the north-eastern South China Sea and the Taiwan Strait.

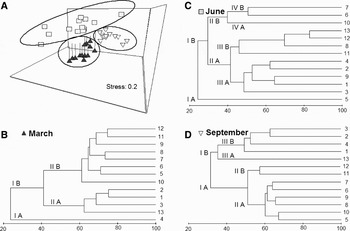
The ordination diagram derived from non-metric multidimensional scaling (stress 0.2) separates samples with season (Figure 5A), which further reveals a differential clustering pattern of copepod abundance in relation to stations sampled during different cruises. In the March samples, copepod assemblages collected from Station 4 clustered separately (Figure 5B). The copepod abundance recorded at Station 4 (Group IA) in March was significantly lower than at other stations (one-way ANOVA followed by Tukey's honestly significant difference test P < 0.01; Figure 5B). The top four copepod species recorded at Station 4 were Temora turbinata (40.7%), Acartia negligens (28.2%), Pseudodiaptomus sp. (14.1%) and Parvocalanus crassirostris (9.3%).
Non-metric multidimensional scaling of copepod data from 39 samples collected at 13 stations during March, June and September 2002 (A); and clustering dendrogram for copepod samples collected during March (B), June (C) and September (D). The end of the line on the right side of the dendrogram represents one sampling station. The dendrogram is scaled by the percentage of remaining information.

At a second level, onshore Stations 1, 2, 3 and 13 (Group IIA) are separated from offshore stations (Group IIB). Stations included in Cluster IIA showed a lower abundance, but did not differ significantly in total copepod abundances recorded at the stations of Cluster IIB (Figure 5B). However, both groups differed in the composition of the top five most abundant copepod species. Group IIA stations were dominated by Temora turbinata (66.02%), Acartia negligens (18.8%), Paracalanus aculeatus (3.1%), and Parvocalanus crassirostris (2.8%), whereas Group IIB stations were represented by T. turbinata (57.9%), Clausocalanus furcatus (7.1%), C. arcuicornis (6.3%), and C. mastigophorus (5.8%).
In June, Station 5 (Cluster IA) that separated from other stations at the first hierarchical level was represented by Acrocalanus gracilis (16.2%), Euterpina acutifrons (13.5%), Farranula gibbula (13.5%) and Paracalanus aculeatus (10.8%). This station showed lower copepod abundance but a relatively higher diversity (Figure 5C). All remaining stations comprising Cluster IB, recorded Temora turbinata as the most abundant species. These stations varied, however, in the composition and relative abundance of the top five dominant copepod species. September samples of the coastal stations (1, 2, 3, 4 and 13) were separated (Cluster IB) from offshore stations at the first hierarchical level. Stations included in Cluster IA at the first hierarchical level showed significantly higher copepod abundance than stations of Cluster IB (Figure 5D). Within Cluster IB, Station 13 situated near the mouth of the Dien-Pao estuary was separated from other stations at the second hierarchical level. Station 13 did not differ in total copepod abundance from the remaining stations of Cluster IB. It showed, however, a different composition of copepod species (Table 2) and was dominated by Parvocalanus crassirostris (27.3%), Temora turbinata (18.2%) and Acartia negligens (9.1%). Stations included in Cluster IB were dominated by Acartia negligens (31.4%), Acrocalanus gibber (26.1%) and Temora turbinata (19.2%).
Indicator Value for copepod species occurring in more than 50% samples in each season over the Tso-Ying marine outfall area in the boundary waters between the northeastern South China Sea and the Taiwan Strait.

Considering onshore (Stations 1, 2, 3, 4 and 13), nearshore (Stations 5, 6, 7, 8 and 9), and offshore stations (Stations 10, 11 and 12), the total copepod abundance did not show significant differences, however, the abundance of the Poecilostomatoida was significantly higher in samples collected at offshore stations (one-way ANOVA, P = 0.003). The average number of copepod species captured at offshore stations was significantly higher than that at onshore stations, which mainly consisted of Calanoida (P = 0.003) and Poecilostomatoida (P = 0.027). Detailed species analyses showed the following trends: (i) Parvocalanus crassirostris showed a consistently higher abundance at onshore stations (one-way ANOVA, P = 0.009) than at offshore stations; (ii) five calanoid species (Canthocalanus pauper, Nanocalanus minor, Undinula vulgaris, Clausocalanus arcuicornis and Clausocalanus furcatus) had significantly higher abundances at offshore stations than those at onshore stations; (iii) three calanoid species (Euchaeta rimana, Paracandacia truncata and Cosmocalanus darwini) were never found in samples collected at stations near the coast (Stations 1, 2, 3, 4 and 13); and (iv) two Poecilostomatoida (namely, Farranula gibbula and Oncaea venusta) showed a higher abundance at offshore stations (P = <0.029, one-way ANOVA).
Copepod species associations
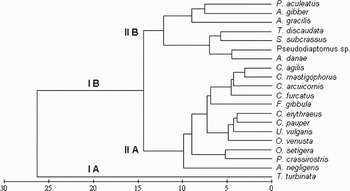
The species association of the twenty most abundant species was evaluated by normalized Euclidean distances. Species with similar distribution patterns form clusters that show the extent of co-occurrence of copepod species (Figure 6). The most indicative species, T. turbinata does not cluster with any other species and does not show any significant correlation with physical parameters. The second most abundant group of species, Paracalanus aculeatus and Acrocalanus gibber, form a cluster and both species correlate negatively (P < 0.03) with the amount of lipid and mineral oil recorded in the water column. The second most abundant species A. gracilis joins the cluster and correlates negatively with dissolved oxygen.
Dendrogram of the twenty most abundant copepod species measured by Euclidean distances, showing the degree of relative dissimilarity of distribution between species in the upper water column over the Tso-Ying outfall area, at the north-eastern margin of the South China Sea (for species abbreviations see Table 1).

DISCUSSION
The results of the present study indicate that the copepod communities in the north-eastern South China Sea facing the south-western coast of Taiwan are spatially heterogeneous at multiple scales. Many of the copepod species identified in samples from this area are widely distributed in the surface waters of the South China Sea and the Taiwan Strait, but a combination of their relative abundance and their frequency of occurrence indicate that the community composition over the T-Y outfall area is consistently dominated by local species with a lesser degree of seasonal variation.
The persistence of local species is commonly not attributed to plankton assemblages that are believed to be translocated by water movements frequently. This is the reason why benthic assemblages have mostly been used for the environmental monitoring of outfall effects globally. We provide here the first example where plankton assemblages indicate useful information about environmental changes in the course of sewage disposal at a stable outlet site.
The role of copepods as indicators of various abiotic factor changes, such as salinity and temperature that may indicate intrusions of water masses has well been established in waters worldwide (Paffenhöfer & Flagg, Reference Paffenhöfer and Flagg2002; Peterson & Keister, Reference Peterson and Keister2003; Hsieh et al., Reference Hsieh, Chiu and Shih2004). In our study, the most dominant species for all three cruises is T. turbinata. This species dominated during all three cruises at Stations 6, 7, 8 and 9, that are situated near the outlet of the outfall pipe. Correlations of T. turbinata with hydrographic parameters recorded in our study further support this view. Temora turbinata dominates the northern waters of Taiwan, mainly in the estuarine area of the Danshuei River (Wong et al., Reference Wong, Hwang and Chen1998; Hwang et al., Reference Hwang, Souissi, Tseng, Seuront, Schmitt, Fang, Peng, Wu, Hsiao, Twan, Wei, Kumar, Fang, Chen and Wong2006) during summer. Dominance of T. turbinata has also been recorded above outfall areas off the northern coast of Taiwan (Fang et al., Reference Fang, Hwang, Hsiao and Chen2006; Hwang et al., Reference Hwang, Souissi, Tseng, Seuront, Schmitt, Fang, Peng, Wu, Hsiao, Twan, Wei, Kumar, Fang, Chen and Wong2006).
Species composition and dominance patterns of the copepods recorded in this study are similar to those in a previous study from Kaohsiung harbour (Chang & Fang, Reference Chang and Fang2004). These authors listed Temora turbinata as the most dominant copepod species. Its relative abundance was 18.5%, and therefore lower than in our study where it occurred in >97% samples, with an average relative abundance of 75.5%. The numerically most abundant species was Temora turbinata with a maximum density of 1601.81 individuals m−3 at Station 6 during June. During the same cruise T. turbinata was absent at Station 5. The highly indicative species T. turbinata is more adapted to coastal waters around the outfall area. The present study, recorded high densities of T. turbinata (963 to 1601 individuals m−3) especially from the June samples collected at Stations 6, 7 and 8. These stations are located above the outlet point of the outfall system and did not show noticeable amounts of other copepod taxa during this period. We are not sure whether the exceptional higher density of T. turbinata during June at Stations 6, 7 and 8 (963–1601 individuals m−3) can be attributed to swarming. Copepod swarms refer to dense aggregations in the order of 100–1000 animals m−3 (Emery, Reference Emery1968; Tranter & George, Reference Trante, George, Mukandan and Pillai1972; Hamner & Carleton, Reference Hamner and Carleton1979) and have been found in the area (Hwang, unpublished). Other studies from coastal waters in the south-west of Taiwan did not confirm Temora turbinata as a dominant copepod species (Lo et al., 2004a,b). Samples from stations closer to the outlet of the outfall pipe show a consistent dominance of Temora turbinata. In order to make a comparison between an ocean outfall area in northern Taiwan and the background stations, three species of dominant copepods there (Temora turbinata, Oncaea venusta and Euchaeta rimana) were analysed for trace metals by Fang et al. (Reference Fang, Hwang, Hsiao and Chen2006). The concentrations of trace metals in copepods collected at the outfall stations in the study by Fang et al. (Reference Fang, Hwang, Hsiao and Chen2006) were higher than those obtained at background stations. Temora turbinata accounted for 67–91% and 46% of the total number of copepods at the outfall and background stations in the north, respectively.
It is possible that T. turbinata has adapted to the environment near the outfall outlet, which may provide a bottleneck to other zooplankton species which are less able to tolerate the pollution levels. A study by Lo et al. (2004b) from unpolluted waters of the Taiwan Strait claimed Acrocalanus gracilis, Undinula vulgaris, Oncaea venusta and Farranula gibulla to be most abundant.
Compared with other oceanic and coastal ecosystems, the waters of the present study area are characterized by a shallow mixed layer, being less than 50 m in depth (Chen, Reference Chen1992; Michaels & Knapp, Reference Michaels and Knapp1996; Shaw et al., Reference Shaw, Chao, Liu, Pai and Liu1996). The study area is further affected by strong internal waves (Liu et al., Reference Liu, Chang, Hsu and Liang1998; Liang et al., Reference Liang, Tang, Yang, Ko and Chuang2003). The coastal current in this region follows mostly south-eastwards at a velocity ranging from 30–40 cm/sec, while the mean tidal range is 47 cm (Yang, Reference Yang1995). The planktonic communities here are mainly affected by alternating south-west (from May to early September) and north-east (from October to February) monsoons (Chen et al., Reference Chen, Zhang, Yin, Chen, Li, Zou and Chen1991; Chen, Reference Chen1992; Shaw et al., Reference Shaw, Chao, Liu, Pai and Liu1996; Liang et al., Reference Liang, Tang, Yang, Ko and Chuang2003), and freshwater discharged by the Dien-Pao river. The copepod data derived from the present study can be compared with previous studies conducted in northern, eastern and other parts of the South China Sea and the southernmost Taiwan Strait (Lo & Hwang, Reference Lo and Hwang2000). This area does not show significant temporal variation as far as copepod data are concerned compared to other parts of the South China Sea and the Taiwan Strait (Lo et al., 2004a,b; Hwang et al., Reference Hwang, Souissi, Tseng, Seuront, Schmitt, Fang, Peng, Wu, Hsiao, Twan, Wei, Kumar, Fang, Chen and Wong2006). In a recent study, Hwang et al. (Reference Hwang, Souissi, Tseng, Seuront, Schmitt, Fang, Peng, Wu, Hsiao, Twan, Wei, Kumar, Fang, Chen and Wong2006) investigated the copepod distribution at the boundary of the East China Sea and the Taiwan Strait and they clearly demonstrated seasonal variations in zooplankton abundance and composition in relation to monsoonal winds. Seasonal patterns of copepod abundance with low values in winter and higher values in summer are similar to results of several previous studies in coastal waters (Chen, Reference Chen1992; Chen et al., Reference Chen, Shiah, Chung and Liu2006; Hwang et al., Reference Hwang, Souissi, Tseng, Seuront, Schmitt, Fang, Peng, Wu, Hsiao, Twan, Wei, Kumar, Fang, Chen and Wong2006) around Taiwan and elsewhere (Mackas, Reference Mackas1992).
The concentrations of trace metals in copepods varied with species. The concentrations of Fe, Mn, Pb, and Cu in Temora turbinata, especially among female individuals, were evidently higher than those of other species at outfall stations (Fang et al., Reference Fang, Hwang, Hsiao and Chen2006).
In the present study, except Temora turbinata and Acrocalanus gracilis, the relative abundance of other species was <5%. This indicates that other copepod species in the surface waters above the outfall area are rare. The three dominant species T. turbinata, Acrocalanus gracilis and A. gibber which comprised >80% of the total copepod abundance are warm water species (Chen, Reference Chen1992), and are common in coastal waters of the China Seas.
The dominance of tropical species such as Undinula vulgaris, Canthocalanus pauper and Acrocalanus gibber, during summer and their presence throughout the year indicate intrusions of Kuroshio Branch Current waters in the region (Hsieh et al., Reference Hsieh, Chiu and Shih2004). The average chlorophyll-a concentration and primary production in the T-Y outfall area are 3.2 mg for chlorophyll-a × m−3 and 18 mg for carbon × m−3 × hr−1, respectively (Wang et al., Reference Wang, Cheng, Wu, Hsu, Wang and Li1990). Before the operation of the outfall, the dissolved oxygen and BOD levels varied from 6.1 to 7.9 mgl−1 and 0.5 to 2.1 mgl−1 respectively, whereas these varied from 6.2 to 8.6 mgl−1 and 0.4 to 8.6 mgl−1 respectively after the operation (Wang et al., Reference Wang, Cheng, Wu, Hsu, Wang and Li1990). The total current flows south-eastward before the inception of the outfall with velocities ranging between 30–40 cm sec−1 (1 m sec−1 measured for spring tides) (Hwung et al., Reference Hwung, Wen, Chen, Fu, Wen and Hwung1990). The outfall area became stratified after the waste waters were discharged into it through the marine outfall systems due to a change of temperature, salinity and density of seawater (Hwung et al., Reference Hwung, Wen, Chen, Fu, Wen and Hwung1990). Compared to data obtained before the operation of this marine outfall system, chlorophyll-a as well as primary productivity increased when the outfall area became operational. Thereafter, the level of nutrients in ocean waters decreased with distance from the wastewater effluent source (Hwung et al., Reference Hwung, Wen, Chen, Fu, Wen and Hwung1990). Similarly, in the present study absolute and relative abundance of T. turbinata decreased with distance from the outlet point of the outfall pipe. Temora turbinata dominated throughout the year above the outfall area with >70% of the total copepod abundance at any given time.
Our results show a relatively high abundance (75.47%) and occurrence rate (97.44) (Table 1) of T. turbinata indicating that this species is a dominant species in coastal areas of Taiwan. This species also provides a high proportion in polluted areas around an outfall discharge pipe. This indicates that T. turbinata may bear a high pollution impact and can adapt to environments with complex chemistry.
Temora turbinata is distributed from the Yellow Sea and Bohai Sea in the north to the East China Sea and South China Sea (Shih & Young, Reference Shih and Young1995). It is an important and common copepod species in the waters of Taiwan. Shih et al. (Reference Shih, Hwang and Huang2000) and Lo et al. (Reference Lo, Shih and Hwang2004c) recorded this species from an upwelling area in the north of Taiwan. In the northern Taiwan Strait, Shih & Chiu (Reference Shih and Chiu1998) found T. turbinata at all sampling stations from the coast of China to northern Taiwan and down to the area of the Kuroshio Current. Hwang et al. (Reference Hwang, Chen and Wong1998) found T. turbinata as a common species in coastal waters of northern Taiwan. It was shown that T. turbinata can be used as an indicator species for warm water situations and intrusions (Hwang et al., Reference Hwang, Souissi, Tseng, Seuront, Schmitt, Fang, Peng, Wu, Hsiao, Twan, Wei, Kumar, Fang, Chen and Wong2006, Dur et al., Reference Dur, Hwang, Souissi, Tseng, Wu, Hsiao and Chen2007).
In northern Taiwan in the coastal region of a nuclear power plant, Wong et al. (Reference Wong, Hwang and Chen1998) identified T. turbinata at all their sampling stations in August 1996. A subsequent study focuses on the composition of copepod communities from November 2000 to December 2003 (Hwang et al., Reference Hwang, Tu, Tseng, Fang, Souissi, Fang, Lo, Twan, Hsaio, Wu, Peng, Wei and Chen2004). Temora turbinata was a common and the most dominant species during all sampling seasons. Its seasonal abundance was: 59% in spring, 77% in summer, 32% in autumn and 21% in winter (Hwang et al., Reference Hwang, Tu, Tseng, Fang, Souissi, Fang, Lo, Twan, Hsaio, Wu, Peng, Wei and Chen2004). Two relevant studies were carried out in the Danshuei River area in the north of Taiwan. Hsieh & Chiu (Reference Hsieh and Chiu1997) identified T. turbinata in all year samples from August 1996 to January 1997. From this area Hwang et al. (Reference Hwang, Souissi, Tseng, Seuront, Schmitt, Fang, Peng, Wu, Hsiao, Twan, Wei, Kumar, Fang, Chen and Wong2006) confirm T. turbinata as well, as occurring throughout the year, with higher abundances in consecutive summers during a 5 year study from October 1998 to September 2003 in estuarine areas. Temora turbinata can also be identified along the coast of the north-eastern Taiwan Strait in most samples year round (Tseng et al., in press). In the south-eastern Taiwan Strait, Lo et al. (Reference Lo, Hwang and Chen2004b) found this species at a high occurrence rate (57.14%) and with a relative abundance of 18.2% during a cruise in June 1998 around Penghu Island. Chang & Fang (Reference Chang and Fang2004) studied the composition of copepods at Kaohsiung harbour where T. turbinata is the dominant species (18.5%) in the harbour area, especially at two outer harbour stations. In the south-west of Taiwan, Lo et al. (Reference Lo, Chung and Shih2004a) studying the mesozooplankton composition of Tapong Bay, found T. turbinata at an occurrence rate of (17.4%) and a relative abundance of 0.51%. These studies show that T. turbinata is a common and important species in the waters surrounding Taiwan.
The pairwise similarity based on presence–absence data (cluster) varied more than expected from the assumption that each taxon occurred independently. The interdependence could be attributed to predator avoidance or common food preferences. A significant association between copepod species in our study could mainly be attributed to their affinity to temperature, BOD, DO, and monsoon driven movements of water masses in the region. There is little information otherwise about the ecology of taxa occurring in association in the study area and/or polluted waters. Mechanisms causing spatial heterogeneity are almost unknown as yet. Questions raised by the present results suggest the need for several future studies on the interactions between pollutants, nutrients, phytoplankton and zooplankton.
ACKNOWLEDGEMENTS
The authors acknowledge financial support from a South China Sea project of the National Science Council, Taiwan, NSC (Grant NSC 94-2621-B-019-001) and the Center for Marine Bioscience and Biotechnology of the National Taiwan Ocean University. This work is a contribution to the bilateral cooperation programme between NSC (Taiwan)–CNRS (France)(Grant NSC 95-2621-B-019-002). We thank the AND College, University of Delhi for granting leave to Ram Kumar and technicians and graduate students from J.S. Hwang's laboratory for assistance during field samplings.