


Introduction
Acute kidney injury is a frequent and serious complication after congenital cardiac surgery in neonates and infants, with reported incidences of 25–45% and a clear association with prolonged mechanical ventilation, intensive care stay, and mortality. Reference Blinder, Goldstein and Lee1–Reference Alghamdi, Bin Mahfooz and Almutairi3 The early postoperative period represents a critical window of haemodynamic instability and renal vulnerability. Conventional biomarkers such as rising serum creatinine and declining urine output typically change only after significant renal injury, limiting their value for early detection. Reference Zappitelli, Parikh and Akcan-Arikan4 Because sicker infants may require higher inotropic support and may simultaneously exhibit worse renal function—or conversely, impaired renal function may contribute to greater haemodynamic compromise—the interaction between cardiovascular support and renal perfusion is clinically important. This makes early physiologic risk stratification particularly important in infants, who are highly susceptible to postoperative renal perfusion disturbances. Bedside renal Doppler ultrasonography provides a radiation-free assessment of intrarenal perfusion. The renal resistive index, derived from intrarenal arterial waveforms, reflects vascular resistance and has been proposed as an early indicator of acute kidney injury. Reference Platt, Rubin and Ellis5 Elevated renal resistive index has been associated with acute kidney injury in adult and paediatric critical-care populations; Reference Schnell, Darmon and Duranteau6–Reference Alabbas, Mohammed and Abdullah9 however, data in infants after cardiac surgery remain limited. Reference Ricci, Pezzella and Romagnoli10,Reference Naik, Basu and Kothari11 Prior paediatric studies often include broader age groups and variable postoperative timing, underscoring the need for infant-specific data obtained at a consistent, early postoperative time point. This prospective infant-only (<12 months) cohort study evaluated whether a single renal resistive index measured six hours after congenital cardiac surgery predicts subsequent Kidney Disease: Improving Global Outcomes-defined acute kidney injury within the first 48 postoperative hours and examined its relationship with inotropic requirements and the subsequent need for peritoneal dialysis, thereby refining prior paediatric cardiac surgery data on early renal resistive index assessment. We hypothesised that higher six-hour renal resistive index values would be associated with acute kidney injury and that early renal resistive index elevation would parallel postoperative circulatory stress.
Materials and methods
Study design and population
After Institutional Review Board approval (NRC21R/498/10), a prospective cohort study was conducted in the Paediatric Cardiac Intensive Care Unit (PCICU) at King Abdulaziz Medical City, Riyadh, Saudi Arabia. A waiver of informed consent was granted because all renal Doppler studies were obtained as part of routine postoperative care, and families were notified and expressed no objection. Consecutive neonates and infants (<12 months) undergoing congenital cardiac surgery with cardiopulmonary bypass between January and June 2023 were enrolled. Patients with pre-existing acute kidney injury, renal replacement therapy, structural renal anomalies, incomplete postoperative Doppler studies, or significant reversed diastolic renal flow due to systemic diastolic runoff were excluded. Infants who met Kidney Disease: Improving Global Outcomes criteria for acute kidney injury upon ICU arrival—based on an immediate postoperative creatinine elevation—were excluded to ensure that the six-hour renal resistive index always preceded acute kidney injury determination. Acute kidney injury was defined according to the Kidney Disease: Improving Global Outcomes criteria, 12 where Stage 1 denotes a mild increase in creatinine (1.5–1.9 times baseline) or urine output < 0.5 mL/kg/hr for ≥6 hr, Stage 2 denotes a moderate rise (2.0–2.9 times baseline) or urine output < 0.5 mL/kg/hr for ≥12 hr, and Stage 3 denotes a severe increase (≥3 times baseline) or urine output < 0.3 mL/kg/hr for ≥24 hr, or the need for dialysis. For analytic purposes in this study, moderate-to-severe acute kidney injury was defined as Kidney Disease: Improving Global Outcomes Stage 2–3. A surgically placed passive peritoneal drainage catheter did not constitute renal replacement therapy unless dialysate was infused, and Kidney Disease: Improving Global Outcomes urine-output criteria were applied normally. The neonatal-modified Kidney Disease: Improving Global Outcomes definition was not used. Surgical complexity was categorised using the STAT mortality categories, a validated risk stratification system for congenital heart surgery. Reference Jacobs, O’Brien and Pasquali13
Ultrasound technique
Bedside renal Doppler ultrasonography was performed using a high-frequency linear (6–12 MHz) or micro-convex probe, depending on patient size and kidney depth (Figure 1). The probe was positioned over the lower intercostal space along the posterior or mid-axillary line to obtain longitudinal renal views, with the marker directed cranially. Interlobar arteries located between the medullary pyramids (grey–white junction) were sampled from the upper, mid, and lower renal poles during quiet breathing, maintaining an insonation angle ≤ 60. Reference Platt, Rubin and Ellis5,Reference Bossard, Bourgoin and Corbeau14 Three consecutive waveforms were averaged per site, and the mean of bilateral readings was used for analysis. Reference Alabbas, Mohammed and Abdullah9–Reference Naik, Basu and Kothari11 A low wall filter (25–100 Hz) was applied, and the gain was adjusted to minimise background noise and preserve waveform clarity. The renal resistive index was calculated as (peak systolic velocity − end-diastolic velocity)/peak systolic velocity. Reference Platt, Rubin and Ellis5 Renal resistive index measurements were initiated at six hours postoperatively, a predefined research time point selected to allow haemodynamic stabilisation after ICU arrival. Reference Ricci, Pezzella and Romagnoli10,Reference Naik, Basu and Kothari11 All Doppler examinations were performed at the bedside by trained paediatric cardiac intensive care unit intensivists using a standardised acquisition protocol. Images were stored in the institutional PACS and independently reviewed by the same paediatric radiologist for quality assurance, who was blinded to acute kidney injury status and all clinical outcome data. Ultrasound training for intensivists and fellows included attending formal ultrasound instruction and completing a minimum of 10 supervised bedside renal Doppler examinations under the guidance of a senior intensivist and radiology technician, until satisfactory competency in image acquisition and interpretation was achieved.
Six-hour renal Doppler assessment of the renal resistive index (RRI) following cardiac surgery. Representative RRI waveforms from six different patients obtained from the upper, middle, and lower renal poles (left to right). Panels A–C show normal RRI values, and panels D–F illustrate elevated RRI values from the corresponding poles.

Figure 1 Long description
The image consists of six panels labeled A to F, each containing a renal Doppler ultrasonography waveform and a corresponding resistive index graph. Panels A, B, and C display normal renal resistive index (RRI) values from the upper, middle, and lower renal poles, respectively. Panels D, E, and F show elevated RRI values from the corresponding poles. Each panel includes a color-coded Doppler image with red and blue flow indicators and a waveform graph below it. The graphs depict the velocity of blood flow in centimeters per second over time, with specific values for systolic velocity (Vs), diastolic velocity (Vd), and resistive index (RI) provided in each panel. The Doppler images and waveforms illustrate the differences in renal perfusion between normal and elevated RRI values, highlighting the potential for early detection of acute kidney injury in infants after cardiac surgery.
Timing and outcomes
Acute kidney injury was defined using Kidney Disease: Improving Global Outcomes criteria, and infants were categorised as acute kidney injury or non-acute kidney injury only after the full 48-hr Kidney Disease: Improving Global Outcomes window. The six-hour renal resistive index served as the primary early measurement and was evaluated as an early marker of acute kidney injury within this diagnostic window. Renal resistive index at 48 hr and at discharge were evaluated as secondary time points to characterise renal resistive index in relation to concurrent acute kidney injury status and early recovery, rather than as early predictors. All renal resistive index values used in analyses were obtained from intensivist-performed examinations to reflect real-time bedside practice. Correlations were assessed between renal resistive index and acute kidney injury markers (serum creatinine, urine output, and need for peritoneal dialysis) as well as the inotropic score. The vasoactive–inotropic score Reference Gaies, Gurney and Yen15 was calculated as follows: dopamine (µg/kg/min) + dobutamine (µg/kg/min) + 100 × epinephrine (µg/kg/min) + 100 × norepinephrine (µg/kg/min) + 10 × milrinone (µg/kg/min) + 10 000 × vasopressin (U/kg/min) + 1 × phenylephrine (µg/kg/min). Urine output was recorded hourly via an indwelling bladder catheter, which was maintained for at least the first 48 postoperative hours in all infants.
Statistical analysis
Continuous variables were summarised as mean ± SD or median [Interquartile Range (IQR)] and compared using the t-test or Mann–Whitney U test. Categorical data were analysed with the χ2 or Fisher’s exact test. Diagnostic performance was assessed using receiver operating characteristic curves with area under the curve and 95% confidence intervals; optimal cut-offs were derived using the Youden index. Receiver operating characteristic analyses were performed for any acute kidney injury (Kidney Disease: Improving Global Outcomes Stage 1–3) versus no acute kidney injury. Moderate-to-severe acute kidney injury (Kidney Disease: Improving Global Outcomes Stage 2–3) was evaluated only in secondary threshold-based analyses and was not used to generate separate receiver operating characteristic curves. Correlations were assessed using Pearson or Spearman coefficients, with statistical significance set at p < 0.05. Analyses were performed using SPSS v26.0 (IBM Corp., Armonk, NY, USA). Sensitivity, specificity, positive predictive value, and negative predictive value, each with 95% confidence intervals calculated using binomial methods, were computed for selected renal resistive index thresholds. Multivariable analysis was not performed because the sample size did not allow reliable adjustment without overfitting.
Results
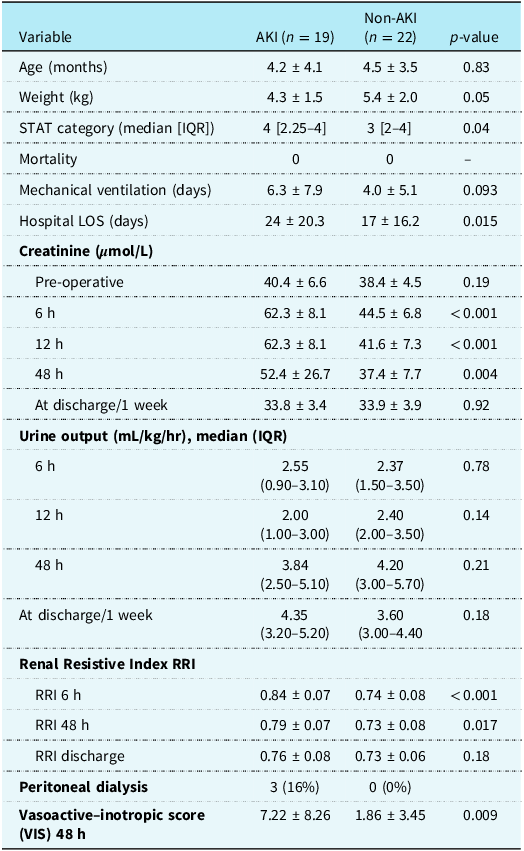
Forty-one infants were enrolled (19 acute kidney injury, 22 non-acute kidney injury) (Figure 2). The two groups were comparable in age and weight but differed in surgical complexity, with higher STAT categories in the acute kidney injury group (median 4 [IQR 2.25–4]) compared with the non-acute kidney injury group (median 3 [IQR 2–4]). Baseline and postoperative variables and outcomes are summarised in Table 1.
Study enrolment flow diagram.

Figure 2 Long description
The diagram illustrates the study enrolment process for infants undergoing cardiac surgery. It begins with sixty infants, of which forty-one are included in the final cohort. The final cohort is divided into two groups: nineteen infants in the acute kidney injury group and twenty-two in the non-acute kidney injury group. The diagram also shows that nineteen infants are excluded due to various reasons such as pre-existing acute kidney injury, renal replacement therapy, structural renal anomalies, incomplete Doppler studies, and acute kidney injury on intensive care unit arrival.
Baseline and postoperative variables, demographical data and outcome in infants with and without acute kidney injury (AKI)

Table 1 Long description
A table comparing baseline and postoperative variables in infants with and without acute kidney injury. The table has 19 rows and 7 columns. The columns are labeled Variable, AKI, Non-AKI, and p-value. The rows include data on age, weight, STAT category, mortality, mechanical ventilation days, hospital length of stay, creatinine levels at various times, urine output, renal resistive index, peritoneal dialysis, and vasoactive-inotropic score. Notable trends include higher STAT categories in the AKI group, significant differences in creatinine levels at 6, 12, and 48 hours post-operation, and higher vasoactive-inotropic scores in the AKI group.
Data presented as mean ± SD or n: number (percentage %). RRI = renal resistive index; STAT Society of Thoracic Surgeons–European Association for Cardio-Thoracic Surgery (STAT) mortality categories. AKI diagnosis used 48-hr KDIGO criteria. p-Value<0.05 considered significant.
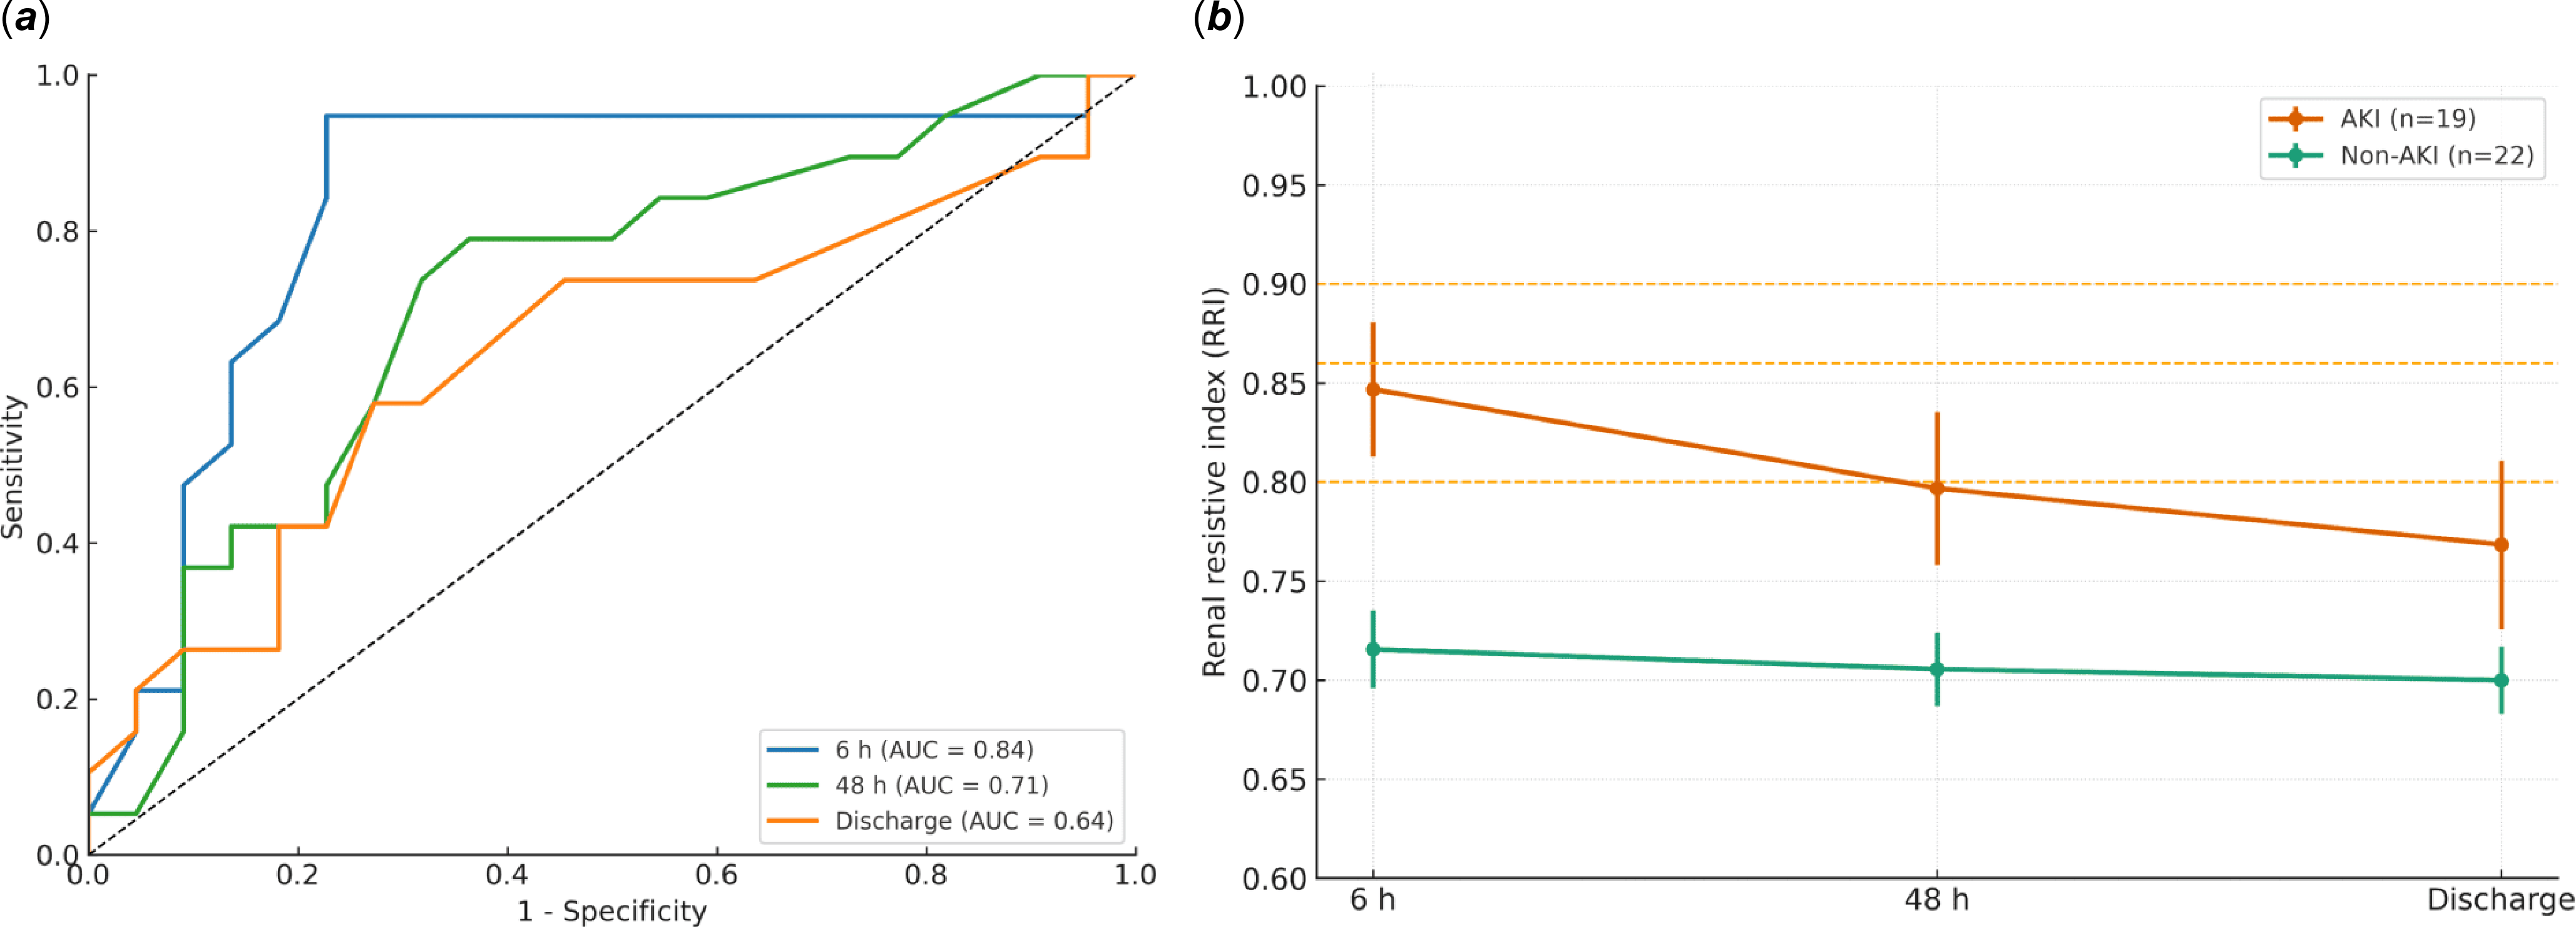
At six hours post-surgery, renal resistive index was significantly higher in acute kidney injury infants (0.84 ± 0.07 vs. 0.74 ± 0.08; p = 0.0002). At 48 hr, renal resistive index remained elevated (0.79 ± 0.07 vs. 0.73 ± 0.08; p = 0.017; area under the curve 0.70; 95% CI 0.53–0.87), but differences were no longer significant at discharge (0.76 ± 0.08 vs. 0.73 ± 0.06; p = 0.18; area under the curve 0.62; 95% CI 0.44–0.80). Serum creatinine was also higher in the acute kidney injury group at 6 hr, 12 hr, and 48 hr, paralleling the renal resistive index trend, with values converging between groups by discharge. The six-hour renal resistive index also showed a moderate positive correlation with the magnitude of creatinine rise over the first 48 hr, analysed as a continuous variable across the entire cohort. Of the 19 infants who ultimately developed acute kidney injury within 48 hr, 13 (68%) already met Kidney Disease: Improving Global Outcomes criteria at 6 hr postoperatively—9 by creatinine alone, 2 by urine-output thresholds alone, and 2 by both criteria. Early urine output at six and 12 hr did not differ significantly between acute kidney injury and non-acute kidney injury groups (p = 0.78 and p = 0.14). Median (IQR) urine-output values for all time points are provided in Table 1. Within the acute kidney injury group, 14 infants (73%) had Stage 1 acute kidney injury, 2 infants (11%) had Stage 2, and 3 infants (16%) had Stage 3. Six-hour renal resistive index values increased stepwise across acute kidney injury severity (Stage 1: 0.83 ± 0.08; Stage 2: 0.87 ± 0.01; Stage 3: 0.94 ± 0.05). Serum creatinine at 48 hr showed a similar gradient (Stage 1: 41 ± 17 µmol/L; Stage 2: 84 ± 20 µmol/L; Stage 3: 97 ± 25 µmol/L), with the highest values occurring in Stage 2–3 infants. Diagnostic performance (Figure 3(a)) demonstrated the best discrimination for acute kidney injury at six hours (area under the curve = 0.83; 95% CI 0.68–0.97), with declining accuracy at 48 hr (area under the curve = 0.70) and discharge (area under the curve = 0.62). Temporal renal resistive index trends (Figure 3(b)) showed persistently higher values in acute kidney injury infants at six and 48 hr (p < 0.05). At six hours, an renal resistive index ≥ 0.86 identified infants at higher risk of moderate-to-severe acute kidney injury (Kidney Disease: Improving Global Outcomes Stage 2–3), with a sensitivity of 100% (95% CI 57–100%), specificity 86% (95% CI 71–94%), positive predictive value 50% (95% CI 24–76%), and negative predictive value 100% (95% CI 89–100%). Conversely, an renal resistive index < 0.80 effectively excluded moderate-to-severe acute kidney injury, achieving an negative predictive value of 100% (95% CI 84–100%), with corresponding sensitivity 100% (95% CI 57–100%), specificity 57% (95% CI 41–72%), and positive predictive value 25% (95% CI 11–47%). Thirteen infants arrived from the operating room with a peritoneal catheter (8 in the acute kidney injury group and 5 in the non-acute kidney injury group). In the acute kidney injury group, 3 infants required peritoneal dialysis, while the others received passive drainage; no infant in the non-acute kidney injury group required dialysis. All three infants requiring peritoneal dialysis (15.8% of the acute kidney injury group) met Kidney Disease: Improving Global Outcomes Stage 2–3 criteria and exhibited a six-hour renal resistive index ≥ 0.90. At the time of peritoneal dialysis discontinuation, RRI measurements had decreased to < 0.80, accompanied by urine output > 1 mL/kg/h and improving renal function. The temporal relationship between renal resistive index trends, urine output, and the timing of peritoneal dialysis is illustrated in Figure 4.
Renal resistive index (RRI) performance and temporal trends after infant cardiac surgery. ( a ) Receiver operating characteristic (ROC) curves demonstrating the best discrimination for acute kidney injury (AKI) at 6 hr (AUC = 0.83), with progressively lower diagnostic accuracy at 48 hr and discharge. ( b ) Temporal changes in mean ±95% CI of RRI for infants with and without AKI. Dashed lines indicate pragmatic threshold values (< 0.80 reassuring, ≥ 0.86 predictive, and ≥ 0.90 representing an exploratory high-risk band).

Figure 3 Long description
The image contains two graphs. The first graph is a receiver operating characteristic (ROC) curve showing the diagnostic accuracy of the renal resistive index (RRI) for predicting acute kidney injury (AKI) at different time points. The ROC curve demonstrates the best discrimination for AKI at 6 hours with an area under the curve (AUC) of 0.83, progressively lower diagnostic accuracy at 48 hours, and discharge. The second graph is a line graph showing temporal changes in the mean and 95% confidence interval (CI) of RRI for infants with and without AKI. The graph includes dashed lines indicating pragmatic threshold values: less than 0.80 is reassuring, 0.86 is predictive, and 0.90 represents an exploratory high-risk band. The AKI group is represented by an orange line, and the non-AKI group by a green line. The x-axis represents time points (6 hours, 48 hours, and discharge), and the y-axis represents the renal resistive index (RRI). The graph shows a decline in RRI over time for both groups, with the AKI group consistently having higher RRI values. All values are approximated.
Temporal relationship between renal resistive index (RRI), urine output (UO), and the timing of peritoneal dialysis initiation in infants with cardiac surgery–associated acute kidney injury (CSA-AKI).

Figure 4 Long description
A line graph illustrates the temporal relationship between renal resistive index (RRI), urine output (UO), and the timing of peritoneal dialysis initiation in infants with cardiac surgery-associated acute kidney injury (CSA-AKI). The x-axis represents time, starting from 0 hour (CSA-AKI) to the recovery of AKI, with a specific focus on the 6-hour mark. The y-axis measures UO in milliliters per kilogram per hour, ranging from 0 to 1.2. The graph features two main data lines: a blue dashed line representing UO and an orange dashed line indicating the RRI. The RRI is initially at 0.9 and is highlighted as a critical threshold. The graph identifies a proposed need for peritoneal dialysis in CSA-AKI patients, particularly in those classified under KIDGO stage II and stage III. The shaded regions in red and pink highlight the areas where peritoneal dialysis is proposed, corresponding to KIDGO stage II and stage III, respectively. The graph includes images of an infant in a medical setting and a renal Doppler ultrasonography scan, emphasizing the clinical context. All values are approximated.
At 48 hr, the vasoactive–inotropic score remained significantly higher in acute kidney injury infants (7.2 ± 8.1 vs. 1.9 ± 3.4; p = 0.009), and the six-hour renal resistive index correlated positively with the vasoactive–inotropic score (r = 0.56; p < 0.001). Inter-observer agreement between intensivist and radiologist measurements was assessed in a subset of 12 infants, with a mean absolute renal resistive index difference of 0.02 ± 0.03, indicating no clinically meaningful discrepancies.
Discussion
Acute kidney injury is a frequent and serious complication after congenital cardiac surgery in neonates and infants. Reference Blinder, Goldstein and Lee1–Reference Alghamdi, Bin Mahfooz and Almutairi3 Early postoperative creatinine and urine output may be influenced by intraoperative factors such as modified ultrafiltration or the presence of peritoneal catheters, which further underscores the value of an independent perfusion-based measure such as the renal resistive index. Reference Zappitelli, Parikh and Akcan-Arikan4,Reference Ricci, Pezzella and Romagnoli10,Reference Naik, Basu and Kothari11 Renal resistive index, acquired via renal Doppler ultrasonography, is widely used as a non-invasive marker of renal vascular resistance and perfusion. Reference Platt, Rubin and Ellis5–Reference Alabbas, Mohammed and Abdullah9,Reference Bossard, Bourgoin and Corbeau14 Typical clinical applications include early detection of acute kidney injury, assessment of intrarenal haemodynamics, evaluation of vasoconstriction or venous congestion, and prediction of renal recovery or dialysis need. Reference Platt, Rubin and Ellis5–Reference Naik, Basu and Kothari11,Reference Bossard, Bourgoin and Corbeau14 In most paediatric and adult cohorts, “normal” postoperative renal resistive index values generally fall below ∼0.75–0.80, whereas thresholds in the 0.80–0.85 range have repeatedly been associated with increased acute kidney injury risk Reference Platt, Rubin and Ellis5–Reference Naik, Basu and Kothari11,Reference Bossard, Bourgoin and Corbeau14,Reference Zhang, Zhang and Zhou16,Reference Guinot, Bernard and Abou Arab17 (Supplementary Table 1). In this prospective cohort of infants < 12 months undergoing congenital cardiac surgery, the six-hour renal resistive index values in non-acute kidney injury infants averaged 0.74 ± 0.08—consistent with published normative postoperative ranges. Reference Ricci, Pezzella and Romagnoli10,Reference Naik, Basu and Kothari11,Reference Zhang, Zhang and Zhou16 A single renal resistive index measurement obtained at six hours postoperatively demonstrated the strongest diagnostic performance (area under the curve = 0.83) for acute kidney injury that was ultimately diagnosed over the full 48-hr Kidney Disease: Improving Global Outcomes window, supporting its feasibility as an early physiologic risk marker rather than a synchronous diagnostic tool. Reference Ricci, Pezzella and Romagnoli10,Reference Naik, Basu and Kothari11 Values ≥ 0.86 were most predictive of acute kidney injury, whereas values < 0.80 effectively excluded moderate-to-severe acute kidney injury. These thresholds demonstrated a consistent statistical signal in this cohort and were generally aligned with prior perioperative paediatric studies, Reference Ricci, Pezzella and Romagnoli10,Reference Naik, Basu and Kothari11,Reference Bossard, Bourgoin and Corbeau14,Reference Zhang, Zhang and Zhou16,Reference Guinot, Bernard and Abou Arab17 though their clinical applicability should be interpreted in light of the study’s sample size and design. All infants requiring peritoneal dialysis (n = 3) had renal resistive index ≥ 0.90, identifying an upper boundary linked to severe outcomes. The persistently higher renal resistive index values observed at 6 and 48 hr confirm the index’s sensitivity to postoperative haemodynamic and vascular resistance changes rather than solely renal parenchymal injury. Reference Platt, Rubin and Ellis5,Reference Schnell, Darmon and Duranteau6 This highlights renal resistive index as a dynamic physiologic marker of renal perfusion and systemic circulatory stress in the early postoperative phase. Reference Cizmeci, Uysal Yazici and Demir8,Reference Darabont, Caloianu, Schiller, Rusu and Covic18–Reference Lerolle, Guérot and Faisy20
The observed decline in predictive accuracy by 48 hr (area under the curve = 0.70) further underscores that renal resistive index reflects evolving circulatory conditions rather than fixed renal damage. Reference Schnell, Darmon and Duranteau6,Reference Cizmeci, Uysal Yazici and Demir8,Reference Darabont, Caloianu, Schiller, Rusu and Covic18,Reference Lerolle, Guérot and Faisy20 In acute kidney injury infants, renal resistive index generally decreased from 6 hr to 48 hr and discharge, paralleling biochemical improvement in most cases, suggesting potential utility of later renal resistive index values as markers of early recovery rather than predictors. Recent paediatric data from Souza et al. Reference Souza, de Carvalho and Ferraz19 also identified an early postoperative renal resistive index cut-off of 0.85 (area under the curve 0.83) and demonstrated that vasoactive–inotropic score was an independent predictor of severe acute kidney injury. These findings align closely with our results and support the physiologic relationship observed in our cohort between elevated renal resistive index and higher inotropic requirements.
Findings from Guinot et al. and Darabont et al. Reference Guinot, Bernard and Abou Arab17,Reference Darabont, Caloianu, Schiller, Rusu and Covic18 similarly show that higher renal resistive index values (∼0.83–0.85) correlate with persistent or severe acute kidney injury and can predict dialysis requirements, supporting the clinical relevance of the ≥ 0.90 threshold in our cohort. A minority of non-acute kidney injury infants exhibited transient renal resistive index elevation without a rise in creatinine; however, no biomarker samples (e.g., NGAL, KIM-1) were collected in this study to help distinguish haemodynamic changes—such as short-lived postoperative vasoconstriction or venous congestion—from intrinsic renal injury. Reference Zappitelli, Parikh and Akcan-Arikan4,Reference Bossard, Bourgoin and Corbeau14,Reference Darabont, Caloianu, Schiller, Rusu and Covic18
The positive correlation between six-hour renal resistive index and vasoactive–inotropic score (r = 0.56; p < 0.001) supports the notion that elevated renal resistive index reflects systemic circulatory stress as well as renal perfusion impairment. This relationship reinforces the role of RRI as a combined indicator of renal perfusion adequacy and cardiovascular stability. Reference Platt, Rubin and Ellis5,Reference Schnell, Darmon and Duranteau6,Reference Cizmeci, Uysal Yazici and Demir8,Reference Darabont, Caloianu, Schiller, Rusu and Covic18,Reference Lerolle, Guérot and Faisy20,Reference Schnell, Deruddre and Souweine21 In this cohort, six-hour renal resistive index provided perfusion-based information that complemented serum creatinine, while early urine output at 6 and 12 hr did not differ significantly between acute kidney injury and non-acute kidney injury infants, underscoring the potential added value of renal resistive index beyond conventional markers. Notably, non-dialysis acute kidney injury infants in our cohort typically had vasoactive–inotropic score values of 7–10, whereas those with higher vasoactive burden (VIS ≥ 18–20) tended to have concurrently elevated six-hour renal resistive index. This exploratory observation does not imply causality and was used only to conceptually inform Supplementary Figure 1; external validation is required before clinical application. The six-hour renal resistive index was interpreted as an early physiologic marker rather than a synchronous measure of acute kidney injury. Compared with previous paediatric renal resistive index studies, our work focuses on a strictly infant-only cohort (< 12 months), uses a predefined six-hour postoperative measurement that offers greater temporal precision than the broader 6–24 hr windows used in earlier cohorts, Reference Cizmeci, Uysal Yazici and Demir8–Reference Naik, Basu and Kothari11 and links renal resistive index to inotropic burden and dialysis requirement to propose practical infant-focused thresholds. Reference Guinot, Bernard and Abou Arab17–Reference Lerolle, Guérot and Faisy20 The use of a standardised bedside intensivist-performed Doppler protocol with independent radiologist review further supports the real-world feasibility and reliability of early renal resistive index assessment.
This study is limited by its single-centre design and modest sample size, which did not permit reliable multivariable adjustment and may have limited control of important confounders, though procedural consistency was supported by minimal inter-observer differences between intensivist and radiologist measurements.
In clinical practice, an elevated early renal resistive index may prompt nephroprotective measures—such as optimising haemodynamics, avoiding fluid overload, and minimising nephrotoxic exposures. In summary, a six-hour renal resistive index may serve as an early risk marker for acute kidney injury after infant cardiac surgery. An renal resistive index ≥ 0.86 may identify infants at risk of moderate-to-severe acute kidney injury, whereas values ≥ 0.90 may indicate a subgroup at higher risk. The subsequent decline in renal resistive index at later time points may also offer insight into early recovery. These thresholds should be considered preliminary and hypothesis-generating, and larger multicentre studies are needed to validate these findings.
Supplementary material
The supplementary material for this article can be found at https://doi.org/10.1017/S1047951126112219.
Acknowledgements
None.
Author contributions
Ahmed R. Elsaoudi and Hussam K. Hamadah contributed equally to this work and share first authorship.
Financial support
None.
Competing interests
None declared.
Ethical standard
Institutional Review Board approval (NRC21R/498/10), King Abdullah International Medical Research Center, Riyadh, Saudi Arabia.