For psychological tests to be considered appropriate for professional use, certain technical-scientific criteria need to be met, especially appropriate psychometric indexes (good validity and accuracy indicators, and appropriate normative references) (Urbina, Reference Urbina2007). These principles are internationally accepted as indicated by guidelines from the International Test Commission (ITC, 2015).
The Rorschach test, originally published in 1921, is an efficient and sensitive instrument to understand the dynamics of the human psyche and has a prominent position worldwide in the field of personality assessment (Azoulay Emmanuelli, Rausch de Traubenberg, Corroyer, Rozencwajg, & Savina, 2007). Its continuous technical-scientific improvement is one of its greatest advantages in comparison to other instruments available in the scientific literature. It has an important history of positive psychometric evidence and promising results in different sociocultural contexts (Azoulay et.al., 2007; Giromini, Viglione & McCullaugh, Reference Giromini, Viglione and McCullaugh2015; Ikiz et al., Reference Ikiz, Zabci, Düsgör, Atak, Yavuz, Purisa and Cagatay2010; Ikiz, Düsgör, Atak, Mete, & Kalem, Reference Ikiz, Düsgör, Atak, Mete and Kalem2015; Kivisalu, Lewey, Shaffer, & Canfield, Reference Kivisalu, Lewey, Shaffer and Canfield2016; Meyer, Shaffer, Erdberg, & Horn, Reference Meyer, Giromini, Viglione, Reese and Mihura2015; Mihura, Meyer, Dumitrascu, & Bombel, Reference Mihura, Meyer, Dumitrascu and Bombel2013; Mihura, Meyer, Bombel, & Dumitrascu Reference Mihura, Meyer, Bombel and Dumitrascu2015; Yazigi, et al., Reference Yazigi, Semer, Fiore, Abela, Lerman and Marques2016).
The many studies conducted with the Rorschach test involve the existence of different assessment systems and this study highlights the perspective provided by Rorschach French School (Anzieu, Reference Anzieu1986; Rausch de Traubenberg, Reference Rausch de Traubenberg1998). With regard to studies that aimed to develop contemporary normative references to this method, studies conducted in France (Azoulay et al., Reference Azoulay, Emmanuelli, Rausch de Traubenberg, Corroyer, Rozencwajg and Savina2007) and in Turkey (Ikiz et al., Reference Ikiz, Zabci, Düsgör, Atak, Yavuz, Purisa and Cagatay2010, Reference Ikiz, Düsgör, Atak, Mete and Kalem2015) should be mentioned. Further, the method has been exhaustively investigated in Brazil, seeking to develop normative references appropriate to the current time for the different age groups. In this sense, Rorschach norms (French School) were developed for children (Fernandes, Reference Fernandes2010; Raspantini, Reference Raspantini2010), adolescents (Cury-Jacquemim, 2012; Jardim-Maran, Reference Jardim-Maran2011), adults (Freitas, Reference Freitas2016; Pasian, Reference Pasian1998) and the elderly (Gavião, Reference Gavião2002). Therefore, great investment has been made in the test’s technical-scientific improvement in different environments and cultures, advancing the evidence of the French School’s analytical framework.
In addition to normative references, another necessary technical indicator of a psychological assessment instrument is the temporal stability of its results, which confers confidence and supports the data it generates. This technical requirement is called accuracy or reliability (Urbina, Reference Urbina2007). Viglione and Meyer (Reference Viglione, Meyer, Gacono, Evans and Kaser-Boyd2008) stated that the accuracy of a psychological test essentially corresponds to the consistency of its scores over time. The authors also note that further investigation of indicators of the stability of the Rorschach test is needed, given the importance of technical decisions and professional referrals that are based on the instruments’ results.
In Brazil, the study conducted by Romaro and Loureiro (Reference Romaro and Loureiro1994) intended to identify and compare the way primitive defensive mechanisms express in borderline patients, using case studies. They tested and then retested a total of five adult psychiatric patients, after approximately five years, with at least three assessment methods, among them the Rorschach test (French School). The results indicated a stable personality structure, as shown by similar verbalizations concerning defense mechanisms during the application and reapplication of Rorschach, attesting to the structural stability of findings that resulted from this method of psychological assessment based on the French School.
Based on the theoretical-methodological perspective of Rorschach’s Comprehensive System (CS) (Exner, Reference Exner1974), other investigations show the temporal stability of this method in the assessment of personality, such as the studies described by Exner (Reference Exner2003). The study conducted by Sultan, Andronikof, Réveillère, and Lemmel (Reference Sultan, Andronikof, Réveillère and Lemmel2006) also proposes assessing the level of stability of Rorschach’s findings. In their study, 75 French adult non-patients were assessed and reassessed with an interval of three months. The average level of correlation among the Rorschach’s selected variables reached .53, that is, a reasonable indicator of stability and accuracy of data.
Hartmann, Halvorsen, and Wang (Reference Hartmann, Halvorsen and Wang2013), in turn, assessed 46 individuals (39 women and seven men) aged 28 to 58 years old, in a follow-up study nine years after an initial assessment and used, among other instruments, the Rorschach test (Compreehensive System). These participants were divided into one clinical and one non-clinical group. In the first assessment, 14 individuals presented clinical depression (CD), 17 were previously depressed (PD) and 15 were not depressed (ND). In the reassessment, 32 participants, including the 14 (CD), 17 (PD) and one (ND), reported one or more episodes of major depression during the follow-up interval, while one individual from the CD group became chronically depressed. The remaining 14 individuals did not present depression. The authors highlighted that the results of the two applications of the Rorschach test showed moderate to strong positive correlation of the variables: WSum6, X–%, MQ, C, SumY, AG, and MOR, with the correlation ranging from .34 (SumY) to .67 (MOR). They also pointed out that the Rorschach’s variables predicted the recurrence of depression.
Roberts and DelVecchio (Reference Roberts and DelVecchio2000) completed the most comprehensive review of trait stability, providing a meta-analysis of 152 studies to test when trait consistency stabilizes in the life course based on longitudinal samples examining temperament and personality. Their data showed that trait consistency increased with age across childhood, adolescence, and young adulthood and peaked sometime after age 50. The peak level of consistency after age 50 was well below unity, affirming that personality traits do not stop changing at a specific point in the life course. They also found the average trait consistency declined over longer retest intervals. For a 20-year old person the average expected retest correlation over periods of 1-year, 5 years, 10 years, 20 years, and 40 years would be .55, .52, .49, .41, and .25, respectively; the average consistency for a 15-year interval would be about .45. Also, in their analyses, data from non-objective measures such as the Rorschach showed stability that on average was about r = .05 lower than self-report or observer rating, suggesting that Rorschach scores over a 15-year period may have stability of about r = .40.
Grønnerød (2006) reviewed data from a meta-analysis study he had published in 2003 on the temporal stability of the Rorschach Method (Comprehensive System) for the correction of methodological problems. In the 2003 publication, he described the analysis of articles published between the years 1921 to 2002. The results showed high temporal stability by Pearson’s correlation (.68 to .73) for all the studies analyzed, with a mean retest period of three years. In 2006, the author reanalyzed the articles using a hierarchical regression model and confirmed the good stability levels between the measurements (between .69 and .74). Among the 26 studies reporting correlations, refined regression equations showed the average predicted stability across variables for different periods would be: 1 month (.75); 1 year (.67), 5 years (.60), 15 years (.55), and 40 years (.51). He found that stability declined as a function of the time between test and retest and he observed lower stability for variables thought to be related to state-like qualities and higher stability for variables thought to be trait-like. He further stated that the results suggest that only active psychotherapy leads to pronounced personality changes in a short period of time, which goes beyond the inevitable changes observed over long periods of time.
To understand about temporal stability of the Rorschach French School in Brazilian adults we conducted this study. The following aim was addressed.
We wanted to verify the temporal stability of personality characteristics evidenced by the Rorschach test (French School), by reassessing (after 15 years) non-patient adults, previously addressed in a normative study (Pasian, Reference Pasian1998). Hence, results obtained in Pasian (Reference Pasian1998) from non-patient adult individuals were compared and correlated with those obtained in a current reassessment. We sought to identify aspects that represented personality’s structural components (more stable) and functional components (less stable components linked to individuals’ situational contexts).
Method
Participants
This study’s participants were recruited from Pasian’s study (1998) which assessed 405 individuals. In 1998 they were selected based on the following criteria: Individuals aged between 20 and 59 years old, with varied levels of education (low, average and high education), from low and high socioeconomic levels, who did not have history of psychiatric disorder, severe psychological disorder or intellectual deficits.
In the reassessment conducted in 2013, we tried to contact the adults with maximum age of 69 years old (this cutoff point was adopted by convenience to represent adult age), totaling 369 cases from 405. The primary author directly and indirectly contacted (by telephone, social networks or e-mail) 88 individuals, who consented to cooperate with this study and another 38 individuals who did not. The first author found out that 19 individuals no longer lived in the city, one patient was sick and nine had died, totaling a network of 155 individuals that represent 42% of 369 cases initially considered.
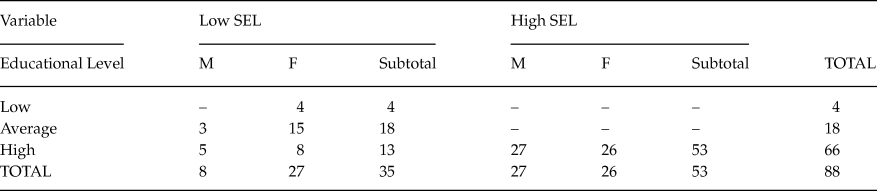
Therefore, a sample of 88 individuals aged between 34 and 69 years old (mean = 53.64 years old, ± SD 9.61) was composed: 35 men and 53 women with different socioeconomic and educational levels. Table 1 presents the characterization of the participants of this current study according to socioeconomic and educational levels and sex.
Characterization of the Participants According to Socioeconomic Level, Gender and Educational Level

Notes: M = Male; F = Female.
SEL = Socioeconomic Level.
Educational Level: Low = zero to two years of schooling; Average = three to eight years of schooling; High = nine or more years of schooling.
The group of individuals with low socioeconomic level is mostly composed of women (77%), and the individuals with high socioeconomic level is equally distributed between sexes (49% women and 51% men). In regard to years of schooling, the individuals composing the low socioeconomic level group had predominantly attended primary and middle schools (low and average education level), while most of the individuals with high socioeconomic level presented high education (either bachelor’s degree or graduate studies).
Instruments and Procedures
The following instruments were used in the reassessment:
Brazil Criteria of Economic Classification (ABEP, 2012)Footnote 1: This instrument helps to make an economic classification based on the characteristics of the participants’ households (whether items considered to provide comfort at home are available in these households and, if they are available, how many items, in addition to the educational level of the household head). Scores are assigned according to the items and quantity of items available in the household and correspond to the following classification: A1, A2, B1, B2, C1, C2, D, E. A1 indicates the highest income and social class while a rank of E indicates the lowest one.
Self-Report Questionnaire 20 (SRQ–20): It was developed by the World Health Organization to assess mental health indicators. Closed questions (yes, no) are used and only those answered positively are scored to each response, resulting in the instrument’s final score. According to Santos, Araújo & Oliveira (Reference Santos, Araujo and Oliveira2009), which study was conducted in Brazil, scores equal to or higher than seven or eight indicate potential cases of individuals with mental disorders. The SRQ was applied as an interview, which enables establishing rapport with the participants.
Rorschach Method: This instrument to assess personality is composed of a standardized set of 10 inkblot images, data entry sheets, standard sheets to locate responses, sheets for coding responses and a stopwatch to record the speed with which individuals make associations and interpretation. The process of application, coding and analysis of responses followed the standards of the Rorschach French School (Rausch de Traubenberg, Reference Rausch de Traubenberg1998), described below.
Administration guidelines Rorschach French School
In the response phase, the respondent give as many responses as she or he wants. Also, she or he can refuse some cards and not give any response. In this first phase, the examiner also notes the latency time until the respondent gives the first response to each card and the total time that the participant remains with the card in hands. In the inquiry phase, when it is necessary to verify about each response (“What made it seem like …”), the participant can deny any response; also the respondent may say that is no longer sees what had been reported in the response phase. Lastly, the participant is allowed to give spontaneous additional responses in the inquiry phase. The number of Responses (R), Additional Responses (AdR) from the inquiry, Refusals (Ref) when no response is given, and Denials (Den) when a response is no longer seen during inquiry are called Productivity Indexes. In normative studies, Additional Responses are coded separately and they do not compose the general data relating to the classifications for Location, Determinants, Content, and Banality.
Data collection
This study was approved by the Institutional Review Board at the Faculty of Philosophy, Sciences and Letters of Ribeirão Preto, University of São Paulo. The participants received a letter inviting them to participate in the study and presenting the study’s proposal, its objective and data collection procedure. The participants voluntarily signed free and informed consent forms and individual sessions of approximately 90 minutes were held in places and under conditions appropriate for implementing a psychological assessment. The instruments were applied in the following sequence: (a) Brazil Criteria of Economic Classification; (b) SRQ–20; (c) Rorschach’s Method - French School Approach (Rausch de Traubenberg, Reference Rausch de Traubenberg1998), respecting the technical standards of the manual.
Analysis of Results
The instruments were individually examined based on their respective technical manuals. Data were summarized in a computer spreadsheet to enable proper statistical treatment.
Pasian’s study (1998), which was conducted with adults living in Ribeirão Preto, SP, Brazil, originated the manual (with the location tables and formal qualities of the responses) it was the reference to coding the responses currently obtained in the present study. The first author and another judge independently classified each Rorschach protocol. When there was no consensus between them, a third judge analyzed the protocol and provided a final classification to the responses of each case.
Data concerning the independent assessments of responses collected in 2013 were also used to analyze the interrater reliability of the Rorschach test. Six psychologists composed the team of examiners, one of which was the primary researcher (Judge 1) and the remaining were collaborators. Interrater reliability was verified by calculating the Kappa index based on the total number of responses (379 responses) identified in 22 Rorschach protocols (25% of the sample), randomly selected among the 88 cases.
In regard to the Rorschach test, the final classification of the responses given by the 88 adults currently assessed was transposed to specific spreadsheets in the Statistical Package for the Social Sciences (SPSS) Windows, version 17.0. These findings were first examined in terms of descriptive statistics, calculating mean, standard deviation, median, minimum and maximum values, considering all the participants (n = 88). Inferential analyses were then performed (Student’s t-test and Pearson correlation for paired samples, p ≤ 0.05), comparing the averages of the 88 cases and the correlation based on all pairs of individual cases assessed in Pasian (Reference Pasian1998) and reassessed in this study on the following variables: (a) productivity: number of responses (R), number of additional responses (AdR), refusals (Ref) and denials (Den); (b) determinants: FormFootnote 2 (F% , F+% and F+ext%,), Color (FC, CF, C), Shading (FE, EF, E) and Movements (Human (K), Animal (kan), Object (kob), Partial human (kp); (c) Content: Animal (A) and Human (H) (more frequent) and Anatomical (Anat), Botanical (Bot), Object (Obj) (which appeared with a minimum frequency of 2% in both assessments); (d) banal responses (Ban). The calculation of Cohen’s d was performed to verify the size of the differences identified in the statistical comparison (effect size) (Cohen, Reference Cohen1988). It is important to clarify that each response, for each card, is coded in relation to its Location, Determinant, Content and Banality (if applicable), with only one main determinant and one main content coded.
Results
Interrater reliability was obtained using the Kappa coefficient in the four main categories of classification of responses to the Rorschach test. The average of indices to the four categories were: (a) Location = 0.88 (values ranged from 0.66 to 0.96); (b) Determinants = 0.78 (values ranged from 0.71 to 0.90); (c) Content = 0.88 (values ranged from 0.82 to 0.92) and (d) Banality = 0.88. These findings configure indicators of high reliability in this assessment system.
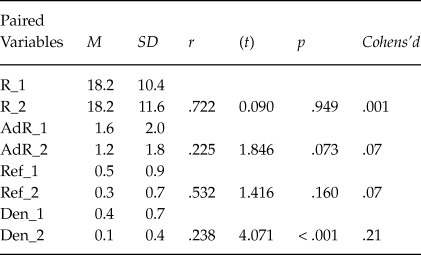
Afterwards, we proceeded to mean comparison from the cases and correlation of all pairs of individual cases from both assessments (1998 and 2013), from the Rorschach’s main variables. Table 2 presents data related to the productivity indicators of the 88 adults.
Descriptive Statistics for Productivity Variables in 1998 and 2013 and the Correlations Between Each Set of Scores (N = 88)

Note: At column “Paired Variables” Number 1 = first assessment (1998 - test); number 2 reassessment (2013 - retest); R = Responses; AdR = Additional Responses; Ref = Refusals; Den = Denial.
No statistically significant difference was found in the variables examined in the assessment and reassessment, except for the variable “denial”, though it presented low incidence the two assessments. The correlation index related to the total number of Rorschach interpretations (R) in both assessments was very high (r = .722), appearing as the variable of greatest stability in the general pattern identified among the participants.
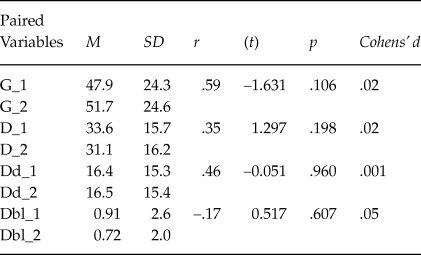
The same analysis to compare and correlation the Rorschach Apprehension Modes (Locations) obtained in the first assessment (1998 – point in Time 1) and final reassessment (current – point in Time 2) are presented in Table 3.
Descriptive Statistics for Locations in 1998 and 2013 and the Correlations Between Each Set of Scores (N = 88)

Note: At column “Paired Variables” Number 1 = first assessment (1998 - test); number 2 reassessment (2013- retest); G = Global response; D = Great Detail Area; Dd = Small Detail; Dbl = White Space.
In both assessments, the basis for response most frequently selected by the respondents to interpret the Rorschach’s test corresponds to the whole inkblot (G), followed by apprehension of great detail (D), and small detail (Dd). Finally, the responses exclusively located in the card’s white area (Dbl location) were infrequent in the two assessments. These findings were reinforced by the good level of correlation (satisfactory indexes according to Urbina, Reference Urbina2007) identified between the responses of 1998 and 2013 found in the whole inkblot (r = .59), great details (r = .35), and small details interpreted by the individuals (r = .46). Based on the Rorschach test’s technical indicators, these findings show that how the environment’s stimuli are addressed remained stable even 15 years after the first assessment.
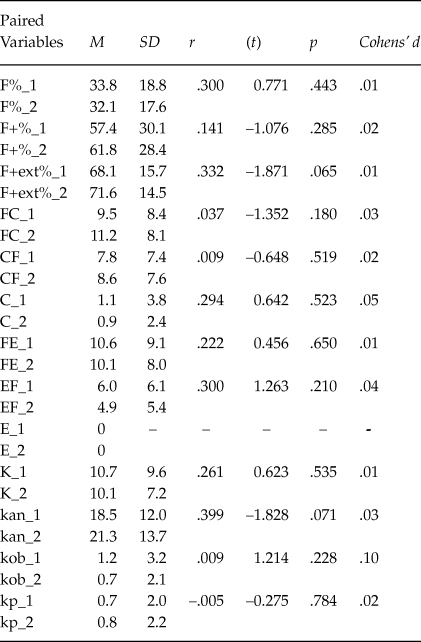
In proceeding with the analyses, we focused on examining the determinants of the adults’ responses to the Rorschach tests at the two points in time (1998 and 2013). These results are presented in Table 4, following the same pattern of analysis already performed for the other variables of this method.
Descriptive Statistics for Determinants (Form, Color, Shading and Movement) in 1998 and 2013 and the Correlations Between Each Set of Scores (N = 88)

Note: At column “Paired Variables” Number 1 = first assessment (1998 - test); number 2 = reassessment (2013 -retest); F = related to form; FC, CF, C = related to color; FE, EF, E = related to shading; K = human movement; kan = animal movement; kob = object movement; kp = partial human movement.
In this comparative analysis, Form (F%), Quality of interpretations (F+% e F+ext%), and the Determinants related to color and shading, the pattern of responses were similar. In regard to the determinants associated with movement (K, kan, kob, kp), it’s noticeable a predominance of it in both assessments. The determinants, however, presented lower levels of correlation between test and retest.
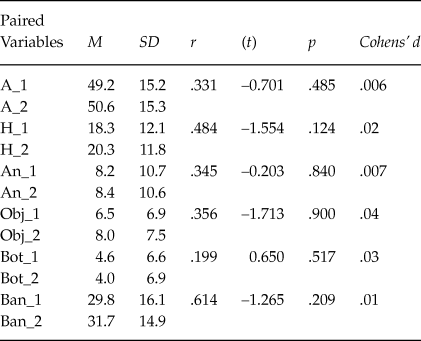
Using the same procedures of statistical comparison and Pearson correlation, we examined the average indices of content predominating in the Rorschach tests: Animals and humans, in addition to anatomical content (Anat), objects (Obj) and botanical content (Bot) and for the average indices of banal responses (Ban), as described in Table 5.
Descriptive Statistics for Content (A, H, Anat, Obj and Bot) and Banality (Ban) in 1998 and 2013 and the Correlations Between Each Set of Scores (N = 88)

Note: At column “Paired Variables” Number 1 = first assessment (1998 - test); number 2 reassessment (2013 - retest); A = proportion of animal content; H = proportion human content; Anat = anatomical content; Obj = Object content; Bot = Botanical content; Ban = banal responses.
The interpretations that emerged from the Rorschach test showed a predominance of animal content over human content in both assessments, as well as a similar proportion of Anat, Obj and Bot content in 1998 and 2013. These results were also similar in regard to banal responses. These findings were strengthened due to the satisfactory indexes of correlations in the content (r between .33 and .61, except for the botanical content, where r = .19).
It is possible to note a small effect size (d) for almost all variables (except for Dbl - the effect was moderate), indicating the low impact that the time caused on the results.
Discussion
The current general results of Rorschach test compared to those of the first assessment show reasonable temporal stability for some indicators and the mean overall stability level of the variables was .28 (± SD = 0.21). Roberts and Del Vechio (2000) found that in personality stability assessment studies with test and retest, it would be expected that, after 10 years, the correlation index would be close to .49 and, after 20 years, reached value around .41 and after 15 years .40 to measures like Rorschach. The calculation of the correlations between the data of the two Rorschach applications in the current study ranged from –.005 to .72. It surpassed the estimates pointed out by Roberts and DelVechio (2000) in some cases, suggesting as good indicators of stability of the Rorschach French School.
In the case of the Rorschach test, empirical evidence of the temporal stability of findings was widely reported in international studies (Exner, Armbruster, & Viglione, Reference Exner, Armbruster and Viglione1978; Grønnerød, 2003, 2006; Perry, McDougall, & Viglione, Reference Perry, McDougall and Viglione1995; Sultan et.al., 2006) and also in Brazil (Silva-Neto & Custódio, Reference Silva-Neto, Custódio and Pasian2010). Hence, current data, in some aspects, corroborate the results of previous studies regarding the stability of various Rorschach variables.
These results brought advancement to the analysis of Rorschach variables that would be representative of more stable elements of personality or more flexible and mutable with time. It is worth noting, however, that the isolated examination of variables of a psychological instrument is a task that requires extreme care. Rausch de Traubenberg (1998) stated that only the interaction of factors (and variables) confers to the Rorschach test a “privileged situation” of analyzing individual characteristics, since it is in this interaction that perceptive and the psychodynamic process of personality takes place. According to this researcher, how the task is approached and how much responses vary over time, among other elements, constitute the expression of personality’s structural aspects.
The number of individuals’ responses in this study remained similar between both applications, even after 15 years. Those who, in the first assessment, provided fewer responses (reduced R) tended to provide a reduce number of interpretations in response to the reassessment stimuli; the same occurred for those who provided many responses, they produced many interpretations in the reassessment. This stable pattern of productivity in response to the Rorschach test remained proportional to the indexes of additional responses (AdR) and refusals (Ref), except for the variable “denial” (Den). It is important to note, however, that given the total number of responses (R = 1,604 in the first assessment and R = 1,599 in the reassessment), the number of denials (36 in the first and 10 in the second) observed was small in both assessments.
Another variable that remained similar in both the assessment and reassessment was the apprehension modes (Locations). Rausch de Traubenberg (1998) states that perceptive modes are associated with stable elements of mental structure, though affective and motivational loads may be present, mobilizing the individuals’ anxiety and defense mechanisms; this could interfere in the way they address environment stimuli. Considering that apprehension modes refer to the way an individual addresses a real situation and that the participants were in the adult phase, we can hypothesize that the apprehension mode works as an index representing the personality structure, evidence of which was seen in the results.
For the determinants of Rorschach responses linked to the stimuli’s shape aspects (F%, F+% e F+ext%), the average indexes of F% and F+ext% presented low correlation indexes between the two assessments (r = .30 and .33, respectively). Rausch de Traubenberg (1998) sees the meaning of F% as an effort to implement rational organization and also an attempt to adapt to reality. She also states that F+% and F+ext% can change according to affective state, and one’s intellectual efficiency may be disturbed due to emotional experiences. Hence, even though rational effort is a structural component of personality, it seemed permeable to situational elements, showing aspects of the individuals’ mental functioning.
In an attempt to deepen understanding of these findings, it is important to reconsider principles of interpreting the Rorschach French Approach (Rausch de Traubenberg, Reference Rausch de Traubenberg1998). According to this author, the determinants are the most original creative element of Rorschach, but also the most difficult to understand from a theoretical point of view. Therefore, we assert that the responses that include colors as determinants offer important information about affective experiences. The author notes that colors play a role of a more personal meaning in the analysis of Rorschach stimuli and may individually vary and change according to the context. In any case, the perceptive process that triggers responses determined by color refers to a passive position in the face of a visual stimulus, revealing a “momentary loss of the active work of organization” (Rausch de Traubenberg, Reference Rausch de Traubenberg1998, p. 116). We interpreted the lower stability of findings regarding the most of determinants of responses as a sign of the functional components of personality.
With regard to the determinants associated with movement, Rausch de Traubenberg (1998) stresses that responses with great movement (K) may be understood as elements of regulation and control that reflect the ego’s role, in addition to evoking indicators of the ability to internalize, and the possession of intelligence, creativity, imagination. Recent studies describe the biological foundation of the human movement response and shows that it is related to the effective use of the mentalization function (Ando et al., Reference Ando, Salatino, Giromini, Ricci, Pignolo, Cristofanelli and Zennaro2015; Giromini et al., Reference Giromini, Viglione, Brusadelli, Zennaro, Di Girolamo and Porcelli2016; Giromini, Porcelli, Viglione, Parolin, & Pineda, Reference Giromini, Porcelli, Viglione, Parolin and Pineda2010).
Grønnerød (2003) discussed that variables related to state-like features of personality in CS were associated with lower stability levels; in his study, for example, state features were defined as the influence of the m (inanimate movement) and Y (shadding) scores and provided indications that state-like features have a negative effect on stability. In our data, the variables kob and FE, has similar theoretical meanings with m and Y, also presented low correlation in test-retest.
When examining the content of responses given to the Rorschach test, we assume they represent indicators of how the individual experiences the test, indicating significant motivations and associative processes that have accumulated over the course of human development experiences. Hence, according to Rausch de Traubenberg (1998), content that results from this method of psychological assessment tends to represent both structural and psychodynamic aspects of personality as an integral part of the perceptive framework. She argues that structural aspects could be revealed by dominating interests/content, showing the individual’s process of adaptation and organization, derived from the unconscious, but which would be situationally expressed in link with a momentary experience and the assessment process underway. These indicators should be considered as a whole to support appropriate interpretative processes.
In this study, we verified that human content presented a higher level of correlation in comparison to the other content analyzed here, presenting moderate temporal stability between the two assessments. Additionally, the stability found in the indexes of banal responses in both assessments reaffirms that for these adult individuals, the ability to socially adapt is preserved and, for practical purposes, did not change over the course of 15 years.
According to Urbina (Reference Urbina2007), test-retest reliability is seen as an “essential prerequisite for [the] validity evidence” (p. 172) of an instrument of psychological assessment. It is interesting to note that the 88 participants composed a normative sample in 1998 and in the retest some characteristics of mental health were preserved. Mihura et al. (Reference Mihura, Meyer, Dumitrascu and Bombel2013) state that “The Rorschach variables with the strongest validity support tended to target cognitive and perceptual processes” (p. 575). This was demonstrated in their validity study and in our findings, considering the Rorschach retest with same individuals after 15 years, we observed good correlation of the number of Response (R), the Global location (G) and in F+ext%.
Despite the good indicators of correlation present in the analysis of some Rorschach French Approach variables, a low level of correlation was found for some others, especially in the determinants of responses. Exner and Sendín (Reference Exner and Sendín1999) state that the temporal factor is the crucial element that imposes difficulties when one intends to formulate prognostics of behavior. These researchers affirm that, even though most of the variables present high correlations of stability over time, there are no perfect correlations in the retest. Additionally, some are functional changes and may result from new experiences, situations that may change the individual’s behavior, while the longer it takes, the greater the need to acquire information concerning individuals’ external circumstances.
Sultan et.al (2006) also note the difficulty in interpreting the stability of results in test and retest studies, especially because in the psychometric tradition, this term is used for subsequent tests over shorter periods of time, in which we assume the construct is stable enough and instability may be attributed to the measurement’s lack of accuracy. On the other hand, in the case of longer intervals, changes underlying the construct introduce an additional effect on the accuracy of data. In a conservative manner, the scientific literature on Rorschach has interpreted lower stability between assessments as a result of situational characteristics, representative of individual states, while high levels of stability for variables is considered to indicate structural components, personality traits (Sultan et.al, 2006).
Despite these possibilities, we see a great difficulty in stratifying or associating Rorschach technical indicators with this didactic scheme regarding to the individuals. It is important to consider that because the analysis of responses, card to card, encompasses a great variety of possibilities. The results presented here show the importance of going beyond findings and seeking effective understanding of individuals. Urbina (Reference Urbina2007) shows that the objectives of the psychological testing go beyond describing the performance of individuals and that the meaning scores may have “issues that go beyond themselves, or fields that are outside the test’s direct sphere.” (p. 183). In the case of the reassessment, possible “fields outside the test’s direct sphere” include changes in behavior that may have taken place, not because of the time elapsed, but because of intra-individual processes and events that took place over the years in the environments of these individuals.
There are many studies in the scientific literature in the field addressing, in different ways, the characteristics of personality in the adult phase. When Hooker and McAdams (Reference Hooker and McAdams2003) present their arguments about the characteristics of developmental stages they state that personality in the adult phase could be seen as stable. They stress that the stability of personality is often considered positive, because as opposed to the physical and cognitive domains, it does not experience loss over the years. On the other hand, this understanding of stable personality tends to hinder a dynamic approach to development in the adult phase (Hooke & McAdams, 2003). Hence, these authors present elements that question the very concept of personality and its relationship with human development.
Erikson’s theoretical proposition can help understand certain changes in the characteristics of personality among the individuals assessed in this study. After all, human emotional balance varies, largely depending on the psychodynamic game (loss and gains) of objects with affective investment. Individuals are, over the course of life, vulnerable to new experiences that have transformative potential and can boost the acquisition of new coping mechanisms. These mechanisms, in turn, can regulate individuals’ emotional responses and adaptation mechanisms (Erikson, Reference Erikson1987). Therefore, changes identified in data obtained using the Rorschach test may not refer to elements of personality structuring but to the expression of psychological functioning.
We can, at this point, ask: Could this dynamic view of psychological functioning (the coexistence of more than one mode of mental functioning) help theoretically understanding of the indexes of stability in some of the variables assessed by the Rorschach test after 15 years? The clinical perspective of psychodynamic basis will probably add elements relevant to the proper interpretation of the results of the Rorschach test, however, the findings regarding elements that are permanent over time also help to understand that there are variables in this method that can represent stable tendencies of individual reactivity, favoring predictions regarding these individuals.
It is important to note that sample size represents a limitation for test and retest studies. Additionally, even though the application of the instrument is standardized; when different researchers apply it, it can also be a factor that affects the way participants reveal themselves during the assessment.
Studies addressing stability of test-retests conducted with the Rorschach test impose challenges in the field of psychological assessments, especially with non-self-report tests. It is important to keep in mind that 15 years passed between the two assessments, which implies a complex network of variables that would require methodological control and detailed monitoring of the individuals to support sufficient interpretations of results. Meyer, Giromini, et al. (2015) discuss that age had no good association with Rorschach variables, and in our study still were differences in Rorschach scores when testing the same individuals at two different points in time. It would be interesting to verify, between the test and retest, whether the changes presented in certain variables were due to the participants’ ages. Additionally, it would be possible to assess how the individuals’ significant experiences would express and possibly affect stable aspects of personality.
Anyway, this study presented empirical evidence of temporal stability of some variables addressed by Rorschach French Approach with Brazilian adults, strengthening its interpretative possibilities. The field of investigation is, however, extremely wide and the field of personality assessment can benefit from the exploration of different considerations proposed by studies addressing the psychometric qualities of psychological instruments as proposed and achieved in this study using the Rorschach test.