INTRODUCTION
Substituting older cultivars (cultivated crop varieties) with newer and improved ones is an important means of sustainably increasing yields, and reducing the potential damage posed by biotic and abiotic stresses. For many smallholders in developing countries, the choice of cultivars and frequent cultivar replacement also contribute to increasing income and reducing livelihood vulnerability (Lipton & Longhurst Reference Lipton and Longhurst1985; Timsina & Connor Reference Timsina and Connor2001). This is especially the case for crops with limited genetic diversity (Heisey Reference Heisey1990; Brennan & Byerlee Reference Brennan and Byerlee1991; Heisey & Brennan Reference Heisey and Brennan1991). While many smallholders throughout South Asia benefited from substituting low-yielding landraces with ‘first-generation’ semi-dwarf cereal cultivars introduced during the Green Revolution of the 1960s and 1970s, the subsequent adoption of next-generation cultivars seems to be occurring at a slower pace (Heisey Reference Heisey1990; Dixon et al. Reference Dixon, Nalley, Kosina, La Rovere, Hellin and Aquino2006). This happens irrespective of the fact that the newer cultivars offer improvements over the earlier ones in terms of yield, output quality, biotic stress resistance and abiotic stress tolerance.
Slow cultivar turnover could be attributed to both supply and demand factors. On the supply side, rate of cultivar turnover is generally associated with inefficiencies in popularizing and marketing new cultivars and their agronomic and economic superiority over the older ones they intend to replace (Witcombe et al. Reference Witcombe, Packwood, Raj, Virk, Witcombe, Virk and Farrington1998). On the demand side, cultivar turnover is constrained by a range of complex economic, social and behavioural factors. Economic factors include not only the price of new seed itself, but also implicit transaction costs in securing seed, opportunity costs associated with seed replacement (relative to saving seeds from previous harvest), the price of complementary inputs (e.g., synthetic fertilizers) and the market price of final output. Related factors include risk aversion (Just & Zilberman Reference Just and Zilberman1983), access to information and credit (Doss Reference Doss2006; Karlan et al. Reference Karlan, Osei, Osei-Akoto and Udry2014), peer effects (Foster & Rosenzweig Reference Foster and Rosenzweig1995) and individual behavioural choices (Duflo et al. Reference Duflo, Kremer and Robinson2011), among others (Jack Reference Jack2011).
Although many earlier studies tend to explore adoption as a fairly stark choice between an old technology and a new one, only a few examine the process of incremental technological change; for example, replacing an improved cultivar with a slightly newer one (Nazli & Smale Reference Nazli and Smale2014). This notion is examined further in the current paper by analysing the supply- and demand-side factors affecting the rate of wheat cultivar turnover in India.
Wheat is one of India's main staple foods and ranks second only to rice in both domestic production and consumption. It is also a main source of energy in the average Indian diet, accounting for 38% of calories from cereals for rural households (GoI 2011, 2012a). In 2011/12, wheat was cultivated across >29·9 million hectares (ha) in the country (DWR 2013). While national and international wheat breeding programmes have succeeded in increasing genetic potential and yield stability (Reynolds & Borlaug Reference Reynolds and Borlaug2006), both seed replacement and cultivar turnover rates remain low in India. Only a minority of farmers (18% in 2006) purchase fresh seeds each year, with the majority using farmer-saved seed (Seednet India 2013). The problem is exacerbated by the deficiency of high-quality seed (Chand & Singh Reference Chand and Singh2011). More worrying is the fact that a much smaller proportion of farmers switch to new wheat cultivars each year. In 1997, the average cultivar age in farmers' field in India – measured as the average number of years that have elapsed since the cultivar was released, weighted by the quantity of seed production for a given cultivar – was between 12 and 14 years (Pingali Reference Pingali1999). In comparison, the average cultivar age of wheat globally was 7 years. Demand for new cultivars was also low during the 1980s and 1990s: according to Witcombe et al. (Reference Witcombe, Packwood, Raj, Virk, Witcombe, Virk and Farrington1998), the average age of cultivars in breeder seed indents (that is, quoted demand for breeder seeds) was 9 years in India during 1984–1993. Average cultivar age – the difference between the year of cultivation and the year of cultivar release – in India not only falls well below international levels, but is also twice the ideal age required to reduce the risks associated with wheat rust (Pingali Reference Pingali1999). This suggests that only a minority of farmers benefit from production efforts to supply quality seed and breeding efforts to improve wheat cultivars.
Compared with the two decades comprising the Green Revolution (1968–1988), productivity growth in wheat yields in India was moderate in the decades that followed: rate of growth in wheat productivity declined from 3·5 to 1·5% per annum (Chauhan et al. Reference Chauhan, Mahajan, Sardana, Timsina and Jat2012; Spielman et al. Reference Spielman, Kolady, Cavalieri and Rao2014). Alongside the relatively low genetic gains of post-Green Revolution cultivars, a multitude of factors ranging from a steady increase in terminal (i.e. excessive) heat during the grain-filling stage to limited adoption of soil and water conservation practices by farmers are closely associated with this yield stagnation (Mehla et al. Reference Mehla, Verma, Gupta and Hobbs2000; Erenstein et al. Reference Erenstein, Farooq, Malik and Sharif2008; Chauhan et al. Reference Chauhan, Mahajan, Sardana, Timsina and Jat2012). Reversal of this trend is a major priority of the Government of India under the National Food Security Mission, and a stated goal of India's national agricultural research system (DWR 2011; GoI 2012b). The development and introduction of improved wheat cultivars is identified as one of the most important means of achieving this target.
Over the last three decades, the public research system of India has released over 280 wheat cultivars (AICRPNSP 2009; 2010; NSP 1998–2008). The cultivars in farmers’ fields today are several generations removed from those released during the Green Revolution era, and are more diversified in terms of suitability to different agro-ecological zones and production conditions (Kundu et al. Reference Kundu, Singh, Shoran and Singh2010). Despite these accomplishments, only a few of these new generation cultivars account for significant portions of area under wheat cultivation (Nagarajan Reference Nagarajan2005). In the mid-2000s, one single cultivar – PBW 343, released in 1996 – occupied >6 million ha of land in the Indo-Gangetic Plains (Joshi et al. Reference Joshi, Mishra, Chatrath, Ferrara and Singh2007). This prevalence confirms that India's wheat farmers principally cultivate just a few mega-cultivars, with each mega-cultivar adapted to a specific agro-ecology and sharing similar traits and susceptibilities (Mohan et al. Reference Mohan, Nagarajan, Singh and Shoran2001). As a result, the spatial genetic diversity of Indian wheat is limited and the production system may be critically vulnerable to biotic and abiotic stresses, placing millions of farmers and food-insecure consumers at risk. While the relatively moderate genetic gains associated with subsequent generations of cultivars could be partly responsible for this situation (Byerlee & Heisey Reference Byerlee, Heisey and Heisey1990; Witcombe et al. Reference Witcombe, Packwood, Raj, Virk, Witcombe, Virk and Farrington1998; Dixon et al. Reference Dixon, Nalley, Kosina, La Rovere, Hellin and Aquino2006), there is a need for a more nuanced understanding on how the supply- and demand-side factors influence the rate of cultivar turnover and area under new cultivars in Indian wheat.
The current paper begins with an analysis of national seed policies, organizations and institutions responsible for cultivar improvement and supply. It then addresses farmers’ demand for new or recently released cultivars and its determinants in a single season by examining the cultivar portfolios among wheat farmers in Haryana state. Throughout this analysis, the focus is on one key metric – an index of cultivar change proposed by Brennan & Byerlee (Reference Brennan and Byerlee1991) in which the average age of cultivars grown by farmers is weighted by the area under cultivation – to measure the rate of cultivar turnover. This measure combines spatial and temporal data, and is negatively related to overall cultivar turnover (Smale et al. Reference Smale, Singh, Di Falco and Zambrano2008).
MATERIALS AND METHODS
Wheat seed supply and demand in India
The wheat seed supply system remains largely a public sector endeavour in India for several reasons, the most fundamental of which is the nature of the crop's reproductive biology (Spielman et al. Reference Spielman, Kolady, Cavalieri and Rao2014). Crops such as rice and wheat are self-pollinating, which means that the grain harvested from one season can be stored and used as seed in the subsequent season without significant yield reduction. Due to the difficulties in ensuring a strong intellectual or biological property rights protection for the seed-related innovations, the market discourages private investment in cultivar improvement and instead relies on the public sector (Jain & Byerlee Reference Jain, Byerlee, Maredia and Byerlee1999; Joshi et al. Reference Joshi, Mishra, Chatrath, Ferrara and Singh2007). In the public sector, breeder seed production follows a fairly standard procedure based on national- and state-level calibration of seed demand estimation (Witcombe et al. Reference Witcombe, Packwood, Raj, Virk, Witcombe, Virk and Farrington1998). Wheat breeding, seed demand assessment, multiplication, regulation, breeder seed production and marketing are carried out by a vast array of predominantly public-sector organizations. At the centre of this array is India's national agricultural research system – the Indian Council of Agricultural Research (ICAR). Under ICAR, germplasm conservation and cultivar improvement in wheat are organized by the Directorate of Wheat Research (DWR) and the All India Coordinated Wheat and Barley Improvement Project (AICWBIP), alongside various state agricultural universities (SAUs). Decisions on which wheat cultivars to produce and in what quantities are made through a closely related set of processes involving many of these organizations. State governments, in consultation with the ICAR institutes, SAUs, cooperatives and private seed producers, forecast breeder seed demand on the basis of current market conditions and information on how the existing and new cultivars perform in terms of actual or potential yield in relevant districts and agro-climatic zones and under specific management recommendations. With this information, each state department of agriculture is expected to undertake advance planning and prepare a master-plan for seed production and distribution over a rolling 5–6-year period, which is then reviewed and compiled by the Department of Agriculture and Cooperation (DAC) under the Ministry of Agriculture (Seednet India 2013). The DAC sets seed production targets and organizes meetings to establish production plans and assess the supply situation of various organizations involved in the seed system, including the National Seed Corporation, the state seed corporations and the private sector. These seed producers then submit requests (‘indents’) for breeder seed to ICAR institutes or their respective SAUs along with pre-payment for the seed. After receiving and compiling indents, ICAR reviews the aggregated demand figures and transmits the indents to the project directors and coordinators of the DRW and AICWBIP for review and fulfilment. Ultimately, the DAC makes the final decisions, based on ICAR's recommendations, on the allocation of breeder seed to seed producers.
Once breeder seed is produced based on the indents, foundation and certified seeds are multiplied. Wheat seed multiplication has historically been undertaken by the National Seed Corporation, the State Farm Corporation of India and the state seed corporations, although cooperative societies and private firms also play a role in the multiplication process (Spielman et al. Reference Spielman, Kolady, Cavalieri and Rao2014). The same entities also manage the marketing end of the business, either directly to farmers or through intermediaries such as input retailers, cooperative societies and progressive farmers. The market is primarily built around a high-volume, low-margin business and is highly dependent on public investment for product development.
The primary weakness in this system of seed multiplication and cultivar dissemination is that its ability to ensure rapid cultivar turnover is critically dependent on the age of quoted indents, and hence on farmer awareness of about the latest cultivars. If agricultural extension networks fail to create wider awareness on the latest cultivars and their relative agronomic and economic superiority over the older and more popular ones, then farmers tend to articulate demand for the latter. Further, the demand and supply estimates rely on available information about historical trends, production capacity, and the government's seed policy and priorities on the introduction of new wheat cultivars (e.g., cultivars that are resistant to a particular type of rust or other biotic stresses), but are not particularly effective in integrating farmer demand into these estimates.
It is also important to note that the official seed demand estimates and supply figures probably capture <20% of all wheat seed sown in India: the remaining share is farm-saved or exchanged between farmers. Hence, there arises a question of whether the official demand/supply estimates of breeder seed represent the effective demand for wheat seed and hence, implicitly, the effective demand for new and improved wheat cultivars. In order to answer this, seed demand may be divided into demand for two distinct product classes – first, the demand for new seed with higher purity or germination rates, and second, for new cultivars that provide relative genetic gains over the existing ones. The official figures on national level breeder seed production represent the most critical means of estimating supply of new seed. Since it is almost impossible to disaggregate national seed indent figures into demand for new seed and that for new cultivars, the present study relies on the household level data to improve the analytical resolution. In the study area, Haryana State, where most of the wheat farmers replace seed every year, the on-farm cultivar age would represent the demand for new cultivars.
Data
Data used in the current study are drawn from two major sources: national-level data on breeder seed indents and production come from the AICWBIP, while farm-level data were obtained from a survey of wheat-farming households in Haryana conducted in 2010. Although aggregate farmer demand for wheat cultivars is reflected in national breeder seed indents from the AICWBIP data, only household data can (1) distinguish between seed replacement and cultivar turnover, and (2) provide a clear sense of the micro-level determinants of cultivar turnover. The analysis of this combination of data makes the current paper novel in shedding light on the reasons for slow cultivar turnover in Indian wheat sector.
The national-level data on breeder seed indents and production cover the agricultural years from 1997/98 to 2009/10 (with missing data for 2002/03) and are disaggregated to cultivar level. Since breeder seed is only produced based on previously placed indents and is ultimately destined for the certified seed production for farmers’ use, one may argue that an examination of indent structure could reveal the popularity of different cultivars. However, the multiplication rates of generating foundation and certified seed from breeder seed could differ across cultivars, making such cultivar demand estimation only approximate. These data allow generation of a measure that captures approximate cultivar turnover rates. There are several measures proposed in the literature, for example, Johnson & Gustafson (Reference Johnson and Gustafson1962), Brennan (Reference Brennan1984), and Brennan & Byerlee (Reference Brennan and Byerlee1991), which differ only slightly. The current paper follows Brennan & Byerlee (Reference Brennan and Byerlee1991), who use the average age of wheat cultivars in production to represent cultivar turnover. This measure can be calculated using the average age of the top n cultivars produced by the national breeding program, weighted by the quantity produced (or indents placed) as breeder seed. It is particularly useful because it assesses cultivar age at an upstream point in the supply chain, i.e., at the point where breeder seed is multiplied for seed producers rather than where certified seed is multiplied for farmers. Average cultivar age can also be calculated in a similar manner using cultivar age weighted by quantity of certified seed produced by public and private seed producers. This provides an insightful measure of the age of cultivars that are circulating in the seed market.
Household-level data are based on a farmer survey conducted in the state of Haryana in north-western India. Haryana is situated in the highly productive western tracts of the Indo-Gangetic Plains and possesses a high cropping intensity level (200%) resulting from the crop rotation of rainy kharif season rice followed by dry rabi season wheat (Krishna et al. Reference Krishna, Mehrotra, Teufel and Bishnoi2012a). The state is the second largest producer of wheat in India (after Punjab) and, in comparison with many other wheat-producing states, is characterized by high seed replacement. The survey employed a stratified random sampling frame to select 323 farm-households across 18 villages in three districts (Karnal, Kurukshetra and Yamunanagar) that were cultivating wheat during the 2009/10 rabi season. The stratification was done at the district level, and the sampling frame can be considered as representative of the wheat production systems of the state. Half of the villages were selected randomly, and the other half deliberately, for participation in the Cereal Systems Initiative for South Asia (CSISA). The CSISA is an international collaboration that began in 2009 to accelerate cereal production and productivity growth in South Asia's most important grain baskets through contribution of new science and technology (cf. CIMMYT 2013). No significant difference was observed between the two groups of villages with respect to household demographics, and the village-level descriptive statistics suggest that most of the sampled villages are similar in terms of land-use patterns, cropping patterns, rotations and proportion of population involved in agricultural production.
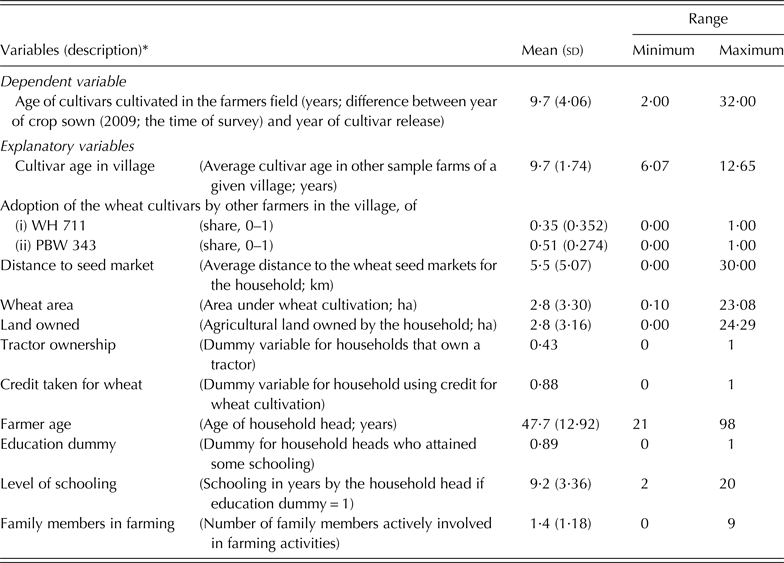
Household interviews were conducted with the (typically male) heads of household, for which a structured questionnaire was used. Topics including household demographics, landholdings, land allocation across crops, seed and other cultivar use, production and disposal and other key indicators were covered. The household interviews were accompanied by village surveys on topics related to village-level characteristics such as physical and market infrastructure, and social services. The descriptive statistics of the sampled households and villages are provided in Table 1.
Summary statistics

* Number of observations: 323.
The household-level dataset was used to estimate the determinants of cultivar adoption pattern. Here, the ‘newness of a cultivar in the system’ is calculated at the farm level by using the age (difference between the year of cultivation, i.e., 2009/10 and the year of official cultivar release in India) weighted by acreage under cultivation. This allows for more in-depth analysis of cultivar aging as it relates farmer, farm-household and village characteristics that determine the adoption of improved cultivars. However, it should be noted that this measure is not at all analogous to the conventional seed replacement rate used in official figures cited earlier, nor is the focus on seed replacement rates. Rather, this measure is indicative of the cultivar turnover rate of the local seed distribution system as a whole, but not of the farm-household. For example, a farmer might have only recently adopted a cultivar that was released several years earlier by the public seed supply system. In this case, the cultivar is new for the household, but its adoption is still associated with a slow cultivar turnover at the system level. In short, micro-level cultivar adoption data does not indicate the speed of turnover by the households, but a study of its determinants is expected to shed light on the reasons behind slow rate of turnover at the system (e.g., state, national) as a whole.
The determinants of farmer adoption of recently released cultivars include both farm-level and village-level factors. There exists a wide variation in land ownership and size of operation. The land rental market is quite vibrant in Haryana, with a high degree of heterogeneity in land characteristics and rental rates. In general, it is the large farmers who lease-in more land to exploit the economies of scale. A census in the selected villages of the state showed that the land owned by farmers who also lease in land is 2·46 ha (against 1·87 ha by other farmer households), and they cultivate in 4·94 ha (against 1·77 ha by others) (Krishna et al. Reference Krishna, Mehrotra, Teufel and Bishnoi2012a). Farm size was found to be only moderately correlated to area under wheat cultivation and hence both are included in the econometric analysis on cultivar turnover at the-farm level.
In relative terms, households in the sample are wealthy when compared with those in other regions of India. This is shown by indicators such as tractor ownership – a productive asset owned by 43% of households in the sample. It is also evident from the relatively limited occurrence of credit scarcity among these sampled households. This is in contrast to the numerous studies indicating that smallholder production is constrained by limited access to credit for variable costs of inputs such as seed, fertilizer, machinery or hired labour (Dixon et al. Reference Dixon, Nalley, Kosina, La Rovere, Hellin and Aquino2006).
Empirical strategy
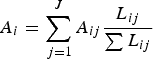
The empirical model that draws on household data estimates the determinants of adoption of recently released cultivars at the farm-household level along the lines of Heisey & Brennan (Reference Heisey and Brennan1991). This is done by calculating the cultivar turnover as described earlier, where the average age in the seed system for a cultivar adopted by a given farmer is weighted by the area planted to each cultivar, that is:
 $${A_i} = \sum\limits_{\,j = 1}^J {{A_{ij}}\displaystyle{{{L_{ij}}} \over {\sum {{L_{ij}}}}}} $$
where A i is the average age of cultivars cultivated by the ith household, A ij is the number of years between 2009 (the year of sowing) and the year of official release of jth cultivar maintained by ith household and L ij is the area under the jth cultivar on the ith household's farm. Each of the sample wheat farmers is associated with an average ‘cultivar age’ that is calculated by cultivar portfolio during the year of survey. This measure is simple to calculate and avoids the use of arbitrary definitions of ‘newer’ and ‘older’ cultivars in the seed distribution system (Witcombe et al. Reference Witcombe, Packwood, Raj, Virk, Witcombe, Virk and Farrington1998). Further, multiple regression models are estimated with on-farm average cultivar age as a function of a number of farm, household and village characteristics. Although this measure is estimated at the farm level, it captures two features of the (macro-level) wheat seed distribution system: the relative speed (diffusion) at which a new cultivar is adopted by farm-households (a lower age represents a highly responding wheat cultivar system with efficient dissemination) and the cultivar turnover rate of the system. This measure is different from the conventional seed replacement rate. Most of the sample farmers purchase seed every year instead of relying on their own saved seed, and they select a portfolio that includes cultivars that are released at different points in time.
Certain village-level attributes were expected to explain the patterns of cultivar turnover. For example, remoteness of the village from the formal seed market is included as a village-level attribute that limits cultivar turnover. A given village's collective receptiveness to technological change was also considered as a factor encouraging cultivar turnover. This effect may operate through social networks, through the dynamics of collective action or through any other channels (Foster & Rosenzweig Reference Foster and Rosenzweig1995; Munshi Reference Munshi2004; Matuschke & Qaim Reference Matuschke and Qaim2009). To capture this potential social network effect, the average age of cultivars in other farmers’ fields in the village was considered, and it was hypothesized that this variable is positively correlated with the cultivar age of individual farmers. In an alternative specification, the adoption rate of two relatively older cultivars (WH 711 and PBW 343) by other farmers in the village was also considered, with a similar expectation of positive correlation. Necessarily, these variables may be endogenous because it cannot be directly inferred whether the average behaviour of farmers in the village influences the behaviour of the individuals that comprise the village, or because the farmers in the village sample share similar individual characteristics or face similar conditions that affect their individual decisions (Manski Reference Manski1993). Strong instruments, panel data, or other identification strategies (cf. Bandiera & Rasul Reference Bandiera and Rasul2006; Conley & Udry Reference Conley and Udry2010; Foster & Rosenzweig Reference Foster and Rosenzweig2010; Maertens Reference Maertens2012; McNiven & Gilligan Reference McNiven and Gilligan2012) can be used to resolve this reflection problem, but such strategies are not applicable given the cross-sectional household data used in the current paper, thus restricting the ability to infer causality.
With respect to household attributes that might explain patterns of cultivar turnover, a number of variables were included that are both consistent with the theory on adoption determinants and empirically testable. First, it was expected that the households with greater wealth or larger operational landholdings would cultivate varieties that have been released more recently when compared with poorer households or households with smaller operational landholdings. The deterministic pathway is well-documented in the adoption literature: the large farmers are able to manage risks better, easily obtain relevant information and cover the transaction costs associated with early adoption of technology (Feder & O'Mara Reference Feder and O'Mara1981). These relationships are also relevant for a study on cultivar turnover (Brennan & Byerlee Reference Brennan and Byerlee1991; Smale et al. Reference Smale, Singh, Di Falco and Zambrano2008). It was also expected that households with greater experience (represented by the age of the household head) and education (measured in terms of the years of schooling completed by the household head) would be likely to cultivate varieties that have been released more recently. This hypothesis is also consistent with the literature on technology adoption (Doss Reference Doss2006; Foster & Rosenzweig Reference Foster and Rosenzweig2010). However, the importance of experience and education may be nullified if information associated with new cultivar adoption – for example, changes required in input use or agronomic practices – are not very difficult to decipher by farmers (Duflo et al. Reference Duflo, Kremer and Robinson2011).
RESULTS
Before providing the household-level adoption estimates based on the approach detailed above, results from analysis of the official demand estimates and supply figures for wheat seed in India are presented.
Demand for breeder seed: analysis of national-level data
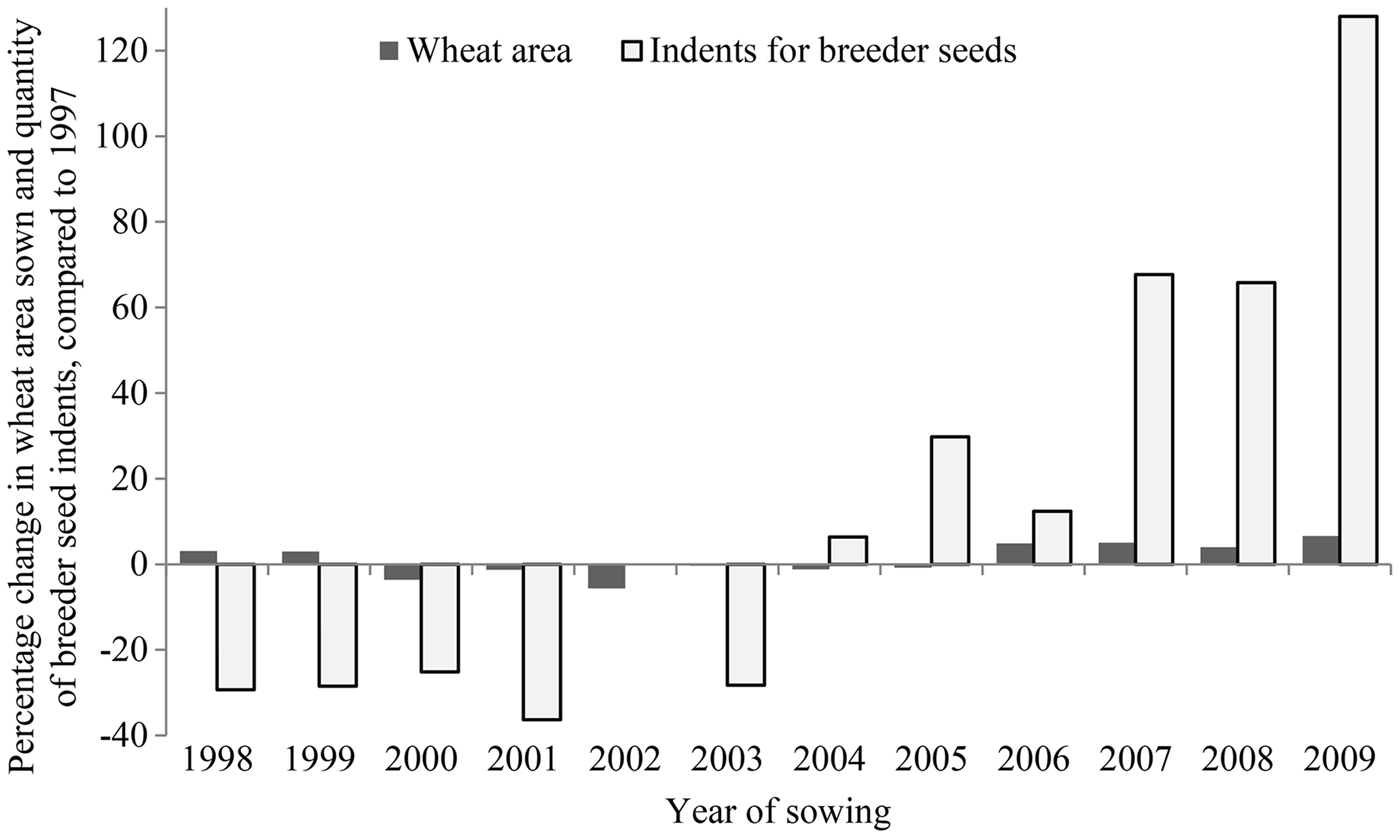
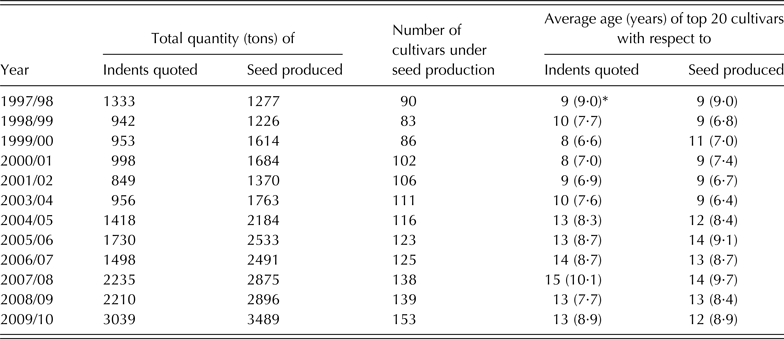
Analysis of the breeder seed indent data indicated that the average cultivar age for wheat in 2011/12 was >12 years, which is twice the age of recommended cultivar turnover rate (6 years). Table 2 and Fig. 1 provide a picture of the changing scenario with respect to official demand for breeder seed between 1997/98 and 2009/10 based on indents. The numbers indicate that demand has more than doubled over the period and has increased at a fairly constant rate. When plotted against the official figures for area under wheat cultivation, growth of breeder seed demand exceeds the area expansion after 2004. This suggests that the quantity of new seed demanded has been increasing steadily, which further indicates an increase in seed replacement and market purchases over the period.
Change in wheat area and breeder seed demand over time. Data on seed indents were not available for 2002. Changes are computed with reference to the 1997 figures.
Indent and production of wheat breeder seed in the public sector of India
However, does the increase in demand for new seed necessarily translate into demand for new cultivars? A closer look at the numbers for breeder seed production does suggest a clear increase in cultivar diversity. In 1997/98, about 90 cultivars were under breeder seed production, and by 2009/10 this figure had increased to >150. Further, the ten cultivars in greatest demand accounted for 75% of total wheat seed indent during 1984–1993 (Witcombe et al. Reference Witcombe, Packwood, Raj, Virk, Witcombe, Virk and Farrington1998), and the corresponding figure was only 49% in 2009/10. Since seeds are not usually produced for a cultivar with no stated indent, the increase in number of cultivars under breeder seed production suggests that India has seen (1) an increase in farmer demand for new cultivars and cultivar diversity and/or (2) an increase in government efforts to promote new cultivars and greater cultivar diversity.
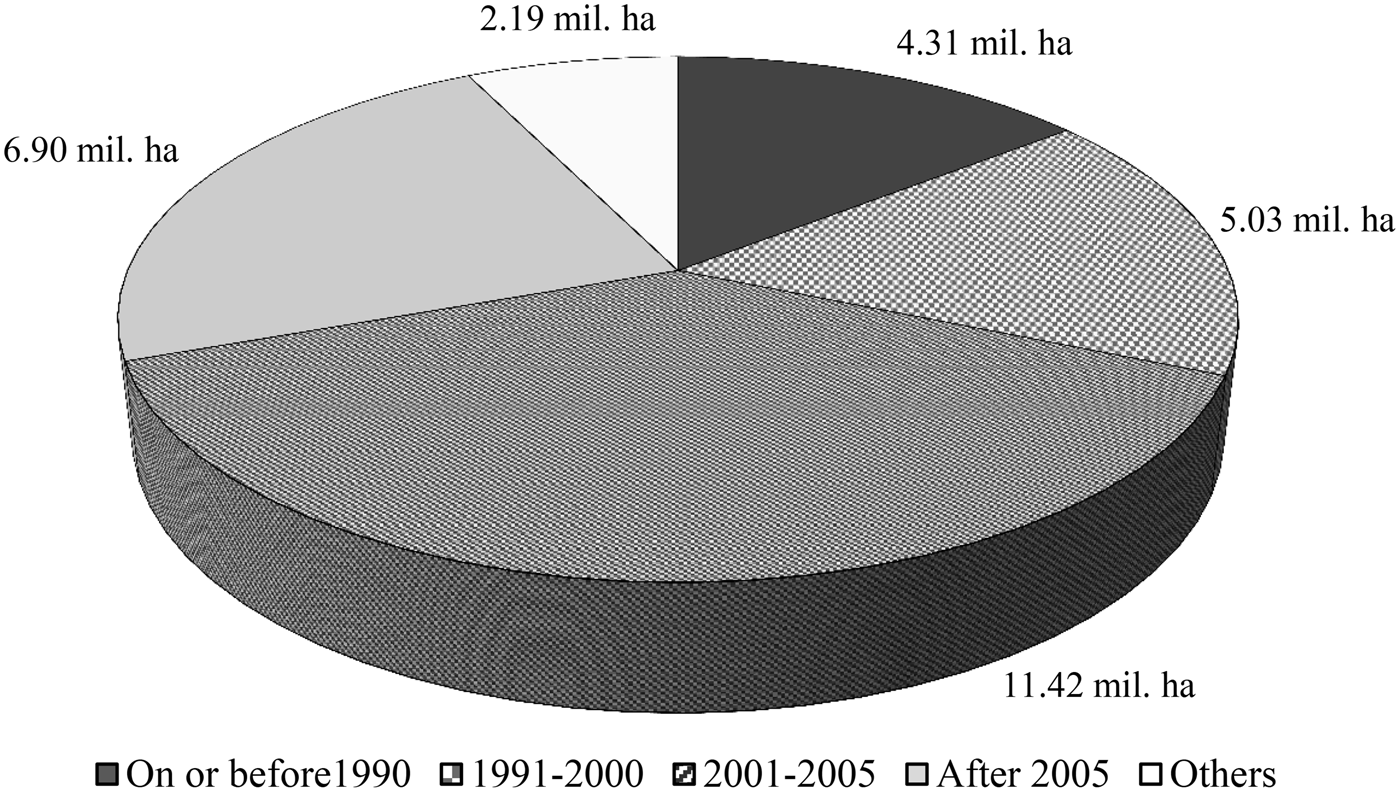
However, closer analysis of these official figures also shows a clear and increasing trend in average cultivar age (Table 2). Prior to 2001/02, the average cultivar age for breeder seed indents was 9–10 years. After 2005/06, the average cultivar age increased to 13–14 years. Out of the top 20 most popular wheat cultivars in 2011/12, eight were released before 2000 and occupy 31% of total wheat area in India (Fig. 2). These findings indicate quite the opposite of what is suggested above, namely, (1) a decrease in farmer demand for new cultivars, and/or (2) the absence of government efforts to promote new cultivars.
Area coverage of wheat cultivars in India in 2011/12, with respect to year of release. ‘Others’ represent cultivars outside the top 20 list, published in the annual report of Directorate of Wheat Research in 2013. The data were presented at 52nd All India Wheat and Barley Workers Meeting, Kanpur.
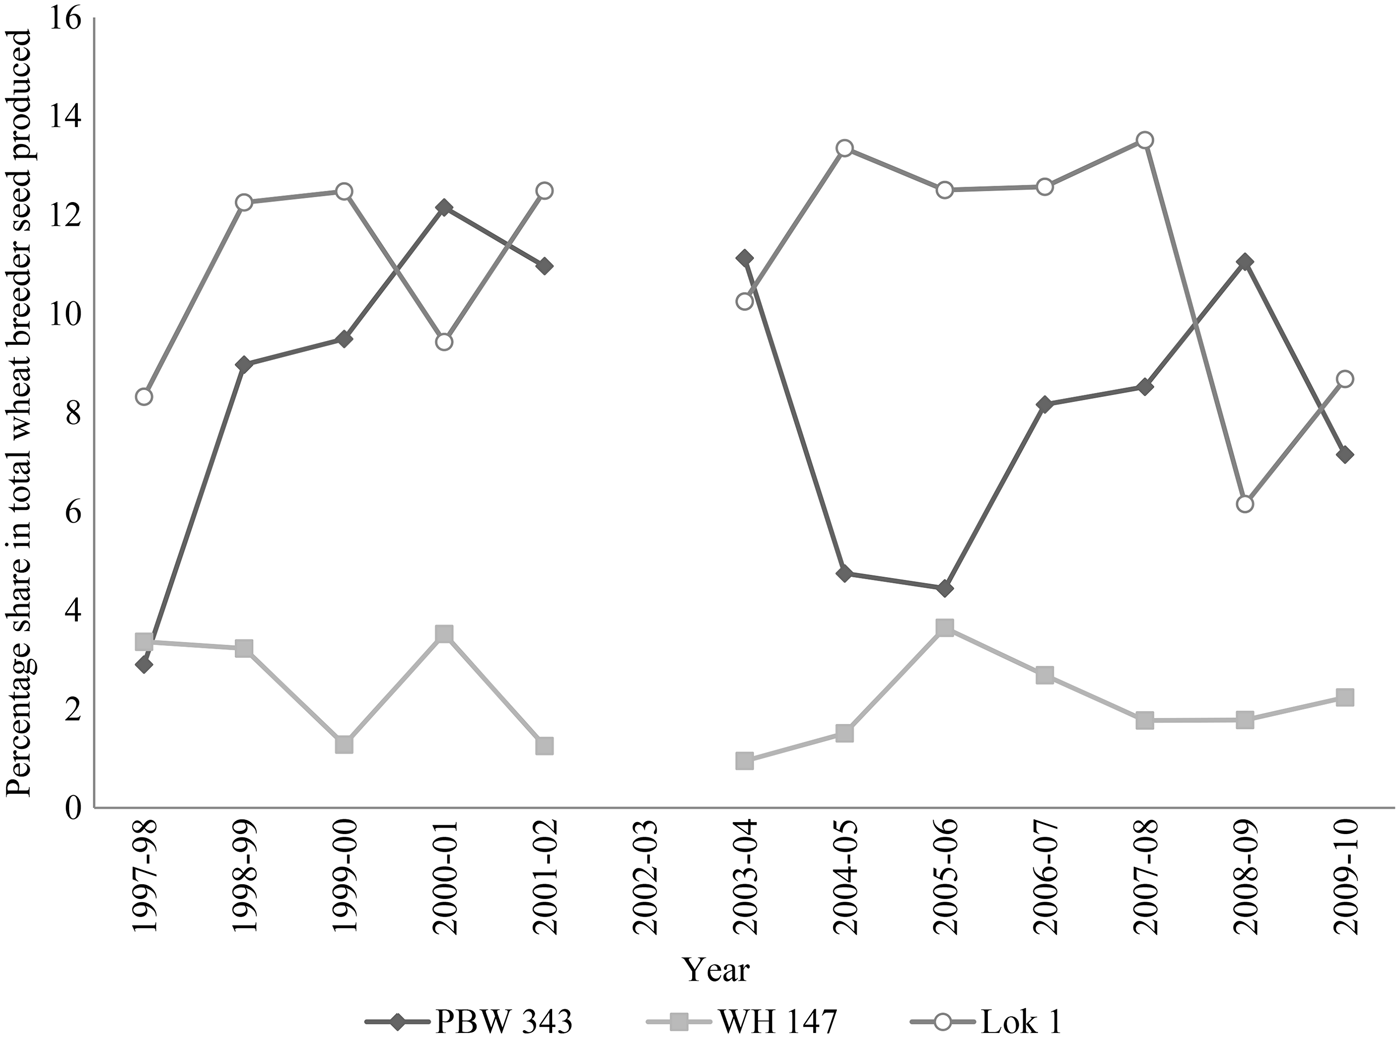
To be clear, an increase in cultivar diversity comes at the expense of older cultivars that need to be replaced. The older wheat cultivars that continue to dominate breeder seed indents include PBW 343 (released in 1996) and Lok 1 (released in 1982). These two cultivars occupied the first and second ranks, respectively, in both breeder seed indents and production during most of the recent years, and together accounted for 15% of total seed indents in 2009/10. Lok 1 is dominant in India's central zone and is popular among farmers due to its good grain quality (Mohan et al. Reference Mohan, Nagarajan, Singh and Shoran2001). Cultivar PBW 343, on the other hand, provides a combination of traits that allows it to perform well under diverse agro-climatic conditions, and is especially popular in the north-western Indo-Gangetic Plains. Krishna et al. (Reference Krishna, Aravindakshan, Chowdhury and Rudra2012b) reported significant yield loss associated with PBW 343 adoption in the eastern Indo-Gangetic Plains. An even older cultivar – WH 147, released in 1977 – also accounts for a non-trivial portion of breeder seed indents. Further, there is no evidence of a consistent decline in seed indents recorded for these three cultivars during the last decade (Fig. 3). Replacement of these cultivars is critically important since the ideal cultivar age required to reduce the risks associated with wheat rust in a production system is estimated at <6 years (Pingali Reference Pingali1999). Yet this does not seem to occur, irrespective of official recommendations that discourage breeder seed indents for old and rust-susceptible cultivars like PBW 343, Lok 1 and WH 147. These recommendations – when followed with purposive reductions of breeder seed indents – constitute the national research system's main (and possibly only) means of ‘nudging’ cultivar turnover in a particular direction. This was observed, for example, with the purposive reduction of breeder seed production for Lok 1 in favour of less rust-susceptible, newer cultivars in 2007/08 and 2009/10 (DWR 2011). The scenario appears to be a response to this official intervention, at least occasionally, and the share of breeder seed production for these cultivars is found declining in some years. For example, in 2011/12 crop season, the highest indent was registered for the cultivar PBW 550, which was released only in 2008 (DWR 2013).
Breeder seed production of three mega-cultivars of wheat in India. Data were not available for 2002/03.
However, there are two issues that still warrant attention. First, a surplus of breeder seed production relative to the submitted indents is often reported in the case of older cultivars like Lok 1, WH 147 and Raj 3077 (cultivar released in 1989), while production for some of the promising new cultivars (for example, DBW 17) was below the indents submitted in many years. This discrepancy in favour of older cultivars poses a supply-side constraint in promoting cultivar turnover. Second, the demand of farm households tends to be towards older cultivars due to the lack of information on their recently available alternatives, making the regulatory efforts to reduce cultivar age inconsistent over time. For example, after a short phase of decline in 2008/09, the seed indent for Lok 1 is reported to have increased again in recent years (for 2011/12 season; DWR 2013), indicating that farmers may not consider the new cultivars meant to replace Lok 1 as effective substitutes. There are not many studies existing that examine the reasons behind this demand adhesiveness, including the potential impacts of consumption preferences (Rashid et al. Reference Rashid, Dorosh, Malek and Lemma2013).
Demand for recent wheat cultivars: analysis of household-level data
In order to better understand farmer demand and heterogeneity in demand patterns, the household survey data from Haryana will now be examined and the micro-level determinants of cultivar turnover estimated. Specifically, the individual and village attributes that affect adoption of recently released cultivars are examined, which could form the basis for determining cultivar indents and seed production and for accelerating the rate of cultivar turnover in Indian wheat.
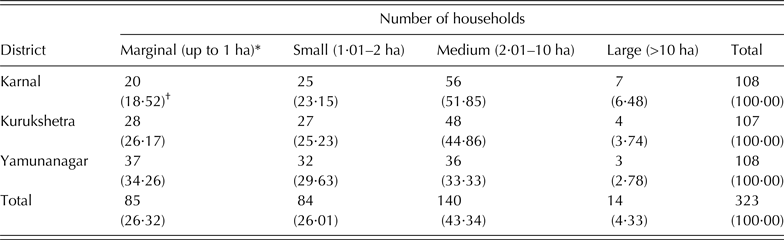
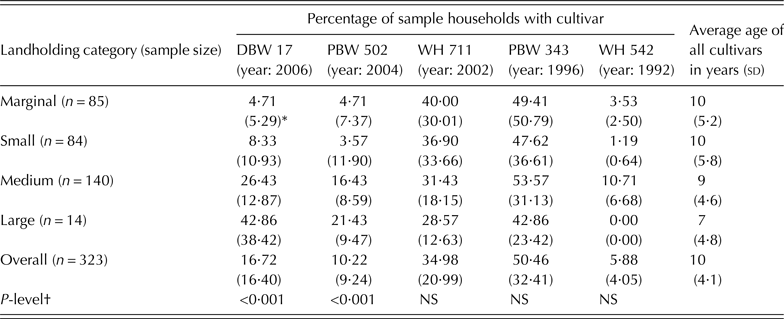
One of the potential determinants of farmer inclusion of recently released cultivars in the cultivar portfolio is landholding size, as this variable is not only positively associated with the scale of operation, but also represents asset status, credit worthiness and often the social status of the farm-household. Table 3 categorizes households by operational landholding size. The distribution of different classes of farms across the three study districts is similar, with the sample comprising mostly of medium-sized (2–10 ha) farms (43%), followed by marginal-sized (up to 1 ha) and small-sized (1–2 ha) farms (26% each). The distribution of most important cultivars (DBW 17, PBW 502, WH 711, PBW 343 and WH 542) cultivated across different farm categories are presented in Table 4. It can be observed that farmer adoption is in tune with the secondary data on the most popular wheat cultivars of the north-western plain zone of India (DWR 2013). The sampled households are found to cultivate varieties that were released 9·74 years ago, which is 60% greater than the recommended 6-year turnover rate. The most recent wheat cultivar in farmers’ field is 2 years old (PBW 550, HD 2932); the oldest is 40 years (C 306). Less than 1% of sampled farmers adopted C 306 during the 2009/10 wheat season, and even after excluding such exceptionally old and sparsely adopted cultivars from the sample, the average age only decreases to 9·5 years, underlining the robustness of current estimates.
Operational holding of sample farmers of Haryana
* The common intervals used for farmer categorization based on operational holding in India are followed here also (cf. Datt & Sundharam Reference Datt and Sundharam2000).
† Percentage of wheat farmers.
Source: Authors.
Farmer adoption of wheat cultivars in the study area
* Percentage of wheat acreage.
† P-values are derived from a χ 2 test (with trend) to test whether the percentage of households adopting a cultivar is correlated with the landholding category.
Source: Authors.
The rate of adoption of modern wheat cultivars in Haryana, based on the sample estimates, is higher than the all-India average based on the analysis of breeder seed indents presented earlier, but is significantly lower than the rate prevailing in many developing countries. Despite the widespread perception that farmers in Haryana are progressive early adopters, the average cultivar age does not surpass the rate recommended for avoiding genetic deterioration. Within the sample, the use of recently released cultivars is frequent among households operating larger farms (with average cultivar age of 6·93 years) although such households are only a minority (4%) of the sample.
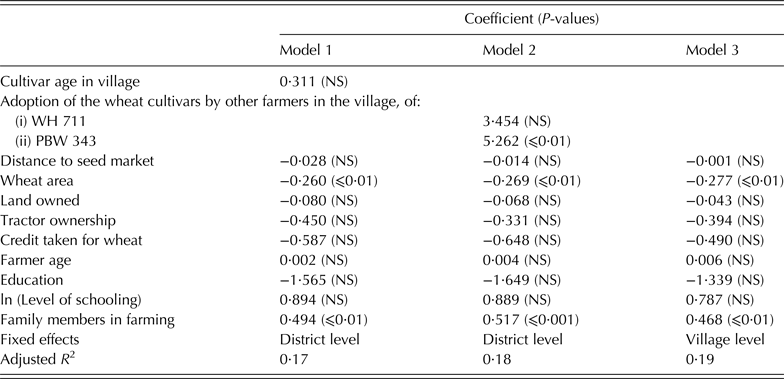
Several results emerged from the estimation of determinants of average age of wheat cultivars in sampled farmers’ fields (Table 5). First, the average age of wheat cultivars in the fields of other farmers in the village was found to be positively associated with the average age of household i's cultivars, as shown in Model 1. This effect was more pronounced with respect to PBW 343 adoption dummy in Model 2, suggesting that the social networks are closely associated with prevalence of older cultivars on farm, although the inferences are subject to the limitations discussed earlier. Second, the distance to the nearest seed market was not significantly related to a household's average cultivar age, suggesting that spatial and infrastructural factors may not play a significant role in cultivar adoption in Haryana. This stands to reason given the state's relatively small size and good road network, facts that are not true for other Indian states.
Determinants of average age of wheat cultivars on-farm*
* Dependent variable is average age of wheat cultivars cultivated on-farm, weighted by their share of cultivated area. Cultivar age is calculated as the difference between year of cultivation and year of official cultivar release.
Third, although asset ownership – landholding size and tractor ownership – was not a statistically significant determinant of average cultivar age, the area of wheat under cultivation was both significant (P ⩽ 0·01) and negative in sign. Specifically, marginal increase in wheat area by 1 ha was associated with a reduction in average cultivar age of 0·28 years. The potential mechanism for this is fairly clear: farmers with larger investments in wheat cultivation may be more willing or able to experiment with, and eventually adopt, more recent cultivars.
Fourthly, the coefficient estimate for share of household members involved in farming was statistically significant (P ⩽ 0·01) and positive in all the models estimated. One possible explanation is that the number of household members that are active in farming reflects the household's relative poverty status, such that poorer households rely more on own-household labour and are also more risk-averse in cultivar turnover decisions. Another more generic explanation is that if the decision to cultivate a new cultivar requires consensus among key family members who are involved in farming, then opinion formation and decision making become more difficult and time-consuming, causing households to forgo cultivar turnover in order to minimize conflict.
Finally, education and years of schooling were explored. When the year of schooling obtained by the head of the household was directly included in the model, it showed no significant effect. Further examination revealed that although educated farmers generally used more recently released cultivars, there was a negative relationship between years of schooling and age of the cultivars adopted. To address this contradiction, a dummy variable was constructed for strictly positive values of schooling and a term to enable this dummy variable to interact with logarithm of years of schooling, following Battese (Reference Battese1997). The coefficient of interaction term was only weakly significant (P ⩽ 0·10) in Models 1 and 2, while the dummy variable was not significant. Although the level of significance was reduced in the village-level fixed effects model, the magnitude of impact was still comparable. These results are somewhat contrary to expectations and the existing adoption literature. Several explanations seem feasible: some level of education is necessary to obtain information from mass media, such as newspapers. However, higher level of education may simply be an unimportant determinant to cultivar turnover in an area where technology adoption – specifically, adoption of new cultivars – has been central to production practices for more than four decades. Alternatively, preferences for the older mega-cultivars may be difficult to change, in that well-educated farmers are fully aware of the possibly high switching costs associated with newly introduced cultivars, and hence unwilling to incur them.
DISCUSSION
The analysis of national and household-level data raises several pertinent issues regarding the functioning of cultivar dissemination system in India. Despite the government's attempts to increase cultivar turnover rates, wheat farmers continue to demand and cultivate older cultivars, which could potentially expose their crop to biotic and abiotic stresses, especially stresses associated with the proliferation of the stem-rust race Ug99. The persistence and prominence of mega-cultivars of wheat pose critical questions regarding the efficacy of the research, development and delivery system in catering for farmer demand for certain key cultivar attributes. As indicated by Witcombe et al. (Reference Witcombe, Packwood, Raj, Virk, Witcombe, Virk and Farrington1998), this persistence causes tremendous economic loss in terms of potential yield foregone. Resource-poor marginal farmers are affected disproportionately, as the cultivars grown by them are older than the average. On the other hand, the strategy of reducing breeder seed production of older varieties and neglecting cultivar demand patterns can easily backfire if farmers are unaware of the newer cultivars and continue to cultivate the older ones, or revert to a supply system that relies only on farm-saved or locally exchanged seeds. Also, it is difficult to expect seed producers to multiply and market new (and thus less popular) cultivars, and similarly difficult to expect farmers to immediately adopt them. Hence, the only real solution to increasing cultivar turnover in Indian wheat is to revitalize and diversify public promotion programmes (e.g., demonstration plots, agricultural fairs, participatory varietal evaluations and other means of popularization) to create wider awareness of new cultivars immediately after their release.
The efforts to uncover cultivar demand and heterogeneity in demand patterns in Haryana by the current study should be taken as an illustration of one way that the public sector could enhance the supply of improved wheat cultivars to farmers in India. Farm-level data analysis reveals the following patterns. One, there may be social network effects at play that effectively repress the cultivar turnover, although inferences of causality cannot be made with these data. Two, the scale of wheat cultivation is a stronger determinant of cultivar turnover than asset ownership. Three, reliance on own-household labour tends to constrain cultivar turnover. These findings may suggest that extension programmes and other distribution mechanisms that aim at accelerating cultivar turnover need to invest in obtaining a better understanding of the role of social network effects, particularly with respect to alternative approaches of disseminating information on new cultivars. These programmes may also need to invest in reaching out to poorer households more directly, or at least rethink the commonly accepted strategy that larger, more progressive farmers will effectively demonstrate and convince smaller, more risk-averse farmers to adopt new cultivars. Finally, these programmes may need to invest more in understanding why the demand for older cultivars remains so sticky, for example, whether educated or otherwise knowledgeable farmers stick with older cultivars because of some specific cultivar qualities (for example, consumption qualities of the grain), and if so, whether wheat breeding programmes might need to focus more on developing cultivars with these attributes than pursuing yield criteria alone.
In both absolute and relative terms, public investment remains the salient feature of India's wheat breeding, production and distribution systems since the Green Revolution era. Private sector involvement is limited mostly to multiplying and supplying certified seeds, and this might not change anytime. Hence, in contrast to most other crops – for which the cultivar development programme of the private sector comes in direct competition with that of the public sector to capture the seed market share – effective collaborations between these sectors are quite feasible in case of wheat in India. This would alter the current scenario where the rate of wheat cultivar turnover is solely determined by regulatory policies, investments and programs of the public sector. Greater consideration of participatory breeding approaches to wheat cultivar improvement, and public investment to connect the farmers to the recent developments in crop breeding, such as improved extension programmes, may also be desirable. Further exploration of the role that private firms might play in research, development and delivery of improved wheat cultivars may also be an area for consideration. Finally, on the research side, studies with greater methodological rigor are necessary to explore the relationships between cultivar turnover and household- and village-level characteristics.
This study was prepared as a contribution to the Cereal Systems Initiative for South Asia (CSISA) with financial support from the United States Agency for International Development and the Bill and Melinda Gates Foundation, and under the leadership of the International Maize and Wheat Improvement Center (CIMMYT) and International Rice Research Institute (IRRI). The paper has been greatly benefitted from the numerous useful comments from Arun K Joshi, Stephen R Waddington, Subash Ghimire and many researchers of International Food Policy Research Institute (IFPRI). The authors are grateful to Dalip Bishnoi, Lijo Thomas and scientific colleagues of CSISA for their helpful inputs during data collection. The usual disclaimers apply.